- My personal website/
- Teaching Portfolio/
- Corporate strategy in a network perspective/
- Session 3: Collecting network data/
Session 3: Collecting network data

Table of Contents
Session 3 - collection and construction of network data
In this session, you are faced with an important decision in regard to data collection for your exam projects. There are three possibilities:
You use the
den17data set, find a subset and analyze it with appropriate tools covered during the courseYou collect data using
orbis, find a suitable subset and analyze it with appropriate tools covered during the courseYou collect your own relational data, create a graph object and analyze it with appropriate tools covered during the course
First, I will highlight how you can find subsets of the data set den17. We start by setting our working directory using setwd() and loading our packages. We load the data set den17 and filter the sector column by corporations.
This time, we also load an additional R.file called custom_functions.R which can be downloaded below. Please place this R.file in your r folder.
## load working directory
setwd("/Users/alexandergamerdinger/Desktop/PhD/teaching/virksomhedsstrategi_forår_2022")

# libs
library(data.table)
library(tidyverse)
library(igraph)
library(ggraph)
library(readxl)
library(writexl)
library(graphlayouts)
source("r/custom_functions.R")

# Load and manipulate data set --------------------------------------------
# Load
den <- read_csv("input/den17-no-nordic-letters.csv")

# we'll be looking only at corporations, that have a valid company ID in the
# Danish register for firms (the CVR register)
den1 <-
  den %>%
  filter(sector == "Corporations") %>%
  filter(!is.na(cvr_affiliation))
We load the custom_functions.R file by putting it into the source() function. After this is done and executed, we have loaded, among others, the following custom functions into our environment:
the function
show.all.tags()which allows us to see all the tags of the data setden. This can be applied either on the raw data set or on any subset ofdenthat contains the same column structurethe function
has.tags()which allows us to subset the data setdenby specific tagsthe function
clean_orbis()which loads an excel file from Orbis, selects a specific set of columns and cleans them
3.1 Sub-setting the data set den
We can see all tags of the raw data set den by using the function show.all.tags(). Below, only the first 20 entries are shown.
# all tags of company boards
show.all.tags(den1)[1:20, ]
##               Positions affiliations
## Animals              27            3
## Architecture         93           14
## Banks               354           36
## BILH                186           44
## Business              8            1
## BYGG                282           43
## Charity              16            1
## Children              8            1
## Clothing             11            1
## Commerce             46            6
## Commercials          37            7
## Communication        51           12
## Construction         48            8
## Consultants          97           21
## Consumers            11            1
## Corporation        7322         1120
## Counseling            5            1
## Culture             159           23
## Design               13            2
## DETH                184           28
To actually subset the data set, we can use the has.tags() function. This function can be applied to each tag (or several tags) that are found in the list above. There are three output options: the option "den", which reproduces the den17 data set, the option “affil" which gives a vector of affiliations and the option "name" which gives a vector of names.
The R chunk below only shows the first 20 rows for each output.
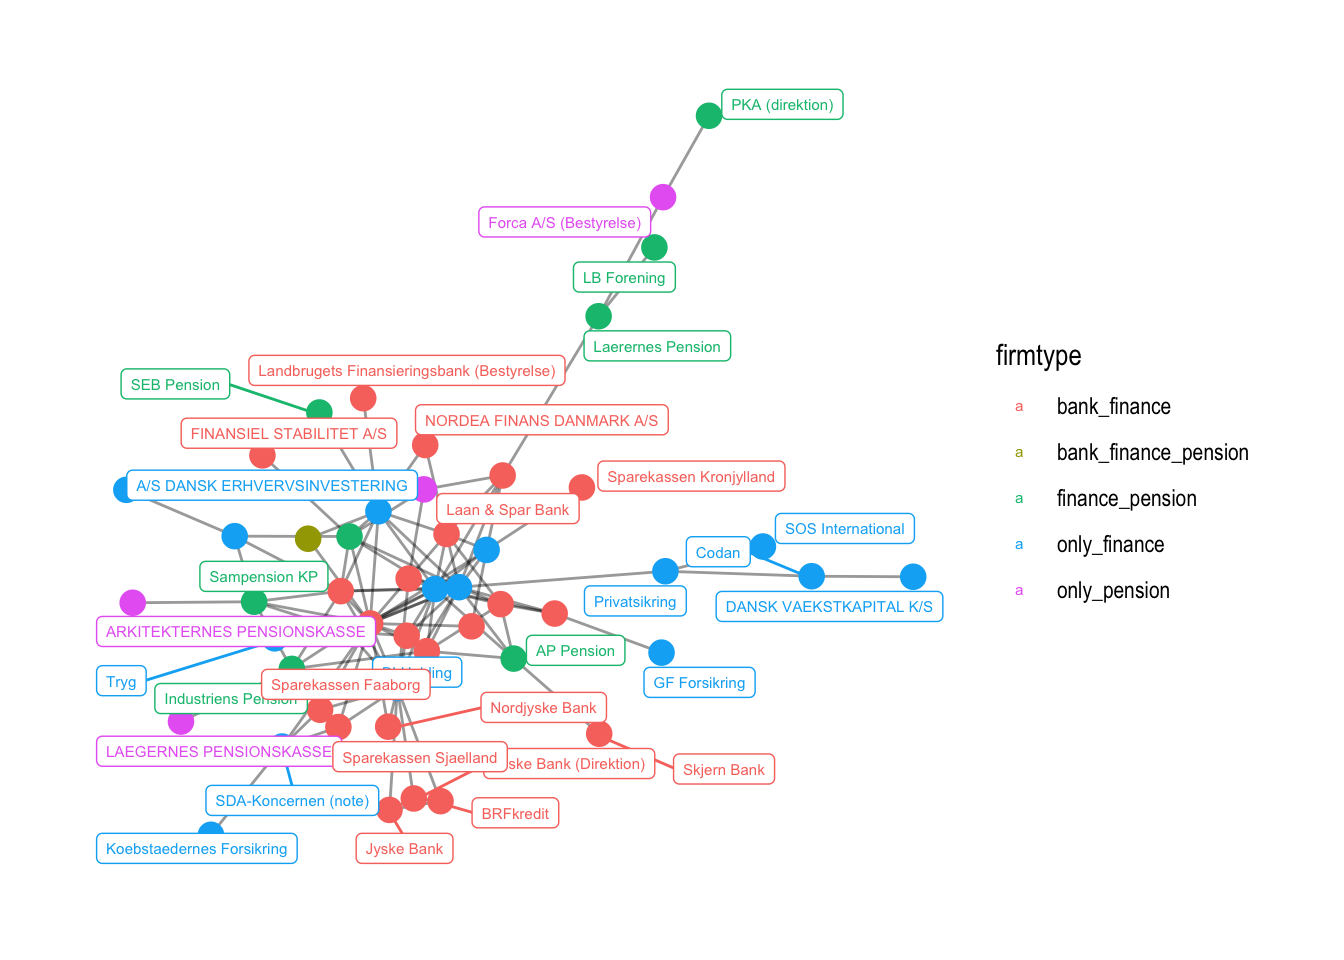
# suppose we want to get a subset of den1 that includes all names and affiliations with the tag "Banks"
bank <- has.tags(den1, "Banks", result = "den")
##       Matched positions
## Banks               354
##
##
# now, we only want the UNIQUE affiliations
bank1 <- has.tags(den1, "Banks", result = "affil")
##       Matched positions
## Banks               354
##
##
# and only UNIQUE names
bank2 <- has.tags(den1, "Banks", result = "name")
##       Matched positions
## Banks               354
##
##
# we can also subset by several tags, first we make a vector
tags <- c("Banks", "Finance", "Pensions")

# this gives us the whole data tibble
finance <- has.tags(den1, tags, result = "den")
##          Matched positions
## Banks                  354
## Finance                881
## Pensions               217
##
##
finance[1:20, ]
## # A tibble: 20 × 17
##    name      affiliation role  tags  position_id     id sector type  description
##    <chr>     <chr>       <chr> <chr>       <dbl>  <dbl> <chr>  <chr> <chr>
##  1 Aage Alm… Middelfart… Memb… Corp…           1  95023 Corpo… <NA>  Automatisk…
##  2 AAke Per… Danske Bank Vice… Corp…         416 132356 Corpo… <NA>  Automatisk…
##  3 Alice Ly… SEB Pension Memb… Corp…         689  97986 Corpo… <NA>  Automatisk…
##  4 Allan Bu… Middelfart… Chai… Corp…         785  95018 Corpo… <NA>  Automatisk…
##  5 Allan Mi… Sygeforsik… Chie… Corp…        1064  99077 Corpo… <NA>  Automatisk…
##  6 Amund Sk… SOS Intern… Chai… Corp…        1274  98467 Corpo… <NA>  Automatisk…
##  7 Anders B… Laerernes … Chai… Corp…        1364  58555 Corpo… Virk… Formand
##  8 Anders B… Laan & Spa… Chai… Corp…        1384  94515 Corpo… <NA>  Automatisk…
##  9 Anders B… Sparekasse… Memb… Corp…        1420  98558 Corpo… <NA>  Automatisk…
## 10 Anders C… ERHVERVSIN… Memb… Corp…        1459  87665 Corpo… <NA>  Automatisk…
## 11 Anders C… BRFkredit   Chai… Bank…        1514 128889 Corpo… <NA>  Automatisk…
## 12 Anders C… Jyske Bank  Exec… Corp…        1518  93008 Corpo… <NA>  Automatisk…
## 13 Anders E… JURISTERNE… Chai… Corp…        1650  92935 Corpo… <NA>  Automatisk…
## 14 Anders H… Tryg        Memb… Corp…        1870 130413 Corpo… <NA>  Automatisk…
## 15 Anders J… Nykredit H… Exec… Bank…        1979  96205 Corpo… Virk… Automatisk…
## 16 Anders K… Vestjysk B… Memb… Corp…        2111 100297 Corpo… <NA>  Automatisk…
## 17 Anders R… MP PENSION… <NA>  Corp…        2416 111468 Corpo… Virk… Cand.scien…
## 18 Anette E… Alm. Brand  Memb… Corp…        3090  82511 Corpo… <NA>  Automatisk…
## 19 Anker Bo… Sampension… Chai… Corp…        3503  58509 Corpo… Virk… (formand) …
## 20 Anne Gle… Sparekasse… Vice… Corp…        4071  98559 Corpo… <NA>  Automatisk…
## # ℹ 8 more variables: created <dttm>, archived <dttm>, last_checked <dttm>,
## #   cvr_person <dbl>, cvr_affiliation <dbl>, person_id <dbl>,
## #   affiliation_id <dbl>, gender <chr>
Some people and affiliations can have several tags. To find people with several tags, we filter the data by the tags we are interested in, and then use the intersect() function.
a1 <- den1 %>% filter(grepl("Farming", tags)) %>% pull(name)

b1 <- den1 %>% filter(grepl("Banks", tags)) %>% pull(name)

c1 <- intersect(a1, b1)
3.2 Downloading data from Orbis
Second, I highlight how you can collect data from Orbis. As a student of CBS, you have free access to Orbis, which is a website that contains information about corporations around the world. Orbis is just one available option to collect data. Feel free to use others as well.
To download data from Orbis, please follow the steps explained in this video. Please note, that Lasse recorded this video in 2020, and some filters have changed since then. This means that while you are able to reproduce the same filter choices, you will get different results.
For this exercise class, I have created a different data set than what you see in the video. Specifically, I have applied the following filters which you can see in the image below.

The data set that you can download here contains information about all public limited Companies in Copenhagen. You can download it by clicking the link below.
If you follow the video above and add columns that include information about the shareholders, their titles, and their unique identification number, you can use the function clean_orbis() which I have created to make your lives a little easier. The function cleans the column names, certain data entries and classes and returns structure that is similar to the den17 data set.
df <- clean_orbis(path = "input/public_companies_cph.xlsx")
## Warning: Expecting numeric in D15191 / R15191C4: got 'n.a.'
## Warning: Expecting numeric in D15192 / R15192C4: got 'n.a.'
## Warning: Expecting numeric in D15193 / R15193C4: got 'n.a.'
## Warning: Expecting numeric in D15194 / R15194C4: got 'n.a.'
## Warning: Expecting numeric in D15195 / R15195C4: got 'n.a.'
## Warning: Expecting numeric in D15196 / R15196C4: got 'n.a.'
## Warning: Expecting numeric in D15197 / R15197C4: got 'n.a.'
## Warning: Expecting numeric in D15198 / R15198C4: got 'n.a.'
## Warning: Expecting numeric in D15199 / R15199C4: got 'n.a.'
## Warning: Expecting numeric in D15200 / R15200C4: got 'n.a.'
## Warning: Expecting numeric in D15201 / R15201C4: got 'n.a.'
## Warning: Expecting numeric in D15202 / R15202C4: got 'n.a.'
## Warning: Expecting numeric in D15203 / R15203C4: got 'n.a.'
## Warning: Expecting numeric in D15204 / R15204C4: got 'n.a.'
## Warning: Expecting numeric in D15205 / R15205C4: got 'n.a.'
## Warning: Expecting numeric in D15206 / R15206C4: got 'n.a.'
## Warning: Expecting numeric in D15207 / R15207C4: got 'n.a.'
## Warning: Expecting numeric in D15208 / R15208C4: got 'n.a.'
## Warning: Expecting numeric in D15209 / R15209C4: got 'n.a.'
## Warning: Expecting numeric in D15210 / R15210C4: got 'n.a.'
## Warning: Expecting numeric in D15211 / R15211C4: got 'n.a.'
## Warning: Expecting numeric in D15212 / R15212C4: got 'n.a.'
## Warning: Expecting numeric in D15213 / R15213C4: got 'n.a.'
## Warning: Expecting numeric in D15214 / R15214C4: got 'n.a.'
## Warning: Expecting numeric in D15215 / R15215C4: got 'n.a.'
## Warning: Expecting numeric in D15216 / R15216C4: got 'n.a.'
## Warning: Expecting numeric in D15217 / R15217C4: got 'n.a.'
## Warning: Expecting numeric in D15218 / R15218C4: got 'n.a.'
## Warning: Expecting numeric in D15219 / R15219C4: got 'n.a.'
## Warning: Expecting numeric in D15220 / R15220C4: got 'n.a.'
## Warning: Expecting numeric in D15221 / R15221C4: got 'n.a.'
## Warning: Expecting numeric in D15222 / R15222C4: got 'n.a.'
## Warning: Expecting numeric in D15223 / R15223C4: got 'n.a.'
## Warning: Expecting numeric in D15224 / R15224C4: got 'n.a.'
## Warning: Expecting numeric in D15225 / R15225C4: got 'n.a.'
## Warning: Expecting numeric in D15226 / R15226C4: got 'n.a.'
## Warning: Expecting numeric in D15227 / R15227C4: got 'n.a.'
## Warning: Expecting numeric in D15228 / R15228C4: got 'n.a.'
## Warning: Expecting numeric in D15229 / R15229C4: got 'n.a.'
## Warning: Expecting numeric in D15230 / R15230C4: got 'n.a.'
## Warning: Expecting numeric in D15231 / R15231C4: got 'n.a.'
## Warning: Expecting numeric in D15232 / R15232C4: got 'n.a.'
## Warning: Expecting numeric in D15233 / R15233C4: got 'n.a.'
## Warning: Expecting numeric in D15234 / R15234C4: got 'n.a.'
## Warning: Expecting numeric in D15235 / R15235C4: got 'n.a.'
## Warning: Expecting numeric in D15236 / R15236C4: got 'n.a.'
## Warning: Expecting numeric in D15237 / R15237C4: got 'n.a.'
## Warning: Expecting numeric in D15238 / R15238C4: got 'n.a.'
## Warning: Expecting numeric in D15239 / R15239C4: got 'n.a.'
## Warning: Expecting numeric in D15240 / R15240C4: got 'n.a.'
## Warning: Expecting numeric in D15241 / R15241C4: got 'n.a.'
## Warning: Expecting numeric in D15242 / R15242C4: got 'n.a.'
## Warning: Expecting numeric in D15243 / R15243C4: got 'n.a.'
## Warning: Expecting numeric in D15244 / R15244C4: got 'n.a.'
## Warning: Expecting numeric in D15245 / R15245C4: got 'n.a.'
## Warning: Expecting numeric in D15246 / R15246C4: got 'n.a.'
## Warning: Expecting numeric in D15247 / R15247C4: got 'n.a.'
## Warning: Expecting numeric in D15248 / R15248C4: got 'n.a.'
## Warning: Expecting numeric in D15249 / R15249C4: got 'n.a.'
## Warning: Expecting numeric in D15250 / R15250C4: got 'n.a.'
## Warning: Expecting numeric in D15251 / R15251C4: got 'n.a.'
## Warning: Expecting numeric in D15252 / R15252C4: got 'n.a.'
## Warning: Expecting numeric in D15253 / R15253C4: got 'n.a.'
## Warning: Expecting numeric in D15254 / R15254C4: got 'n.a.'
## Warning: Expecting numeric in D15255 / R15255C4: got 'n.a.'
## Warning: Expecting numeric in D15256 / R15256C4: got 'n.a.'
## Warning: Expecting numeric in D15257 / R15257C4: got 'n.a.'
## Warning: Expecting numeric in D15258 / R15258C4: got 'n.a.'
## Warning: Expecting numeric in D15259 / R15259C4: got 'n.a.'
## Warning: Expecting numeric in D15260 / R15260C4: got 'n.a.'
## Warning: Expecting numeric in D15261 / R15261C4: got 'n.a.'
## Warning: Expecting numeric in D15262 / R15262C4: got 'n.a.'
## Warning: Expecting numeric in D15263 / R15263C4: got 'n.a.'
## Warning: Expecting numeric in D15264 / R15264C4: got 'n.a.'
## Warning: Expecting numeric in D15265 / R15265C4: got 'n.a.'
## Warning: Expecting numeric in D15266 / R15266C4: got 'n.a.'
## Warning: Expecting numeric in D15267 / R15267C4: got 'n.a.'
## Warning: Expecting numeric in D15268 / R15268C4: got 'n.a.'
## Warning: Expecting numeric in D15269 / R15269C4: got 'n.a.'
## Warning: Expecting numeric in D15270 / R15270C4: got 'n.a.'
## Warning: Expecting numeric in D15271 / R15271C4: got 'n.a.'
## Warning: Expecting numeric in D15272 / R15272C4: got 'n.a.'
## Warning: Expecting numeric in D15273 / R15273C4: got 'n.a.'
## Warning: Expecting numeric in D15274 / R15274C4: got 'n.a.'
## Warning: Expecting numeric in D15275 / R15275C4: got 'n.a.'
## Warning: Expecting numeric in D15276 / R15276C4: got 'n.a.'
## Warning: Expecting numeric in D15277 / R15277C4: got 'n.a.'
## Warning: Expecting numeric in D15278 / R15278C4: got 'n.a.'
## Warning: Expecting numeric in D15279 / R15279C4: got 'n.a.'
## Warning: Expecting numeric in D15280 / R15280C4: got 'n.a.'
## Warning: Expecting numeric in D15281 / R15281C4: got 'n.a.'
## Warning: Expecting numeric in D15282 / R15282C4: got 'n.a.'
## Warning: Expecting numeric in D15283 / R15283C4: got 'n.a.'
## Warning: Expecting numeric in D15284 / R15284C4: got 'n.a.'
## Warning: Expecting numeric in D15285 / R15285C4: got 'n.a.'
## Warning: Expecting numeric in D15286 / R15286C4: got 'n.a.'
## Warning: Expecting numeric in D15287 / R15287C4: got 'n.a.'
## Warning: Expecting numeric in D15288 / R15288C4: got 'n.a.'
## Warning: Expecting numeric in D15289 / R15289C4: got 'n.a.'
## Warning: Expecting numeric in D15290 / R15290C4: got 'n.a.'
## Warning: Expecting numeric in D15291 / R15291C4: got 'n.a.'
## Warning: Expecting numeric in D15292 / R15292C4: got 'n.a.'
## Warning: Expecting numeric in D15293 / R15293C4: got 'n.a.'
## Warning: Expecting numeric in D15294 / R15294C4: got 'n.a.'
## Warning: Expecting numeric in D15295 / R15295C4: got 'n.a.'
## Warning: Expecting numeric in D15296 / R15296C4: got 'n.a.'
## Warning: Expecting numeric in D15297 / R15297C4: got 'n.a.'
## Warning: Expecting numeric in D15298 / R15298C4: got 'n.a.'
## Warning: Expecting numeric in D15299 / R15299C4: got 'n.a.'
## Warning: Expecting numeric in D15300 / R15300C4: got 'n.a.'
## Warning: Expecting numeric in D15301 / R15301C4: got 'n.a.'
## Warning: Expecting numeric in D15302 / R15302C4: got 'n.a.'
## Warning: Expecting numeric in D15303 / R15303C4: got 'n.a.'
## Warning: Expecting numeric in D15304 / R15304C4: got 'n.a.'
## Warning: Expecting numeric in D15305 / R15305C4: got 'n.a.'
## Warning: Expecting numeric in D15306 / R15306C4: got 'n.a.'
## Warning: Expecting numeric in D15307 / R15307C4: got 'n.a.'
## Warning: Expecting numeric in D15308 / R15308C4: got 'n.a.'
## Warning: Expecting numeric in D15309 / R15309C4: got 'n.a.'
## Warning: Expecting numeric in D15310 / R15310C4: got 'n.a.'
## Warning: Expecting numeric in D15311 / R15311C4: got 'n.a.'
## Warning: Expecting numeric in D15312 / R15312C4: got 'n.a.'
## Warning: Expecting numeric in D15313 / R15313C4: got 'n.a.'
## Warning: Expecting numeric in D15314 / R15314C4: got 'n.a.'
## Warning: Expecting numeric in D15315 / R15315C4: got 'n.a.'
## Warning: Expecting numeric in D15316 / R15316C4: got 'n.a.'
## Warning: Expecting numeric in D15317 / R15317C4: got 'n.a.'
## Warning: Expecting numeric in D15318 / R15318C4: got 'n.a.'
## Warning: Expecting numeric in D15319 / R15319C4: got 'n.a.'
## Warning: Expecting numeric in D15320 / R15320C4: got 'n.a.'
## Warning: Expecting numeric in D15321 / R15321C4: got 'n.a.'
## Warning: Expecting numeric in D15322 / R15322C4: got 'n.a.'
## Warning: Expecting numeric in D15323 / R15323C4: got 'n.a.'
## Warning: Expecting numeric in D15324 / R15324C4: got 'n.a.'
## Warning: Expecting numeric in D15325 / R15325C4: got 'n.a.'
## Warning: Expecting numeric in D15326 / R15326C4: got 'n.a.'
## Warning: Expecting numeric in D15327 / R15327C4: got 'n.a.'
## Warning: Expecting numeric in D15328 / R15328C4: got 'n.a.'
## Warning: Expecting numeric in D15329 / R15329C4: got 'n.a.'
## Warning: Expecting numeric in D15330 / R15330C4: got 'n.a.'
## Warning: Expecting numeric in D15331 / R15331C4: got 'n.a.'
## Warning: Expecting numeric in D15332 / R15332C4: got 'n.a.'
## Warning: Expecting numeric in D15333 / R15333C4: got 'n.a.'
## Warning: Expecting numeric in D15334 / R15334C4: got 'n.a.'
## Warning: Expecting numeric in D15335 / R15335C4: got 'n.a.'
## Warning: Expecting numeric in D15336 / R15336C4: got 'n.a.'
## Warning: Expecting numeric in D15337 / R15337C4: got 'n.a.'
## Warning: Expecting numeric in D15338 / R15338C4: got 'n.a.'
## Warning: Expecting numeric in D15339 / R15339C4: got 'n.a.'
## Warning: Expecting numeric in D15340 / R15340C4: got 'n.a.'
## Warning: Expecting numeric in D15341 / R15341C4: got 'n.a.'
## Warning: Expecting numeric in D15342 / R15342C4: got 'n.a.'
## Warning: Expecting numeric in D15343 / R15343C4: got 'n.a.'
## Warning: Expecting numeric in D15344 / R15344C4: got 'n.a.'
## Warning: Expecting numeric in D15345 / R15345C4: got 'n.a.'
## Warning: Expecting numeric in D15346 / R15346C4: got 'n.a.'
## Warning: Expecting numeric in D15347 / R15347C4: got 'n.a.'
## Warning: Expecting numeric in D15348 / R15348C4: got 'n.a.'
## Warning: Expecting numeric in D15349 / R15349C4: got 'n.a.'
## Warning: Expecting numeric in D15350 / R15350C4: got 'n.a.'
## Warning: Expecting numeric in D15351 / R15351C4: got 'n.a.'
## Warning: Expecting numeric in D15352 / R15352C4: got 'n.a.'
## Warning: Expecting numeric in D15353 / R15353C4: got 'n.a.'
## Warning: Expecting numeric in D15354 / R15354C4: got 'n.a.'
## Warning: Expecting numeric in D15355 / R15355C4: got 'n.a.'
## Warning: Expecting numeric in D15356 / R15356C4: got 'n.a.'
## Warning: Expecting numeric in D15357 / R15357C4: got 'n.a.'
## Warning: Expecting numeric in D15358 / R15358C4: got 'n.a.'
## Warning: Expecting numeric in D15359 / R15359C4: got 'n.a.'
## Warning: Expecting numeric in D15360 / R15360C4: got 'n.a.'
## Warning: Expecting numeric in D15361 / R15361C4: got 'n.a.'
## Warning: Expecting numeric in D15362 / R15362C4: got 'n.a.'
## Warning: Expecting numeric in D15363 / R15363C4: got 'n.a.'
## Warning: Expecting numeric in D15364 / R15364C4: got 'n.a.'
## Warning: Expecting numeric in D15365 / R15365C4: got 'n.a.'
## Warning: Expecting numeric in D15366 / R15366C4: got 'n.a.'
## Warning: Expecting numeric in D15367 / R15367C4: got 'n.a.'
## Warning: Expecting numeric in D15368 / R15368C4: got 'n.a.'
## Warning: Expecting numeric in D15369 / R15369C4: got 'n.a.'
## Warning: Expecting numeric in D15370 / R15370C4: got 'n.a.'
## Warning: Expecting numeric in D15371 / R15371C4: got 'n.a.'
## Warning: Expecting numeric in D15372 / R15372C4: got 'n.a.'
## Warning: Expecting numeric in D15373 / R15373C4: got 'n.a.'
## Warning: Expecting numeric in D15374 / R15374C4: got 'n.a.'
## Warning: Expecting numeric in D15375 / R15375C4: got 'n.a.'
## Warning: Expecting numeric in D15376 / R15376C4: got 'n.a.'
## Warning: Expecting numeric in D15377 / R15377C4: got 'n.a.'
## Warning: Expecting numeric in D15378 / R15378C4: got 'n.a.'
## Warning: Expecting numeric in D15379 / R15379C4: got 'n.a.'
## Warning: Expecting numeric in D15380 / R15380C4: got 'n.a.'
## Warning: Expecting numeric in D15381 / R15381C4: got 'n.a.'
## Warning: Expecting numeric in D15382 / R15382C4: got 'n.a.'
## Warning: Expecting numeric in D15383 / R15383C4: got 'n.a.'
## Warning: Expecting numeric in D15384 / R15384C4: got 'n.a.'
## Warning: Expecting numeric in D15385 / R15385C4: got 'n.a.'
## Warning: Expecting numeric in D15386 / R15386C4: got 'n.a.'
## Warning: Expecting numeric in D15387 / R15387C4: got 'n.a.'
## Warning: Expecting numeric in D15388 / R15388C4: got 'n.a.'
## Warning: Expecting numeric in D15389 / R15389C4: got 'n.a.'
## Warning: Expecting numeric in D15390 / R15390C4: got 'n.a.'
## Warning: Expecting numeric in D15391 / R15391C4: got 'n.a.'
## Warning: Expecting numeric in D15392 / R15392C4: got 'n.a.'
## Warning: Expecting numeric in D15393 / R15393C4: got 'n.a.'
## Warning: Expecting numeric in D15394 / R15394C4: got 'n.a.'
## Warning: Expecting numeric in D15395 / R15395C4: got 'n.a.'
## Warning: Expecting numeric in D15396 / R15396C4: got 'n.a.'
## Warning: Expecting numeric in D15397 / R15397C4: got 'n.a.'
## Warning: Expecting numeric in D15398 / R15398C4: got 'n.a.'
## Warning: Expecting numeric in D15399 / R15399C4: got 'n.a.'
## Warning: Expecting numeric in D15400 / R15400C4: got 'n.a.'
## Warning: Expecting numeric in D15401 / R15401C4: got 'n.a.'
## Warning: Expecting numeric in D15402 / R15402C4: got 'n.a.'
## Warning: Expecting numeric in D15403 / R15403C4: got 'n.a.'
## Warning: Expecting numeric in D15404 / R15404C4: got 'n.a.'
## Warning: Expecting numeric in D15405 / R15405C4: got 'n.a.'
## Warning: Expecting numeric in D15406 / R15406C4: got 'n.a.'
## Warning: Expecting numeric in D15407 / R15407C4: got 'n.a.'
## Warning: Expecting numeric in D15408 / R15408C4: got 'n.a.'
## Warning: Expecting numeric in D15409 / R15409C4: got 'n.a.'
## Warning: Expecting numeric in D15410 / R15410C4: got 'n.a.'
## Warning: Expecting numeric in D15411 / R15411C4: got 'n.a.'
## Warning: Expecting numeric in D15412 / R15412C4: got 'n.a.'
## Warning: Expecting numeric in D15413 / R15413C4: got 'n.a.'
## Warning: Expecting numeric in D15414 / R15414C4: got 'n.a.'
## Warning: Expecting numeric in D15415 / R15415C4: got 'n.a.'
## Warning: Expecting numeric in D15416 / R15416C4: got 'n.a.'
## Warning: Expecting numeric in D15417 / R15417C4: got 'n.a.'
## Warning: Expecting numeric in D15418 / R15418C4: got 'n.a.'
## Warning: Expecting numeric in D15419 / R15419C4: got 'n.a.'
## Warning: Expecting numeric in D15420 / R15420C4: got 'n.a.'
## Warning: Expecting numeric in D15421 / R15421C4: got 'n.a.'
## Warning: Expecting numeric in D15422 / R15422C4: got 'n.a.'
## Warning: Expecting numeric in D15423 / R15423C4: got 'n.a.'
## Warning: Expecting numeric in D15424 / R15424C4: got 'n.a.'
## Warning: Expecting numeric in D15425 / R15425C4: got 'n.a.'
## Warning: Expecting numeric in D15426 / R15426C4: got 'n.a.'
## Warning: Expecting numeric in D15427 / R15427C4: got 'n.a.'
## Warning: Expecting numeric in D15428 / R15428C4: got 'n.a.'
## Warning: Expecting numeric in D15429 / R15429C4: got 'n.a.'
## Warning: Expecting numeric in D15430 / R15430C4: got 'n.a.'
## Warning: Expecting numeric in D15431 / R15431C4: got 'n.a.'
## Warning: Expecting numeric in D15432 / R15432C4: got 'n.a.'
## Warning: Expecting numeric in D15433 / R15433C4: got 'n.a.'
## Warning: Expecting numeric in D15434 / R15434C4: got 'n.a.'
## Warning: Expecting numeric in D15435 / R15435C4: got 'n.a.'
## Warning: Expecting numeric in D15436 / R15436C4: got 'n.a.'
## Warning: Expecting numeric in D15437 / R15437C4: got 'n.a.'
## Warning: Expecting numeric in D15438 / R15438C4: got 'n.a.'
## Warning: Expecting numeric in D15439 / R15439C4: got 'n.a.'
## Warning: Expecting numeric in D15440 / R15440C4: got 'n.a.'
## Warning: Expecting numeric in D15441 / R15441C4: got 'n.a.'
## Warning: Expecting numeric in D15442 / R15442C4: got 'n.a.'
## Warning: Expecting numeric in D15443 / R15443C4: got 'n.a.'
## Warning: Expecting numeric in D15444 / R15444C4: got 'n.a.'
## Warning: Expecting numeric in D15445 / R15445C4: got 'n.a.'
## Warning: Expecting numeric in D15446 / R15446C4: got 'n.a.'
## Warning: Expecting numeric in D15447 / R15447C4: got 'n.a.'
## Warning: Expecting numeric in D15448 / R15448C4: got 'n.a.'
## Warning: Expecting numeric in D15449 / R15449C4: got 'n.a.'
## Warning: Expecting numeric in D15450 / R15450C4: got 'n.a.'
## Warning: Expecting numeric in D15451 / R15451C4: got 'n.a.'
## Warning: Expecting numeric in D15452 / R15452C4: got 'n.a.'
## Warning: Expecting numeric in D15453 / R15453C4: got 'n.a.'
## Warning: Expecting numeric in D15454 / R15454C4: got 'n.a.'
## Warning: Expecting numeric in D15455 / R15455C4: got 'n.a.'
## Warning: Expecting numeric in D15456 / R15456C4: got 'n.a.'
## Warning: Expecting numeric in D15457 / R15457C4: got 'n.a.'
## Warning: Expecting numeric in D15458 / R15458C4: got 'n.a.'
## Warning: Expecting numeric in D15459 / R15459C4: got 'n.a.'
## Warning: Expecting numeric in D15460 / R15460C4: got 'n.a.'
## Warning: Expecting numeric in D15461 / R15461C4: got 'n.a.'
## Warning: Expecting numeric in D15462 / R15462C4: got 'n.a.'
## Warning: Expecting numeric in D15463 / R15463C4: got 'n.a.'
## Warning: Expecting numeric in D15464 / R15464C4: got 'n.a.'
## Warning: Expecting numeric in D15465 / R15465C4: got 'n.a.'
## Warning: Expecting numeric in D15466 / R15466C4: got 'n.a.'
## Warning: Expecting numeric in D15467 / R15467C4: got 'n.a.'
## Warning: Expecting numeric in D15468 / R15468C4: got 'n.a.'
## Warning: Expecting numeric in D15469 / R15469C4: got 'n.a.'
## Warning: Expecting numeric in D15470 / R15470C4: got 'n.a.'
## Warning: Expecting numeric in D15471 / R15471C4: got 'n.a.'
## Warning: Expecting numeric in D15472 / R15472C4: got 'n.a.'
## Warning: Expecting numeric in D15473 / R15473C4: got 'n.a.'
## Warning: Expecting numeric in D15474 / R15474C4: got 'n.a.'
## Warning: Expecting numeric in D15475 / R15475C4: got 'n.a.'
## Warning: Expecting numeric in D15476 / R15476C4: got 'n.a.'
## Warning: Expecting numeric in D15477 / R15477C4: got 'n.a.'
## Warning: Expecting numeric in D15478 / R15478C4: got 'n.a.'
## Warning: Expecting numeric in D15479 / R15479C4: got 'n.a.'
## Warning: Expecting numeric in D15480 / R15480C4: got 'n.a.'
## Warning: Expecting numeric in D15481 / R15481C4: got 'n.a.'
## Warning: Expecting numeric in D15482 / R15482C4: got 'n.a.'
## Warning: Expecting numeric in D15483 / R15483C4: got 'n.a.'
## Warning: Expecting numeric in D15484 / R15484C4: got 'n.a.'
## Warning: Expecting numeric in D15485 / R15485C4: got 'n.a.'
## Warning: Expecting numeric in D15486 / R15486C4: got 'n.a.'
## Warning: Expecting numeric in D15487 / R15487C4: got 'n.a.'
## Warning: Expecting numeric in D15488 / R15488C4: got 'n.a.'
## Warning: Expecting numeric in D15489 / R15489C4: got 'n.a.'
## Warning: Expecting numeric in D15490 / R15490C4: got 'n.a.'
## Warning: Expecting numeric in D15491 / R15491C4: got 'n.a.'
## Warning: Expecting numeric in D15492 / R15492C4: got 'n.a.'
## Warning: Expecting numeric in D15493 / R15493C4: got 'n.a.'
## Warning: Expecting numeric in D15494 / R15494C4: got 'n.a.'
## Warning: Expecting numeric in D15495 / R15495C4: got 'n.a.'
## Warning: Expecting numeric in D15496 / R15496C4: got 'n.a.'
## Warning: Expecting numeric in D15497 / R15497C4: got 'n.a.'
## Warning: Expecting numeric in D15498 / R15498C4: got 'n.a.'
## Warning: Expecting numeric in D15499 / R15499C4: got 'n.a.'
## Warning: Expecting numeric in D15500 / R15500C4: got 'n.a.'
## Warning: Expecting numeric in D15501 / R15501C4: got 'n.a.'
## Warning: Expecting numeric in D15502 / R15502C4: got 'n.a.'
## Warning: Expecting numeric in D15503 / R15503C4: got 'n.a.'
## Warning: Expecting numeric in D15504 / R15504C4: got 'n.a.'
## Warning: Expecting numeric in D15505 / R15505C4: got 'n.a.'
## Warning: Expecting numeric in D15506 / R15506C4: got 'n.a.'
## Warning: Expecting numeric in D15507 / R15507C4: got 'n.a.'
## Warning: Expecting numeric in D15508 / R15508C4: got 'n.a.'
## Warning: Expecting numeric in D15509 / R15509C4: got 'n.a.'
## Warning: Expecting numeric in D15510 / R15510C4: got 'n.a.'
## Warning: Expecting numeric in D15511 / R15511C4: got 'n.a.'
## Warning: Expecting numeric in D15512 / R15512C4: got 'n.a.'
## Warning: Expecting numeric in D15513 / R15513C4: got 'n.a.'
## Warning: Expecting numeric in D15514 / R15514C4: got 'n.a.'
## Warning: Expecting numeric in D15515 / R15515C4: got 'n.a.'
## Warning: Expecting numeric in D15516 / R15516C4: got 'n.a.'
## Warning: Expecting numeric in D15517 / R15517C4: got 'n.a.'
## Warning: Expecting numeric in D15518 / R15518C4: got 'n.a.'
## Warning: Expecting numeric in D15519 / R15519C4: got 'n.a.'
## Warning: Expecting numeric in D15520 / R15520C4: got 'n.a.'
## Warning: Expecting numeric in D15521 / R15521C4: got 'n.a.'
## Warning: Expecting numeric in D15522 / R15522C4: got 'n.a.'
## Warning: Expecting numeric in D15523 / R15523C4: got 'n.a.'
## Warning: Expecting numeric in D15524 / R15524C4: got 'n.a.'
## Warning: Expecting numeric in D15525 / R15525C4: got 'n.a.'
## Warning: Expecting numeric in D15526 / R15526C4: got 'n.a.'
## Warning: Expecting numeric in D15527 / R15527C4: got 'n.a.'
## Warning: Expecting numeric in D15528 / R15528C4: got 'n.a.'
## Warning: Expecting numeric in D15529 / R15529C4: got 'n.a.'
## Warning: Expecting numeric in D15530 / R15530C4: got 'n.a.'
## Warning: Expecting numeric in D15531 / R15531C4: got 'n.a.'
## Warning: Expecting numeric in D15532 / R15532C4: got 'n.a.'
## Warning: Expecting numeric in D15533 / R15533C4: got 'n.a.'
## Warning: Expecting numeric in D15534 / R15534C4: got 'n.a.'
## Warning: Expecting numeric in D15535 / R15535C4: got 'n.a.'
## Warning: Expecting numeric in D15536 / R15536C4: got 'n.a.'
## Warning: Expecting numeric in D15537 / R15537C4: got 'n.a.'
## Warning: Expecting numeric in D15538 / R15538C4: got 'n.a.'
## Warning: Expecting numeric in D15539 / R15539C4: got 'n.a.'
## Warning: Expecting numeric in D15540 / R15540C4: got 'n.a.'
## Warning: Expecting numeric in D15541 / R15541C4: got 'n.a.'
## Warning: Expecting numeric in D15542 / R15542C4: got 'n.a.'
## Warning: Expecting numeric in D15543 / R15543C4: got 'n.a.'
## Warning: Expecting numeric in D15544 / R15544C4: got 'n.a.'
## Warning: Expecting numeric in D15545 / R15545C4: got 'n.a.'
## Warning: Expecting numeric in D15546 / R15546C4: got 'n.a.'
## Warning: Expecting numeric in D15547 / R15547C4: got 'n.a.'
## Warning: Expecting numeric in D15548 / R15548C4: got 'n.a.'
## Warning: Expecting numeric in D15549 / R15549C4: got 'n.a.'
## Warning: Expecting numeric in D15550 / R15550C4: got 'n.a.'
## Warning: Expecting numeric in D15551 / R15551C4: got 'n.a.'
## Warning: Expecting numeric in D15552 / R15552C4: got 'n.a.'
## Warning: Expecting numeric in D15553 / R15553C4: got 'n.a.'
## Warning: Expecting numeric in D15554 / R15554C4: got 'n.a.'
## Warning: Expecting numeric in D15555 / R15555C4: got 'n.a.'
## Warning: Expecting numeric in D15556 / R15556C4: got 'n.a.'
## Warning: Expecting numeric in D15557 / R15557C4: got 'n.a.'
## Warning: Expecting numeric in D15558 / R15558C4: got 'n.a.'
## Warning: Expecting numeric in D15559 / R15559C4: got 'n.a.'
## Warning: Expecting numeric in D15560 / R15560C4: got 'n.a.'
## Warning: Expecting numeric in D15561 / R15561C4: got 'n.a.'
## Warning: Expecting numeric in D15562 / R15562C4: got 'n.a.'
## Warning: Expecting numeric in D15563 / R15563C4: got 'n.a.'
## Warning: Expecting numeric in D15564 / R15564C4: got 'n.a.'
## Warning: Expecting numeric in D15565 / R15565C4: got 'n.a.'
## Warning: Expecting numeric in D15566 / R15566C4: got 'n.a.'
## Warning: Expecting numeric in D15567 / R15567C4: got 'n.a.'
## Warning: Expecting numeric in D15568 / R15568C4: got 'n.a.'
## Warning: Expecting numeric in D15569 / R15569C4: got 'n.a.'
## Warning: Expecting numeric in D15570 / R15570C4: got 'n.a.'
## Warning: Expecting numeric in D15571 / R15571C4: got 'n.a.'
## Warning: Expecting numeric in D15572 / R15572C4: got 'n.a.'
## Warning: Expecting numeric in D15573 / R15573C4: got 'n.a.'
## Warning: Expecting numeric in D15574 / R15574C4: got 'n.a.'
## Warning: Expecting numeric in D15575 / R15575C4: got 'n.a.'
## Warning: Expecting numeric in D15576 / R15576C4: got 'n.a.'
## Warning: Expecting numeric in D15577 / R15577C4: got 'n.a.'
## Warning: Expecting numeric in D15578 / R15578C4: got 'n.a.'
## Warning: Expecting numeric in D15579 / R15579C4: got 'n.a.'
## Warning: Expecting numeric in D15580 / R15580C4: got 'n.a.'
## Warning: Expecting numeric in D15581 / R15581C4: got 'n.a.'
## Warning: Expecting numeric in D15582 / R15582C4: got 'n.a.'
## Warning: Expecting numeric in D15583 / R15583C4: got 'n.a.'
## Warning: Expecting numeric in D15584 / R15584C4: got 'n.a.'
## Warning: Expecting numeric in D15585 / R15585C4: got 'n.a.'
## Warning: Expecting numeric in D15586 / R15586C4: got 'n.a.'
## Warning: Expecting numeric in D15587 / R15587C4: got 'n.a.'
## Warning: Expecting numeric in D15588 / R15588C4: got 'n.a.'
## Warning: Expecting numeric in D15589 / R15589C4: got 'n.a.'
## Warning: Expecting numeric in D15590 / R15590C4: got 'n.a.'
## Warning: Expecting numeric in D15591 / R15591C4: got 'n.a.'
## Warning: Expecting numeric in D15592 / R15592C4: got 'n.a.'
## Warning: Expecting numeric in D15593 / R15593C4: got 'n.a.'
## Warning: Expecting numeric in D15594 / R15594C4: got 'n.a.'
## Warning: Expecting numeric in D15595 / R15595C4: got 'n.a.'
## Warning: Expecting numeric in D15596 / R15596C4: got 'n.a.'
## Warning: Expecting numeric in D15597 / R15597C4: got 'n.a.'
## Warning: Expecting numeric in D15598 / R15598C4: got 'n.a.'
## Warning: Expecting numeric in D15599 / R15599C4: got 'n.a.'
## Warning: Expecting numeric in D15600 / R15600C4: got 'n.a.'
## Warning: Expecting numeric in D15601 / R15601C4: got 'n.a.'
## Warning: Expecting numeric in D15602 / R15602C4: got 'n.a.'
## Warning: Expecting numeric in D15603 / R15603C4: got 'n.a.'
## Warning: Expecting numeric in D15604 / R15604C4: got 'n.a.'
## Warning: Expecting numeric in D15605 / R15605C4: got 'n.a.'
## Warning: Expecting numeric in D15606 / R15606C4: got 'n.a.'
## Warning: Expecting numeric in D15607 / R15607C4: got 'n.a.'
## Warning: Expecting numeric in D15608 / R15608C4: got 'n.a.'
## Warning: Expecting numeric in D15609 / R15609C4: got 'n.a.'
## Warning: Expecting numeric in D15610 / R15610C4: got 'n.a.'
## Warning: Expecting numeric in D15611 / R15611C4: got 'n.a.'
## Warning: Expecting numeric in D15612 / R15612C4: got 'n.a.'
## Warning: Expecting numeric in D15613 / R15613C4: got 'n.a.'
## Warning: Expecting numeric in D15614 / R15614C4: got 'n.a.'
## Warning: Expecting numeric in D15615 / R15615C4: got 'n.a.'
## Warning: Expecting numeric in D15616 / R15616C4: got 'n.a.'
## Warning: Expecting numeric in D15617 / R15617C4: got 'n.a.'
## Warning: Expecting numeric in D15618 / R15618C4: got 'n.a.'
## Warning: Expecting numeric in D15619 / R15619C4: got 'n.a.'
## Warning: Expecting numeric in D15620 / R15620C4: got 'n.a.'
## Warning: Expecting numeric in D15621 / R15621C4: got 'n.a.'
## Warning: Expecting numeric in D15622 / R15622C4: got 'n.a.'
## Warning: Expecting numeric in D15623 / R15623C4: got 'n.a.'
## Warning: Expecting numeric in D15624 / R15624C4: got 'n.a.'
## Warning: Expecting numeric in D15625 / R15625C4: got 'n.a.'
## Warning: Expecting numeric in D15626 / R15626C4: got 'n.a.'
## Warning: Expecting numeric in D15627 / R15627C4: got 'n.a.'
## Warning: Expecting numeric in D15628 / R15628C4: got 'n.a.'
## Warning: Expecting numeric in D15629 / R15629C4: got 'n.a.'
## Warning: Expecting numeric in D15630 / R15630C4: got 'n.a.'
## Warning: Expecting numeric in D15631 / R15631C4: got 'n.a.'
## Warning: Expecting numeric in D15632 / R15632C4: got 'n.a.'
## Warning: Expecting numeric in D15633 / R15633C4: got 'n.a.'
## Warning: Expecting numeric in D15634 / R15634C4: got 'n.a.'
## Warning: Expecting numeric in D15635 / R15635C4: got 'n.a.'
## Warning: Expecting numeric in D15636 / R15636C4: got 'n.a.'
## Warning: Expecting numeric in D15637 / R15637C4: got 'n.a.'
## Warning: Expecting numeric in D15638 / R15638C4: got 'n.a.'
## Warning: Expecting numeric in D15639 / R15639C4: got 'n.a.'
## Warning: Expecting numeric in D15640 / R15640C4: got 'n.a.'
## Warning: Expecting numeric in D15641 / R15641C4: got 'n.a.'
## Warning: Expecting numeric in D15642 / R15642C4: got 'n.a.'
## Warning: Expecting numeric in D15643 / R15643C4: got 'n.a.'
## Warning: Expecting numeric in D15644 / R15644C4: got 'n.a.'
## Warning: Expecting numeric in D15645 / R15645C4: got 'n.a.'
## Warning: Expecting numeric in D15646 / R15646C4: got 'n.a.'
## Warning: Expecting numeric in D15647 / R15647C4: got 'n.a.'
## Warning: Expecting numeric in D15648 / R15648C4: got 'n.a.'
## Warning: Expecting numeric in D15649 / R15649C4: got 'n.a.'
## Warning: Expecting numeric in D15650 / R15650C4: got 'n.a.'
## Warning: Expecting numeric in D15651 / R15651C4: got 'n.a.'
## Warning: Expecting numeric in D15652 / R15652C4: got 'n.a.'
## Warning: Expecting numeric in D15653 / R15653C4: got 'n.a.'
## Warning: Expecting numeric in D15654 / R15654C4: got 'n.a.'
## Warning: Expecting numeric in D15655 / R15655C4: got 'n.a.'
## Warning: Expecting numeric in D15656 / R15656C4: got 'n.a.'
## Warning: Expecting numeric in D15657 / R15657C4: got 'n.a.'
## Warning: Expecting numeric in D15658 / R15658C4: got 'n.a.'
## Warning: Expecting numeric in D15659 / R15659C4: got 'n.a.'
## Warning: Expecting numeric in D15660 / R15660C4: got 'n.a.'
## Warning: Expecting numeric in D15661 / R15661C4: got 'n.a.'
## Warning: Expecting numeric in D15662 / R15662C4: got 'n.a.'
## Warning: Expecting numeric in D15663 / R15663C4: got 'n.a.'
## Warning: Expecting numeric in D15664 / R15664C4: got 'n.a.'
## Warning: Expecting numeric in D15665 / R15665C4: got 'n.a.'
## Warning: Expecting numeric in D15666 / R15666C4: got 'n.a.'
## Warning: Expecting numeric in D15667 / R15667C4: got 'n.a.'
## Warning: Expecting numeric in D15668 / R15668C4: got 'n.a.'
## Warning: Expecting numeric in D15669 / R15669C4: got 'n.a.'
## Warning: Expecting numeric in D15670 / R15670C4: got 'n.a.'
## Warning: Expecting numeric in D15671 / R15671C4: got 'n.a.'
## Warning: Expecting numeric in D15672 / R15672C4: got 'n.a.'
## Warning: Expecting numeric in D15673 / R15673C4: got 'n.a.'
## Warning: Expecting numeric in D15674 / R15674C4: got 'n.a.'
## Warning: Expecting numeric in D15675 / R15675C4: got 'n.a.'
## Warning: Expecting numeric in D15676 / R15676C4: got 'n.a.'
## Warning: Expecting numeric in D15677 / R15677C4: got 'n.a.'
## Warning: Expecting numeric in D15678 / R15678C4: got 'n.a.'
## Warning: Expecting numeric in D15679 / R15679C4: got 'n.a.'
## Warning: Expecting numeric in D15680 / R15680C4: got 'n.a.'
## Warning: Expecting numeric in D15681 / R15681C4: got 'n.a.'
## Warning: Expecting numeric in D15682 / R15682C4: got 'n.a.'
## Warning: Expecting numeric in D15683 / R15683C4: got 'n.a.'
## Warning: Expecting numeric in D15684 / R15684C4: got 'n.a.'
## Warning: Expecting numeric in D15685 / R15685C4: got 'n.a.'
## Warning: Expecting numeric in D15686 / R15686C4: got 'n.a.'
## Warning: Expecting numeric in D15687 / R15687C4: got 'n.a.'
## Warning: Expecting numeric in D15688 / R15688C4: got 'n.a.'
## Warning: Expecting numeric in D15689 / R15689C4: got 'n.a.'
## Warning: Expecting numeric in D15690 / R15690C4: got 'n.a.'
## Warning: Expecting numeric in D15691 / R15691C4: got 'n.a.'
## Warning: Expecting numeric in D15692 / R15692C4: got 'n.a.'
## Warning: Expecting numeric in D15693 / R15693C4: got 'n.a.'
## Warning: Expecting numeric in D15694 / R15694C4: got 'n.a.'
## Warning: Expecting numeric in D15695 / R15695C4: got 'n.a.'
## Warning: Expecting numeric in D15696 / R15696C4: got 'n.a.'
## Warning: Expecting numeric in D15697 / R15697C4: got 'n.a.'
## Warning: Expecting numeric in D15698 / R15698C4: got 'n.a.'
## Warning: Expecting numeric in D15699 / R15699C4: got 'n.a.'
## Warning: Expecting numeric in D15700 / R15700C4: got 'n.a.'
## Warning: Expecting numeric in D15701 / R15701C4: got 'n.a.'
## Warning: Expecting numeric in D15702 / R15702C4: got 'n.a.'
## Warning: Expecting numeric in D15703 / R15703C4: got 'n.a.'
## Warning: Expecting numeric in D15704 / R15704C4: got 'n.a.'
## Warning: Expecting numeric in D15705 / R15705C4: got 'n.a.'
## Warning: Expecting numeric in D15706 / R15706C4: got 'n.a.'
## Warning: Expecting numeric in D15707 / R15707C4: got 'n.a.'
## Warning: Expecting numeric in D15708 / R15708C4: got 'n.a.'
## Warning: Expecting numeric in D15709 / R15709C4: got 'n.a.'
## Warning: Expecting numeric in D15710 / R15710C4: got 'n.a.'
## Warning: Expecting numeric in D15711 / R15711C4: got 'n.a.'
## Warning: Expecting numeric in D15712 / R15712C4: got 'n.a.'
## Warning: Expecting numeric in D15713 / R15713C4: got 'n.a.'
## Warning: Expecting numeric in D15714 / R15714C4: got 'n.a.'
## Warning: Expecting numeric in D15715 / R15715C4: got 'n.a.'
## Warning: Expecting numeric in D15716 / R15716C4: got 'n.a.'
## Warning: Expecting numeric in D15717 / R15717C4: got 'n.a.'
## Warning: Expecting numeric in D15718 / R15718C4: got 'n.a.'
## Warning: Expecting numeric in D15719 / R15719C4: got 'n.a.'
## Warning: Expecting numeric in D15720 / R15720C4: got 'n.a.'
## Warning: Expecting numeric in D15721 / R15721C4: got 'n.a.'
## Warning: Expecting numeric in D15722 / R15722C4: got 'n.a.'
## Warning: Expecting numeric in D15723 / R15723C4: got 'n.a.'
## Warning: Expecting numeric in D15724 / R15724C4: got 'n.a.'
## Warning: Expecting numeric in D15725 / R15725C4: got 'n.a.'
## Warning: Expecting numeric in D15726 / R15726C4: got 'n.a.'
## Warning: Expecting numeric in D15727 / R15727C4: got 'n.a.'
## Warning: Expecting numeric in D15728 / R15728C4: got 'n.a.'
## Warning: Expecting numeric in D15729 / R15729C4: got 'n.a.'
## Warning: Expecting numeric in D15730 / R15730C4: got 'n.a.'
## Warning: Expecting numeric in D15731 / R15731C4: got 'n.a.'
## Warning: Expecting numeric in D15732 / R15732C4: got 'n.a.'
## Warning: Expecting numeric in D15733 / R15733C4: got 'n.a.'
## Warning: Expecting numeric in D15734 / R15734C4: got 'n.a.'
## Warning: Expecting numeric in D15735 / R15735C4: got 'n.a.'
## Warning: Expecting numeric in D15736 / R15736C4: got 'n.a.'
## Warning: Expecting numeric in D15737 / R15737C4: got 'n.a.'
## Warning: Expecting numeric in D15738 / R15738C4: got 'n.a.'
## Warning: Expecting numeric in D15739 / R15739C4: got 'n.a.'
## Warning: Expecting numeric in D15740 / R15740C4: got 'n.a.'
## Warning: Expecting numeric in D15741 / R15741C4: got 'n.a.'
## Warning: Expecting numeric in D15742 / R15742C4: got 'n.a.'
## Warning: Expecting numeric in D15743 / R15743C4: got 'n.a.'
## Warning: Expecting numeric in D15744 / R15744C4: got 'n.a.'
## Warning: Expecting numeric in D15745 / R15745C4: got 'n.a.'
## Warning: Expecting numeric in D15746 / R15746C4: got 'n.a.'
## Warning: Expecting numeric in D15747 / R15747C4: got 'n.a.'
## Warning: Expecting numeric in D15748 / R15748C4: got 'n.a.'
## Warning: Expecting numeric in D15749 / R15749C4: got 'n.a.'
## Warning: Expecting numeric in D15750 / R15750C4: got 'n.a.'
## Warning: Expecting numeric in D15751 / R15751C4: got 'n.a.'
## Warning: Expecting numeric in D15752 / R15752C4: got 'n.a.'
## Warning: Expecting numeric in D15753 / R15753C4: got 'n.a.'
## Warning: Expecting numeric in D15754 / R15754C4: got 'n.a.'
## Warning: Expecting numeric in D15755 / R15755C4: got 'n.a.'
## Warning: Expecting numeric in D15756 / R15756C4: got 'n.a.'
## Warning: Expecting numeric in D15757 / R15757C4: got 'n.a.'
## Warning: Expecting numeric in D15758 / R15758C4: got 'n.a.'
## Warning: Expecting numeric in D15759 / R15759C4: got 'n.a.'
## Warning: Expecting numeric in D15760 / R15760C4: got 'n.a.'
## Warning: Expecting numeric in D15761 / R15761C4: got 'n.a.'
## Warning: Expecting numeric in D15762 / R15762C4: got 'n.a.'
## Warning: Expecting numeric in D15763 / R15763C4: got 'n.a.'
## Warning: Expecting numeric in D15764 / R15764C4: got 'n.a.'
## Warning: Expecting numeric in D15765 / R15765C4: got 'n.a.'
## Warning: Expecting numeric in D15766 / R15766C4: got 'n.a.'
## Warning: Expecting numeric in D15767 / R15767C4: got 'n.a.'
## Warning: Expecting numeric in D15768 / R15768C4: got 'n.a.'
## Warning: Expecting numeric in D15769 / R15769C4: got 'n.a.'
## Warning: Expecting numeric in D15770 / R15770C4: got 'n.a.'
## Warning: Expecting numeric in D15771 / R15771C4: got 'n.a.'
## Warning: Expecting numeric in D15772 / R15772C4: got 'n.a.'
## Warning: Expecting numeric in D15773 / R15773C4: got 'n.a.'
## Warning: Expecting numeric in D15774 / R15774C4: got 'n.a.'
## Warning: Expecting numeric in D15775 / R15775C4: got 'n.a.'
## Warning: Expecting numeric in D15776 / R15776C4: got 'n.a.'
## Warning: Expecting numeric in D15777 / R15777C4: got 'n.a.'
## Warning: Expecting numeric in D15778 / R15778C4: got 'n.a.'
## Warning: Expecting numeric in D15779 / R15779C4: got 'n.a.'
## Warning: Expecting numeric in D15780 / R15780C4: got 'n.a.'
## Warning: Expecting numeric in D15781 / R15781C4: got 'n.a.'
## Warning: Expecting numeric in D15782 / R15782C4: got 'n.a.'
## Warning: Expecting numeric in D15783 / R15783C4: got 'n.a.'
## Warning: Expecting numeric in D15784 / R15784C4: got 'n.a.'
## Warning: Expecting numeric in D15785 / R15785C4: got 'n.a.'
## Warning: Expecting numeric in D15786 / R15786C4: got 'n.a.'
## Warning: Expecting numeric in D15787 / R15787C4: got 'n.a.'
## Warning: Expecting numeric in D15788 / R15788C4: got 'n.a.'
## Warning: Expecting numeric in D15789 / R15789C4: got 'n.a.'
## Warning: Expecting numeric in D15790 / R15790C4: got 'n.a.'
## Warning: Expecting numeric in D15791 / R15791C4: got 'n.a.'
## Warning: Expecting numeric in D15792 / R15792C4: got 'n.a.'
## Warning: Expecting numeric in D15793 / R15793C4: got 'n.a.'
## Warning: Expecting numeric in D15794 / R15794C4: got 'n.a.'
## Warning: Expecting numeric in D15795 / R15795C4: got 'n.a.'
## Warning: Expecting numeric in D15796 / R15796C4: got 'n.a.'
## Warning: Expecting numeric in D15797 / R15797C4: got 'n.a.'
## Warning: Expecting numeric in D15798 / R15798C4: got 'n.a.'
## Warning: Expecting numeric in D15799 / R15799C4: got 'n.a.'
## Warning: Expecting numeric in D15800 / R15800C4: got 'n.a.'
## Warning: Expecting numeric in D15801 / R15801C4: got 'n.a.'
## Warning: Expecting numeric in D15802 / R15802C4: got 'n.a.'
## Warning: Expecting numeric in D15803 / R15803C4: got 'n.a.'
## Warning: Expecting numeric in D15804 / R15804C4: got 'n.a.'
## Warning: Expecting numeric in D15805 / R15805C4: got 'n.a.'
## Warning: Expecting numeric in D15806 / R15806C4: got 'n.a.'
## Warning: Expecting numeric in D15807 / R15807C4: got 'n.a.'
## Warning: Expecting numeric in D15808 / R15808C4: got 'n.a.'
## Warning: Expecting numeric in D15809 / R15809C4: got 'n.a.'
## Warning: Expecting numeric in D15810 / R15810C4: got 'n.a.'
## Warning: Expecting numeric in D15811 / R15811C4: got 'n.a.'
## Warning: Expecting numeric in D15812 / R15812C4: got 'n.a.'
## Warning: Expecting numeric in D15813 / R15813C4: got 'n.a.'
## Warning: Expecting numeric in D15814 / R15814C4: got 'n.a.'
## Warning: Expecting numeric in D15815 / R15815C4: got 'n.a.'
## Warning: Expecting numeric in D15816 / R15816C4: got 'n.a.'
## Warning: Expecting numeric in D15817 / R15817C4: got 'n.a.'
## Warning: Expecting numeric in D15818 / R15818C4: got 'n.a.'
## Warning: Expecting numeric in D15819 / R15819C4: got 'n.a.'
## Warning: Expecting numeric in D15820 / R15820C4: got 'n.a.'
## Warning: Expecting numeric in D15821 / R15821C4: got 'n.a.'
## Warning: Expecting numeric in D15822 / R15822C4: got 'n.a.'
## Warning: Expecting numeric in D15823 / R15823C4: got 'n.a.'
## Warning: Expecting numeric in D15824 / R15824C4: got 'n.a.'
## Warning: Expecting numeric in D15825 / R15825C4: got 'n.a.'
## Warning: Expecting numeric in D15826 / R15826C4: got 'n.a.'
## Warning: Expecting numeric in D15827 / R15827C4: got 'n.a.'
## Warning: Expecting numeric in D15828 / R15828C4: got 'n.a.'
## Warning: Expecting numeric in D15829 / R15829C4: got 'n.a.'
## Warning: Expecting numeric in D15830 / R15830C4: got 'n.a.'
## Warning: Expecting numeric in D15831 / R15831C4: got 'n.a.'
## Warning: Expecting numeric in D15832 / R15832C4: got 'n.a.'
## Warning: Expecting numeric in D15833 / R15833C4: got 'n.a.'
## Warning: Expecting numeric in D15834 / R15834C4: got 'n.a.'
## Warning: Expecting numeric in D15835 / R15835C4: got 'n.a.'
## Warning: Expecting numeric in D15836 / R15836C4: got 'n.a.'
## Warning: Expecting numeric in D15837 / R15837C4: got 'n.a.'
## Warning: Expecting numeric in D15838 / R15838C4: got 'n.a.'
## Warning: Expecting numeric in D15839 / R15839C4: got 'n.a.'
## Warning: Expecting numeric in D15840 / R15840C4: got 'n.a.'
## Warning: Expecting numeric in D15841 / R15841C4: got 'n.a.'
## Warning: Expecting numeric in D15842 / R15842C4: got 'n.a.'
## Warning: Expecting numeric in D15843 / R15843C4: got 'n.a.'
## Warning: Expecting numeric in D15844 / R15844C4: got 'n.a.'
## Warning: Expecting numeric in D15845 / R15845C4: got 'n.a.'
## Warning: Expecting numeric in D15846 / R15846C4: got 'n.a.'
## Warning: Expecting numeric in D15847 / R15847C4: got 'n.a.'
## Warning: Expecting numeric in D15848 / R15848C4: got 'n.a.'
## Warning: Expecting numeric in D15849 / R15849C4: got 'n.a.'
## Warning: Expecting numeric in D15850 / R15850C4: got 'n.a.'
## Warning: Expecting numeric in D15851 / R15851C4: got 'n.a.'
## Warning: Expecting numeric in D15852 / R15852C4: got 'n.a.'
## Warning: Expecting numeric in D15853 / R15853C4: got 'n.a.'
## Warning: Expecting numeric in D15854 / R15854C4: got 'n.a.'
## Warning: Expecting numeric in D15855 / R15855C4: got 'n.a.'
## Warning: Expecting numeric in D15856 / R15856C4: got 'n.a.'
## Warning: Expecting numeric in D15857 / R15857C4: got 'n.a.'
## Warning: Expecting numeric in D15858 / R15858C4: got 'n.a.'
## Warning: Expecting numeric in D15859 / R15859C4: got 'n.a.'
## Warning: Expecting numeric in D15860 / R15860C4: got 'n.a.'
## Warning: Expecting numeric in D15861 / R15861C4: got 'n.a.'
## Warning: Expecting numeric in D15862 / R15862C4: got 'n.a.'
## Warning: Expecting numeric in D15863 / R15863C4: got 'n.a.'
## Warning: Expecting numeric in D15864 / R15864C4: got 'n.a.'
## Warning: Expecting numeric in D15865 / R15865C4: got 'n.a.'
## Warning: Expecting numeric in D15866 / R15866C4: got 'n.a.'
## Warning: Expecting numeric in D15867 / R15867C4: got 'n.a.'
## Warning: Expecting numeric in D15868 / R15868C4: got 'n.a.'
## Warning: Expecting numeric in D15869 / R15869C4: got 'n.a.'
## Warning: Expecting numeric in D15870 / R15870C4: got 'n.a.'
## Warning: Expecting numeric in D15871 / R15871C4: got 'n.a.'
## Warning: Expecting numeric in D15872 / R15872C4: got 'n.a.'
## Warning: Expecting numeric in D15873 / R15873C4: got 'n.a.'
## Warning: Expecting numeric in D15874 / R15874C4: got 'n.a.'
## Warning: Expecting numeric in D15875 / R15875C4: got 'n.a.'
## Warning: Expecting numeric in D15876 / R15876C4: got 'n.a.'
## Warning: Expecting numeric in D15877 / R15877C4: got 'n.a.'
## Warning: Expecting numeric in D15878 / R15878C4: got 'n.a.'
## Warning: Expecting numeric in D15879 / R15879C4: got 'n.a.'
## Warning: Expecting numeric in D15880 / R15880C4: got 'n.a.'
## Warning: Expecting numeric in D15881 / R15881C4: got 'n.a.'
## Warning: Expecting numeric in D15882 / R15882C4: got 'n.a.'
## Warning: Expecting numeric in D15883 / R15883C4: got 'n.a.'
## Warning: Expecting numeric in D15884 / R15884C4: got 'n.a.'
## Warning: Expecting numeric in D15885 / R15885C4: got 'n.a.'
## Warning: Expecting numeric in D15886 / R15886C4: got 'n.a.'
## Warning: Expecting numeric in D15887 / R15887C4: got 'n.a.'
## Warning: Expecting numeric in D15888 / R15888C4: got 'n.a.'
## Warning: Expecting numeric in D15889 / R15889C4: got 'n.a.'
## Warning: Expecting numeric in D15890 / R15890C4: got 'n.a.'
## Warning: Expecting numeric in D15891 / R15891C4: got 'n.a.'
## Warning: Expecting numeric in D15892 / R15892C4: got 'n.a.'
## Warning: Expecting numeric in D15893 / R15893C4: got 'n.a.'
## Warning: Expecting numeric in D15894 / R15894C4: got 'n.a.'
## Warning: Expecting numeric in D15895 / R15895C4: got 'n.a.'
## Warning: Expecting numeric in D15896 / R15896C4: got 'n.a.'
## Warning: Expecting numeric in D15897 / R15897C4: got 'n.a.'
## Warning: Expecting numeric in D15898 / R15898C4: got 'n.a.'
## Warning: Expecting numeric in D15899 / R15899C4: got 'n.a.'
## Warning: Expecting numeric in D15900 / R15900C4: got 'n.a.'
## Warning: Expecting numeric in D15901 / R15901C4: got 'n.a.'
## Warning: Expecting numeric in D15902 / R15902C4: got 'n.a.'
## Warning: Expecting numeric in D15903 / R15903C4: got 'n.a.'
## Warning: Expecting numeric in D15904 / R15904C4: got 'n.a.'
## Warning: Expecting numeric in D15905 / R15905C4: got 'n.a.'
## Warning: Expecting numeric in D15906 / R15906C4: got 'n.a.'
## Warning: Expecting numeric in D15907 / R15907C4: got 'n.a.'
## Warning: Expecting numeric in D15908 / R15908C4: got 'n.a.'
## Warning: Expecting numeric in D15909 / R15909C4: got 'n.a.'
## Warning: Expecting numeric in D15910 / R15910C4: got 'n.a.'
## Warning: Expecting numeric in D15911 / R15911C4: got 'n.a.'
## Warning: Expecting numeric in D15912 / R15912C4: got 'n.a.'
## Warning: Expecting numeric in D15913 / R15913C4: got 'n.a.'
## Warning: Expecting numeric in D15914 / R15914C4: got 'n.a.'
## Warning: Expecting numeric in D15915 / R15915C4: got 'n.a.'
## Warning: Expecting numeric in D15916 / R15916C4: got 'n.a.'
## Warning: Expecting numeric in D15917 / R15917C4: got 'n.a.'
## Warning: Expecting numeric in D15918 / R15918C4: got 'n.a.'
## Warning: Expecting numeric in D15919 / R15919C4: got 'n.a.'
## Warning: Expecting numeric in D15920 / R15920C4: got 'n.a.'
## Warning: Expecting numeric in D15921 / R15921C4: got 'n.a.'
## Warning: Expecting numeric in D15922 / R15922C4: got 'n.a.'
## Warning: Expecting numeric in D15923 / R15923C4: got 'n.a.'
## Warning: Expecting numeric in D15924 / R15924C4: got 'n.a.'
## Warning: Expecting numeric in D15925 / R15925C4: got 'n.a.'
## Warning: Expecting numeric in D15926 / R15926C4: got 'n.a.'
## Warning: Expecting numeric in D15927 / R15927C4: got 'n.a.'
## Warning: Expecting numeric in D15928 / R15928C4: got 'n.a.'
## Warning: Expecting numeric in D15929 / R15929C4: got 'n.a.'
## Warning: Expecting numeric in D15930 / R15930C4: got 'n.a.'
## Warning: Expecting numeric in D15931 / R15931C4: got 'n.a.'
## Warning: Expecting numeric in D15932 / R15932C4: got 'n.a.'
## Warning: Expecting numeric in D15933 / R15933C4: got 'n.a.'
## Warning: Expecting numeric in D15934 / R15934C4: got 'n.a.'
## Warning: Expecting numeric in D15935 / R15935C4: got 'n.a.'
## Warning: Expecting numeric in D15936 / R15936C4: got 'n.a.'
## Warning: Expecting numeric in D15937 / R15937C4: got 'n.a.'
## Warning: Expecting numeric in D15938 / R15938C4: got 'n.a.'
## Warning: Expecting numeric in D15939 / R15939C4: got 'n.a.'
## Warning: Expecting numeric in D15940 / R15940C4: got 'n.a.'
## Warning: Expecting numeric in D15941 / R15941C4: got 'n.a.'
## Warning: Expecting numeric in D15942 / R15942C4: got 'n.a.'
## Warning: Expecting numeric in D15943 / R15943C4: got 'n.a.'
## Warning: Expecting numeric in D15944 / R15944C4: got 'n.a.'
## Warning: Expecting numeric in D15945 / R15945C4: got 'n.a.'
## Warning: Expecting numeric in D15946 / R15946C4: got 'n.a.'
## Warning: Expecting numeric in D15947 / R15947C4: got 'n.a.'
## Warning: Expecting numeric in D15948 / R15948C4: got 'n.a.'
## Warning: Expecting numeric in D15949 / R15949C4: got 'n.a.'
## Warning: Expecting numeric in D15950 / R15950C4: got 'n.a.'
## Warning: Expecting numeric in D15951 / R15951C4: got 'n.a.'
## Warning: Expecting numeric in D15952 / R15952C4: got 'n.a.'
## Warning: Expecting numeric in D15953 / R15953C4: got 'n.a.'
## Warning: Expecting numeric in D15954 / R15954C4: got 'n.a.'
## Warning: Expecting numeric in D15955 / R15955C4: got 'n.a.'
## Warning: Expecting numeric in D15956 / R15956C4: got 'n.a.'
## Warning: Expecting numeric in D15957 / R15957C4: got 'n.a.'
## Warning: Expecting numeric in D15958 / R15958C4: got 'n.a.'
## Warning: Expecting numeric in D15959 / R15959C4: got 'n.a.'
## Warning: Expecting numeric in D15960 / R15960C4: got 'n.a.'
## Warning: Expecting numeric in D15961 / R15961C4: got 'n.a.'
## Warning: Expecting numeric in D15962 / R15962C4: got 'n.a.'
## Warning: Expecting numeric in D15963 / R15963C4: got 'n.a.'
## Warning: Expecting numeric in D15964 / R15964C4: got 'n.a.'
## Warning: Expecting numeric in D15965 / R15965C4: got 'n.a.'
## Warning: Expecting numeric in D15966 / R15966C4: got 'n.a.'
## Warning: Expecting numeric in D15967 / R15967C4: got 'n.a.'
## Warning: Expecting numeric in D15968 / R15968C4: got 'n.a.'
## Warning: Expecting numeric in D15969 / R15969C4: got 'n.a.'
## Warning: Expecting numeric in D15970 / R15970C4: got 'n.a.'
## Warning: Expecting numeric in D15971 / R15971C4: got 'n.a.'
## Warning: Expecting numeric in D15972 / R15972C4: got 'n.a.'
## Warning: Expecting numeric in D15973 / R15973C4: got 'n.a.'
## Warning: Expecting numeric in D15974 / R15974C4: got 'n.a.'
## Warning: Expecting numeric in D15975 / R15975C4: got 'n.a.'
## Warning: Expecting numeric in D15976 / R15976C4: got 'n.a.'
## Warning: Expecting numeric in D15977 / R15977C4: got 'n.a.'
## Warning: Expecting numeric in D15978 / R15978C4: got 'n.a.'
## Warning: Expecting numeric in D15979 / R15979C4: got 'n.a.'
## Warning: Expecting numeric in D15980 / R15980C4: got 'n.a.'
## Warning: Expecting numeric in D15981 / R15981C4: got 'n.a.'
## Warning: Expecting numeric in D15982 / R15982C4: got 'n.a.'
## Warning: Expecting numeric in D15983 / R15983C4: got 'n.a.'
## Warning: Expecting numeric in D15984 / R15984C4: got 'n.a.'
## Warning: Expecting numeric in D15985 / R15985C4: got 'n.a.'
## Warning: Expecting numeric in D15986 / R15986C4: got 'n.a.'
## Warning: Expecting numeric in D15987 / R15987C4: got 'n.a.'
## Warning: Expecting numeric in D15988 / R15988C4: got 'n.a.'
## Warning: Expecting numeric in D15989 / R15989C4: got 'n.a.'
## Warning: Expecting numeric in D15990 / R15990C4: got 'n.a.'
## Warning: Expecting numeric in D15991 / R15991C4: got 'n.a.'
## Warning: Expecting numeric in D15992 / R15992C4: got 'n.a.'
## Warning: Expecting numeric in D15993 / R15993C4: got 'n.a.'
## Warning: Expecting numeric in D15994 / R15994C4: got 'n.a.'
## Warning: Expecting numeric in D15995 / R15995C4: got 'n.a.'
## Warning: Expecting numeric in D15996 / R15996C4: got 'n.a.'
## Warning: Expecting numeric in D15997 / R15997C4: got 'n.a.'
## Warning: Expecting numeric in D15998 / R15998C4: got 'n.a.'
## Warning: Expecting numeric in D15999 / R15999C4: got 'n.a.'
## Warning: Expecting numeric in D16000 / R16000C4: got 'n.a.'
## Warning: Expecting numeric in D16001 / R16001C4: got 'n.a.'
## Warning: Expecting numeric in D16002 / R16002C4: got 'n.a.'
## Warning: Expecting numeric in D16003 / R16003C4: got 'n.a.'
## Warning: Expecting numeric in D16004 / R16004C4: got 'n.a.'
## Warning: Expecting numeric in D16005 / R16005C4: got 'n.a.'
## Warning: Expecting numeric in D16006 / R16006C4: got 'n.a.'
## Warning: Expecting numeric in D16007 / R16007C4: got 'n.a.'
## Warning: Expecting numeric in D16008 / R16008C4: got 'n.a.'
## Warning: Expecting numeric in D16009 / R16009C4: got 'n.a.'
## Warning: Expecting numeric in D16010 / R16010C4: got 'n.a.'
## Warning: Expecting numeric in D16011 / R16011C4: got 'n.a.'
## Warning: Expecting numeric in D16012 / R16012C4: got 'n.a.'
## Warning: Expecting numeric in D16013 / R16013C4: got 'n.a.'
## Warning: Expecting numeric in D16014 / R16014C4: got 'n.a.'
## Warning: Expecting numeric in D16015 / R16015C4: got 'n.a.'
## Warning: Expecting numeric in D16016 / R16016C4: got 'n.a.'
## Warning: Expecting numeric in D16017 / R16017C4: got 'n.a.'
## Warning: Expecting numeric in D16018 / R16018C4: got 'n.a.'
## Warning: Expecting numeric in D16019 / R16019C4: got 'n.a.'
## Warning: Expecting numeric in D16020 / R16020C4: got 'n.a.'
## Warning: Expecting numeric in D16021 / R16021C4: got 'n.a.'
## Warning: Expecting numeric in D16022 / R16022C4: got 'n.a.'
## Warning: Expecting numeric in D16023 / R16023C4: got 'n.a.'
## Warning: Expecting numeric in D16024 / R16024C4: got 'n.a.'
## Warning: Expecting numeric in D16025 / R16025C4: got 'n.a.'
## Warning: Expecting numeric in D16026 / R16026C4: got 'n.a.'
## Warning: Expecting numeric in D16027 / R16027C4: got 'n.a.'
## Warning: Expecting numeric in D16028 / R16028C4: got 'n.a.'
## Warning: Expecting numeric in D16029 / R16029C4: got 'n.a.'
## Warning: Expecting numeric in D16030 / R16030C4: got 'n.a.'
## Warning: Expecting numeric in D16031 / R16031C4: got 'n.a.'
## Warning: Expecting numeric in D16032 / R16032C4: got 'n.a.'
## Warning: Expecting numeric in D16033 / R16033C4: got 'n.a.'
## Warning: Expecting numeric in D16034 / R16034C4: got 'n.a.'
## Warning: Expecting numeric in D16035 / R16035C4: got 'n.a.'
## Warning: Expecting numeric in D16036 / R16036C4: got 'n.a.'
## Warning: Expecting numeric in D16037 / R16037C4: got 'n.a.'
## Warning: Expecting numeric in D16038 / R16038C4: got 'n.a.'
## Warning: Expecting numeric in D16039 / R16039C4: got 'n.a.'
## Warning: Expecting numeric in D16040 / R16040C4: got 'n.a.'
## Warning: Expecting numeric in D16041 / R16041C4: got 'n.a.'
## Warning: Expecting numeric in D16042 / R16042C4: got 'n.a.'
## Warning: Expecting numeric in D16043 / R16043C4: got 'n.a.'
## Warning: Expecting numeric in D16044 / R16044C4: got 'n.a.'
## Warning: Expecting numeric in D16045 / R16045C4: got 'n.a.'
## Warning: Expecting numeric in D16046 / R16046C4: got 'n.a.'
## Warning: Expecting numeric in D16047 / R16047C4: got 'n.a.'
## Warning: Expecting numeric in D16048 / R16048C4: got 'n.a.'
## Warning: Expecting numeric in D16049 / R16049C4: got 'n.a.'
## Warning: Expecting numeric in D16050 / R16050C4: got 'n.a.'
## Warning: Expecting numeric in D16051 / R16051C4: got 'n.a.'
## Warning: Expecting numeric in D16052 / R16052C4: got 'n.a.'
## Warning: Expecting numeric in D16053 / R16053C4: got 'n.a.'
## Warning: Expecting numeric in D16054 / R16054C4: got 'n.a.'
## Warning: Expecting numeric in D16055 / R16055C4: got 'n.a.'
## Warning: Expecting numeric in D16056 / R16056C4: got 'n.a.'
## Warning: Expecting numeric in D16057 / R16057C4: got 'n.a.'
## Warning: Expecting numeric in D16058 / R16058C4: got 'n.a.'
## Warning: Expecting numeric in D16059 / R16059C4: got 'n.a.'
## Warning: Expecting numeric in D16060 / R16060C4: got 'n.a.'
## Warning: Expecting numeric in D16061 / R16061C4: got 'n.a.'
## Warning: Expecting numeric in D16062 / R16062C4: got 'n.a.'
## Warning: Expecting numeric in D16063 / R16063C4: got 'n.a.'
## Warning: Expecting numeric in D16064 / R16064C4: got 'n.a.'
## Warning: Expecting numeric in D16065 / R16065C4: got 'n.a.'
## Warning: Expecting numeric in D16066 / R16066C4: got 'n.a.'
## Warning: Expecting numeric in D16067 / R16067C4: got 'n.a.'
## Warning: Expecting numeric in D16068 / R16068C4: got 'n.a.'
## Warning: Expecting numeric in D16069 / R16069C4: got 'n.a.'
## Warning: Expecting numeric in D16070 / R16070C4: got 'n.a.'
## Warning: Expecting numeric in D16071 / R16071C4: got 'n.a.'
## Warning: Expecting numeric in D16072 / R16072C4: got 'n.a.'
## Warning: Expecting numeric in D16073 / R16073C4: got 'n.a.'
## Warning: Expecting numeric in D16074 / R16074C4: got 'n.a.'
## Warning: Expecting numeric in D16075 / R16075C4: got 'n.a.'
## Warning: Expecting numeric in D16076 / R16076C4: got 'n.a.'
## Warning: Expecting numeric in D16077 / R16077C4: got 'n.a.'
## Warning: Expecting numeric in D16078 / R16078C4: got 'n.a.'
## Warning: Expecting numeric in D16079 / R16079C4: got 'n.a.'
## Warning: Expecting numeric in D16080 / R16080C4: got 'n.a.'
## Warning: Expecting numeric in D16081 / R16081C4: got 'n.a.'
## Warning: Expecting numeric in D16082 / R16082C4: got 'n.a.'
## Warning: Expecting numeric in D16083 / R16083C4: got 'n.a.'
## Warning: Expecting numeric in D16084 / R16084C4: got 'n.a.'
## Warning: Expecting numeric in D16085 / R16085C4: got 'n.a.'
## Warning: Expecting numeric in D16086 / R16086C4: got 'n.a.'
## Warning: Expecting numeric in D16087 / R16087C4: got 'n.a.'
## Warning: Expecting numeric in D16088 / R16088C4: got 'n.a.'
## Warning: Expecting numeric in D16089 / R16089C4: got 'n.a.'
## Warning: Expecting numeric in D16090 / R16090C4: got 'n.a.'
## Warning: Expecting numeric in D16091 / R16091C4: got 'n.a.'
## Warning: Expecting numeric in D16092 / R16092C4: got 'n.a.'
## Warning: Expecting numeric in D16093 / R16093C4: got 'n.a.'
## Warning: Expecting numeric in D16094 / R16094C4: got 'n.a.'
## Warning: Expecting numeric in D16095 / R16095C4: got 'n.a.'
## Warning: Expecting numeric in D16096 / R16096C4: got 'n.a.'
## Warning: Expecting numeric in D16097 / R16097C4: got 'n.a.'
## Warning: Expecting numeric in D16098 / R16098C4: got 'n.a.'
## Warning: Expecting numeric in D16099 / R16099C4: got 'n.a.'
## Warning: Expecting numeric in D16100 / R16100C4: got 'n.a.'
## Warning: Expecting numeric in D16101 / R16101C4: got 'n.a.'
## Warning: Expecting numeric in D16102 / R16102C4: got 'n.a.'
## Warning: Expecting numeric in D16103 / R16103C4: got 'n.a.'
## Warning: Expecting numeric in D16104 / R16104C4: got 'n.a.'
## Warning: Expecting numeric in D16105 / R16105C4: got 'n.a.'
## Warning: Expecting numeric in D16106 / R16106C4: got 'n.a.'
## Warning: Expecting numeric in D16107 / R16107C4: got 'n.a.'
## Warning: Expecting numeric in D16108 / R16108C4: got 'n.a.'
## Warning: Expecting numeric in D16109 / R16109C4: got 'n.a.'
## Warning: Expecting numeric in D16110 / R16110C4: got 'n.a.'
## Warning: Expecting numeric in D16111 / R16111C4: got 'n.a.'
## Warning: Expecting numeric in D16112 / R16112C4: got 'n.a.'
## Warning: Expecting numeric in D16113 / R16113C4: got 'n.a.'
## Warning: Expecting numeric in D16114 / R16114C4: got 'n.a.'
## Warning: Expecting numeric in D16115 / R16115C4: got 'n.a.'
## Warning: Expecting numeric in D16116 / R16116C4: got 'n.a.'
## Warning: Expecting numeric in D16117 / R16117C4: got 'n.a.'
## Warning: Expecting numeric in D16118 / R16118C4: got 'n.a.'
## Warning: Expecting numeric in D16119 / R16119C4: got 'n.a.'
## Warning: Expecting numeric in D16120 / R16120C4: got 'n.a.'
## Warning: Expecting numeric in D16121 / R16121C4: got 'n.a.'
## Warning: Expecting numeric in D16122 / R16122C4: got 'n.a.'
## Warning: Expecting numeric in D16123 / R16123C4: got 'n.a.'
## Warning: Expecting numeric in D16124 / R16124C4: got 'n.a.'
## Warning: Expecting numeric in D16125 / R16125C4: got 'n.a.'
## Warning: Expecting numeric in D16126 / R16126C4: got 'n.a.'
## Warning: Expecting numeric in D16127 / R16127C4: got 'n.a.'
## Warning: Expecting numeric in D16128 / R16128C4: got 'n.a.'
## Warning: Expecting numeric in D16129 / R16129C4: got 'n.a.'
## Warning: Expecting numeric in D16130 / R16130C4: got 'n.a.'
## Warning: Expecting numeric in D16131 / R16131C4: got 'n.a.'
## Warning: Expecting numeric in D16132 / R16132C4: got 'n.a.'
## Warning: Expecting numeric in D16133 / R16133C4: got 'n.a.'
## Warning: Expecting numeric in D16134 / R16134C4: got 'n.a.'
## Warning: Expecting numeric in D16135 / R16135C4: got 'n.a.'
## Warning: Expecting numeric in D16136 / R16136C4: got 'n.a.'
## Warning: Expecting numeric in D16137 / R16137C4: got 'n.a.'
## Warning: Expecting numeric in D16138 / R16138C4: got 'n.a.'
## Warning: Expecting numeric in D16139 / R16139C4: got 'n.a.'
## Warning: Expecting numeric in D16140 / R16140C4: got 'n.a.'
## Warning: Expecting numeric in D16141 / R16141C4: got 'n.a.'
## Warning: Expecting numeric in D16142 / R16142C4: got 'n.a.'
## Warning: Expecting numeric in D16143 / R16143C4: got 'n.a.'
## Warning: Expecting numeric in D16144 / R16144C4: got 'n.a.'
## Warning: Expecting numeric in D16145 / R16145C4: got 'n.a.'
## Warning: Expecting numeric in D16146 / R16146C4: got 'n.a.'
## Warning: Expecting numeric in D16147 / R16147C4: got 'n.a.'
## Warning: Expecting numeric in D16148 / R16148C4: got 'n.a.'
## Warning: Expecting numeric in D16149 / R16149C4: got 'n.a.'
## Warning: Expecting numeric in D16150 / R16150C4: got 'n.a.'
## Warning: Expecting numeric in D16151 / R16151C4: got 'n.a.'
## Warning: Expecting numeric in D16152 / R16152C4: got 'n.a.'
## Warning: Expecting numeric in D16153 / R16153C4: got 'n.a.'
## Warning: Expecting numeric in D16154 / R16154C4: got 'n.a.'
## Warning: Expecting numeric in D16155 / R16155C4: got 'n.a.'
## Warning: Expecting numeric in D16156 / R16156C4: got 'n.a.'
## Warning: Expecting numeric in D16157 / R16157C4: got 'n.a.'
## Warning: Expecting numeric in D16158 / R16158C4: got 'n.a.'
## Warning: Expecting numeric in D16159 / R16159C4: got 'n.a.'
## Warning: Expecting numeric in D16160 / R16160C4: got 'n.a.'
## Warning: Expecting numeric in D16161 / R16161C4: got 'n.a.'
## Warning: Expecting numeric in D16162 / R16162C4: got 'n.a.'
## Warning: Expecting numeric in D16163 / R16163C4: got 'n.a.'
## Warning: Expecting numeric in D16164 / R16164C4: got 'n.a.'
## Warning: Expecting numeric in D16165 / R16165C4: got 'n.a.'
## Warning: Expecting numeric in D16166 / R16166C4: got 'n.a.'
## Warning: Expecting numeric in D16167 / R16167C4: got 'n.a.'
## Warning: Expecting numeric in D16168 / R16168C4: got 'n.a.'
## Warning: Expecting numeric in D16169 / R16169C4: got 'n.a.'
## Warning: Expecting numeric in D16170 / R16170C4: got 'n.a.'
## Warning: Expecting numeric in D16171 / R16171C4: got 'n.a.'
## Warning: Expecting numeric in D16172 / R16172C4: got 'n.a.'
## Warning: Expecting numeric in D16173 / R16173C4: got 'n.a.'
## Warning: Expecting numeric in D16174 / R16174C4: got 'n.a.'
## Warning: Expecting numeric in D16175 / R16175C4: got 'n.a.'
## Warning: Expecting numeric in D16176 / R16176C4: got 'n.a.'
## Warning: Expecting numeric in D16177 / R16177C4: got 'n.a.'
## Warning: Expecting numeric in D16178 / R16178C4: got 'n.a.'
## Warning: Expecting numeric in D16179 / R16179C4: got 'n.a.'
## Warning: Expecting numeric in D16180 / R16180C4: got 'n.a.'
## Warning: Expecting numeric in D16181 / R16181C4: got 'n.a.'
## Warning: Expecting numeric in D16182 / R16182C4: got 'n.a.'
## Warning: Expecting numeric in D16183 / R16183C4: got 'n.a.'
## Warning: Expecting numeric in D16184 / R16184C4: got 'n.a.'
## Warning: Expecting numeric in D16185 / R16185C4: got 'n.a.'
## Warning: Expecting numeric in D16186 / R16186C4: got 'n.a.'
## Warning: Expecting numeric in D16187 / R16187C4: got 'n.a.'
## Warning: Expecting numeric in D16188 / R16188C4: got 'n.a.'
## Warning: Expecting numeric in D16189 / R16189C4: got 'n.a.'
## Warning: Expecting numeric in D16190 / R16190C4: got 'n.a.'
## Warning: Expecting numeric in D16191 / R16191C4: got 'n.a.'
## Warning: Expecting numeric in D16192 / R16192C4: got 'n.a.'
## Warning: Expecting numeric in D16193 / R16193C4: got 'n.a.'
## Warning: Expecting numeric in D16194 / R16194C4: got 'n.a.'
## Warning: Expecting numeric in D16195 / R16195C4: got 'n.a.'
## Warning: Expecting numeric in D16196 / R16196C4: got 'n.a.'
## Warning: Expecting numeric in D16197 / R16197C4: got 'n.a.'
## Warning: Expecting numeric in D16198 / R16198C4: got 'n.a.'
## Warning: Expecting numeric in D16199 / R16199C4: got 'n.a.'
## Warning: Expecting numeric in D16200 / R16200C4: got 'n.a.'
## Warning: Expecting numeric in D16201 / R16201C4: got 'n.a.'
## Warning: Expecting numeric in D16202 / R16202C4: got 'n.a.'
## Warning: Expecting numeric in D16203 / R16203C4: got 'n.a.'
## Warning: Expecting numeric in D16204 / R16204C4: got 'n.a.'
## Warning: Expecting numeric in D16205 / R16205C4: got 'n.a.'
## Warning: Expecting numeric in D16206 / R16206C4: got 'n.a.'
## Warning: Expecting numeric in D16207 / R16207C4: got 'n.a.'
## Warning: Expecting numeric in D16208 / R16208C4: got 'n.a.'
## Warning: Expecting numeric in D16209 / R16209C4: got 'n.a.'
## Warning: Expecting numeric in D16210 / R16210C4: got 'n.a.'
## Warning: Expecting numeric in D16211 / R16211C4: got 'n.a.'
## Warning: Expecting numeric in D16212 / R16212C4: got 'n.a.'
## Warning: Expecting numeric in D16213 / R16213C4: got 'n.a.'
## Warning: Expecting numeric in D16214 / R16214C4: got 'n.a.'
## Warning: Expecting numeric in D16215 / R16215C4: got 'n.a.'
## Warning: Expecting numeric in D16216 / R16216C4: got 'n.a.'
## Warning: Expecting numeric in D16217 / R16217C4: got 'n.a.'
## Warning: Expecting numeric in D16218 / R16218C4: got 'n.a.'
## Warning: Expecting numeric in D16219 / R16219C4: got 'n.a.'
## Warning: Expecting numeric in D16220 / R16220C4: got 'n.a.'
## Warning: Expecting numeric in D16221 / R16221C4: got 'n.a.'
## Warning: Expecting numeric in D16222 / R16222C4: got 'n.a.'
## Warning: Expecting numeric in D16223 / R16223C4: got 'n.a.'
## Warning: Expecting numeric in D16224 / R16224C4: got 'n.a.'
## Warning: Expecting numeric in D16225 / R16225C4: got 'n.a.'
## Warning: Expecting numeric in D16226 / R16226C4: got 'n.a.'
## Warning: Expecting numeric in D16227 / R16227C4: got 'n.a.'
## Warning: Expecting numeric in D16228 / R16228C4: got 'n.a.'
## Warning: Expecting numeric in D16229 / R16229C4: got 'n.a.'
## Warning: Expecting numeric in D16230 / R16230C4: got 'n.a.'
## Warning: Expecting numeric in D16231 / R16231C4: got 'n.a.'
## Warning: Expecting numeric in D16232 / R16232C4: got 'n.a.'
## Warning: Expecting numeric in D16233 / R16233C4: got 'n.a.'
## Warning: Expecting numeric in D16234 / R16234C4: got 'n.a.'
## Warning: Expecting numeric in D16235 / R16235C4: got 'n.a.'
## Warning: Expecting numeric in D16236 / R16236C4: got 'n.a.'
## Warning: Expecting numeric in D16237 / R16237C4: got 'n.a.'
## Warning: Expecting numeric in D16238 / R16238C4: got 'n.a.'
## Warning: Expecting numeric in D16239 / R16239C4: got 'n.a.'
## Warning: Expecting numeric in D16240 / R16240C4: got 'n.a.'
## Warning: Expecting numeric in D16241 / R16241C4: got 'n.a.'
## Warning: Expecting numeric in D16242 / R16242C4: got 'n.a.'
## Warning: Expecting numeric in D16243 / R16243C4: got 'n.a.'
## Warning: Expecting numeric in D16244 / R16244C4: got 'n.a.'
## Warning: Expecting numeric in D16245 / R16245C4: got 'n.a.'
## Warning: Expecting numeric in D16246 / R16246C4: got 'n.a.'
## Warning: Expecting numeric in D16247 / R16247C4: got 'n.a.'
## Warning: Expecting numeric in D16248 / R16248C4: got 'n.a.'
## Warning: Expecting numeric in D16249 / R16249C4: got 'n.a.'
## Warning: Expecting numeric in D16250 / R16250C4: got 'n.a.'
## Warning: Expecting numeric in D16251 / R16251C4: got 'n.a.'
## Warning: Expecting numeric in D16252 / R16252C4: got 'n.a.'
## Warning: Expecting numeric in D16253 / R16253C4: got 'n.a.'
## Warning: Expecting numeric in D16254 / R16254C4: got 'n.a.'
## Warning: Expecting numeric in D16255 / R16255C4: got 'n.a.'
## Warning: Expecting numeric in D16256 / R16256C4: got 'n.a.'
## Warning: Expecting numeric in D16257 / R16257C4: got 'n.a.'
## Warning: Expecting numeric in D16258 / R16258C4: got 'n.a.'
## Warning: Expecting numeric in D16259 / R16259C4: got 'n.a.'
## Warning: Expecting numeric in D16260 / R16260C4: got 'n.a.'
## Warning: Expecting numeric in D16261 / R16261C4: got 'n.a.'
## Warning: Expecting numeric in D16262 / R16262C4: got 'n.a.'
## Warning: Expecting numeric in D16263 / R16263C4: got 'n.a.'
## Warning: Expecting numeric in D16264 / R16264C4: got 'n.a.'
## Warning: Expecting numeric in D16265 / R16265C4: got 'n.a.'
## Warning: Expecting numeric in D16266 / R16266C4: got 'n.a.'
## Warning: Expecting numeric in D16267 / R16267C4: got 'n.a.'
## Warning: Expecting numeric in D16268 / R16268C4: got 'n.a.'
## Warning: Expecting numeric in D16269 / R16269C4: got 'n.a.'
## Warning: Expecting numeric in D16270 / R16270C4: got 'n.a.'
## Warning: Expecting numeric in D16271 / R16271C4: got 'n.a.'
## Warning: Expecting numeric in D16272 / R16272C4: got 'n.a.'
## Warning: Expecting numeric in D16273 / R16273C4: got 'n.a.'
## Warning: Expecting numeric in D16274 / R16274C4: got 'n.a.'
## Warning: Expecting numeric in D16275 / R16275C4: got 'n.a.'
## Warning: Expecting numeric in D16276 / R16276C4: got 'n.a.'
## Warning: Expecting numeric in D16277 / R16277C4: got 'n.a.'
## Warning: Expecting numeric in D16278 / R16278C4: got 'n.a.'
## Warning: Expecting numeric in D16279 / R16279C4: got 'n.a.'
## Warning: Expecting numeric in D16280 / R16280C4: got 'n.a.'
## Warning: Expecting numeric in D16281 / R16281C4: got 'n.a.'
## Warning: Expecting numeric in D16282 / R16282C4: got 'n.a.'
## Warning: Expecting numeric in D16283 / R16283C4: got 'n.a.'
## Warning: Expecting numeric in D16284 / R16284C4: got 'n.a.'
## Warning: Expecting numeric in D16285 / R16285C4: got 'n.a.'
## Warning: Expecting numeric in D16286 / R16286C4: got 'n.a.'
## Warning: Expecting numeric in D16287 / R16287C4: got 'n.a.'
## Warning: Expecting numeric in D16288 / R16288C4: got 'n.a.'
## Warning: Expecting numeric in D16289 / R16289C4: got 'n.a.'
## Warning: Expecting numeric in D16290 / R16290C4: got 'n.a.'
## Warning: Expecting numeric in D16291 / R16291C4: got 'n.a.'
## Warning: Expecting numeric in D16292 / R16292C4: got 'n.a.'
## Warning: Expecting numeric in D16293 / R16293C4: got 'n.a.'
## Warning: Expecting numeric in D16294 / R16294C4: got 'n.a.'
## Warning: Expecting numeric in D16295 / R16295C4: got 'n.a.'
## Warning: Expecting numeric in D16296 / R16296C4: got 'n.a.'
## Warning: Expecting numeric in D16297 / R16297C4: got 'n.a.'
## Warning: Expecting numeric in D16298 / R16298C4: got 'n.a.'
## Warning: Expecting numeric in D16299 / R16299C4: got 'n.a.'
## Warning: Expecting numeric in D16300 / R16300C4: got 'n.a.'
## Warning: Expecting numeric in D16301 / R16301C4: got 'n.a.'
## Warning: Expecting numeric in D16302 / R16302C4: got 'n.a.'
## Warning: Expecting numeric in D16303 / R16303C4: got 'n.a.'
## Warning: Expecting numeric in D16304 / R16304C4: got 'n.a.'
## Warning: Expecting numeric in D16305 / R16305C4: got 'n.a.'
## Warning: Expecting numeric in D16306 / R16306C4: got 'n.a.'
## Warning: Expecting numeric in D16307 / R16307C4: got 'n.a.'
## Warning: Expecting numeric in D16308 / R16308C4: got 'n.a.'
## Warning: Expecting numeric in D16309 / R16309C4: got 'n.a.'
## Warning: Expecting numeric in D16310 / R16310C4: got 'n.a.'
## Warning: Expecting numeric in D16311 / R16311C4: got 'n.a.'
## Warning: Expecting numeric in D16312 / R16312C4: got 'n.a.'
## Warning: Expecting numeric in D16313 / R16313C4: got 'n.a.'
## Warning: Expecting numeric in D16314 / R16314C4: got 'n.a.'
## Warning: Expecting numeric in D16315 / R16315C4: got 'n.a.'
## Warning: Expecting numeric in D16316 / R16316C4: got 'n.a.'
## Warning: Expecting numeric in D16317 / R16317C4: got 'n.a.'
## Warning: Expecting numeric in D16318 / R16318C4: got 'n.a.'
## Warning: Expecting numeric in D16319 / R16319C4: got 'n.a.'
## Warning: Expecting numeric in D16320 / R16320C4: got 'n.a.'
## Warning: Expecting numeric in D16321 / R16321C4: got 'n.a.'
## Warning: Expecting numeric in D16322 / R16322C4: got 'n.a.'
## Warning: Expecting numeric in D16323 / R16323C4: got 'n.a.'
## Warning: Expecting numeric in D16324 / R16324C4: got 'n.a.'
## Warning: Expecting numeric in D16325 / R16325C4: got 'n.a.'
## Warning: Expecting numeric in D16326 / R16326C4: got 'n.a.'
## Warning: Expecting numeric in D16327 / R16327C4: got 'n.a.'
## Warning: Expecting numeric in D16328 / R16328C4: got 'n.a.'
## Warning: Expecting numeric in D16329 / R16329C4: got 'n.a.'
## Warning: Expecting numeric in D16330 / R16330C4: got 'n.a.'
## Warning: Expecting numeric in D16331 / R16331C4: got 'n.a.'
## Warning: Expecting numeric in D16332 / R16332C4: got 'n.a.'
## Warning: Expecting numeric in D16333 / R16333C4: got 'n.a.'
## Warning: Expecting numeric in D16334 / R16334C4: got 'n.a.'
## Warning: Expecting numeric in D16335 / R16335C4: got 'n.a.'
## Warning: Expecting numeric in D16336 / R16336C4: got 'n.a.'
## Warning: Expecting numeric in D16337 / R16337C4: got 'n.a.'
## Warning: Expecting numeric in D16338 / R16338C4: got 'n.a.'
## Warning: Expecting numeric in D16339 / R16339C4: got 'n.a.'
## Warning: Expecting numeric in D16340 / R16340C4: got 'n.a.'
## Warning: Expecting numeric in D16341 / R16341C4: got 'n.a.'
## Warning: Expecting numeric in D16342 / R16342C4: got 'n.a.'
## Warning: Expecting numeric in D16343 / R16343C4: got 'n.a.'
## Warning: Expecting numeric in D16344 / R16344C4: got 'n.a.'
## Warning: Expecting numeric in D16345 / R16345C4: got 'n.a.'
## Warning: Expecting numeric in D16346 / R16346C4: got 'n.a.'
## Warning: Expecting numeric in D16347 / R16347C4: got 'n.a.'
## Warning: Expecting numeric in D16348 / R16348C4: got 'n.a.'
## Warning: Expecting numeric in D16349 / R16349C4: got 'n.a.'
## Warning: Expecting numeric in D16350 / R16350C4: got 'n.a.'
## Warning: Expecting numeric in D16351 / R16351C4: got 'n.a.'
## Warning: Expecting numeric in D16352 / R16352C4: got 'n.a.'
## Warning: Expecting numeric in D16353 / R16353C4: got 'n.a.'
## Warning: Expecting numeric in D16354 / R16354C4: got 'n.a.'
## Warning: Expecting numeric in D16355 / R16355C4: got 'n.a.'
## Warning: Expecting numeric in D16356 / R16356C4: got 'n.a.'
## Warning: Expecting numeric in D16357 / R16357C4: got 'n.a.'
## Warning: Expecting numeric in D16358 / R16358C4: got 'n.a.'
## Warning: Expecting numeric in D16359 / R16359C4: got 'n.a.'
## Warning: Expecting numeric in D16360 / R16360C4: got 'n.a.'
## Warning: Expecting numeric in D16361 / R16361C4: got 'n.a.'
## Warning: Expecting numeric in D16362 / R16362C4: got 'n.a.'
## Warning: Expecting numeric in D16363 / R16363C4: got 'n.a.'
## Warning: Expecting numeric in D16364 / R16364C4: got 'n.a.'
## Warning: Expecting numeric in D16365 / R16365C4: got 'n.a.'
## Warning: Expecting numeric in D16366 / R16366C4: got 'n.a.'
## Warning: Expecting numeric in D16367 / R16367C4: got 'n.a.'
## Warning: Expecting numeric in D16368 / R16368C4: got 'n.a.'
## Warning: Expecting numeric in D16369 / R16369C4: got 'n.a.'
## Warning: Expecting numeric in D16370 / R16370C4: got 'n.a.'
## Warning: Expecting numeric in D16371 / R16371C4: got 'n.a.'
## Warning: Expecting numeric in D16372 / R16372C4: got 'n.a.'
## Warning: Expecting numeric in D16373 / R16373C4: got 'n.a.'
## Warning: Expecting numeric in D16374 / R16374C4: got 'n.a.'
## Warning: Expecting numeric in D16375 / R16375C4: got 'n.a.'
## Warning: Expecting numeric in D16376 / R16376C4: got 'n.a.'
## Warning: Expecting numeric in D16377 / R16377C4: got 'n.a.'
## Warning: Expecting numeric in D16378 / R16378C4: got 'n.a.'
## Warning: Expecting numeric in D16379 / R16379C4: got 'n.a.'
## Warning: Expecting numeric in D16380 / R16380C4: got 'n.a.'
## Warning: Expecting numeric in D16381 / R16381C4: got 'n.a.'
## Warning: Expecting numeric in D16382 / R16382C4: got 'n.a.'
## Warning: Expecting numeric in D16383 / R16383C4: got 'n.a.'
## Warning: Expecting numeric in D16384 / R16384C4: got 'n.a.'
## Warning: Expecting numeric in D16385 / R16385C4: got 'n.a.'
## Warning: Expecting numeric in D16386 / R16386C4: got 'n.a.'
## Warning: Expecting numeric in D16387 / R16387C4: got 'n.a.'
## Warning: Expecting numeric in D16388 / R16388C4: got 'n.a.'
## Warning: Expecting numeric in D16389 / R16389C4: got 'n.a.'
## Warning: Expecting numeric in D16390 / R16390C4: got 'n.a.'
## Warning: Expecting numeric in D16391 / R16391C4: got 'n.a.'
## Warning: Expecting numeric in D16392 / R16392C4: got 'n.a.'
## Warning: Expecting numeric in D16393 / R16393C4: got 'n.a.'
## Warning: Expecting numeric in D16394 / R16394C4: got 'n.a.'
## Warning: Expecting numeric in D16395 / R16395C4: got 'n.a.'
## Warning: Expecting numeric in D16396 / R16396C4: got 'n.a.'
## Warning: Expecting numeric in D16397 / R16397C4: got 'n.a.'
## Warning: Expecting numeric in D16398 / R16398C4: got 'n.a.'
## Warning: Expecting numeric in D16399 / R16399C4: got 'n.a.'
## Warning: Expecting numeric in D16400 / R16400C4: got 'n.a.'
## Warning: Expecting numeric in D16401 / R16401C4: got 'n.a.'
## Warning: Expecting numeric in D16402 / R16402C4: got 'n.a.'
## Warning: Expecting numeric in D16403 / R16403C4: got 'n.a.'
## Warning: Expecting numeric in D16404 / R16404C4: got 'n.a.'
## Warning: Expecting numeric in D16405 / R16405C4: got 'n.a.'
## Warning: Expecting numeric in D16406 / R16406C4: got 'n.a.'
## Warning: Expecting numeric in D16407 / R16407C4: got 'n.a.'
## Warning: Expecting numeric in D16408 / R16408C4: got 'n.a.'
## Warning: Expecting numeric in D16409 / R16409C4: got 'n.a.'
## Warning: Expecting numeric in D16410 / R16410C4: got 'n.a.'
## Warning: Expecting numeric in D16411 / R16411C4: got 'n.a.'
## Warning: Expecting numeric in D16412 / R16412C4: got 'n.a.'
## Warning: Expecting numeric in D16413 / R16413C4: got 'n.a.'
## Warning: Expecting numeric in D16414 / R16414C4: got 'n.a.'
## Warning: Expecting numeric in D16415 / R16415C4: got 'n.a.'
## Warning: Expecting numeric in D16416 / R16416C4: got 'n.a.'
## Warning: Expecting numeric in D16417 / R16417C4: got 'n.a.'
## Warning: Expecting numeric in D16418 / R16418C4: got 'n.a.'
## Warning: Expecting numeric in D16419 / R16419C4: got 'n.a.'
## Warning: Expecting numeric in D16420 / R16420C4: got 'n.a.'
## Warning: Expecting numeric in D16421 / R16421C4: got 'n.a.'
## Warning: Expecting numeric in D16422 / R16422C4: got 'n.a.'
## Warning: Expecting numeric in D16423 / R16423C4: got 'n.a.'
## Warning: Expecting numeric in D16424 / R16424C4: got 'n.a.'
## Warning: Expecting numeric in D16425 / R16425C4: got 'n.a.'
## Warning: Expecting numeric in D16426 / R16426C4: got 'n.a.'
## Warning: Expecting numeric in D16427 / R16427C4: got 'n.a.'
## Warning: Expecting numeric in D16428 / R16428C4: got 'n.a.'
## Warning: Expecting numeric in D16429 / R16429C4: got 'n.a.'
## Warning: Expecting numeric in D16430 / R16430C4: got 'n.a.'
## Warning: Expecting numeric in D16431 / R16431C4: got 'n.a.'
## Warning: Expecting numeric in D16432 / R16432C4: got 'n.a.'
## Warning: Expecting numeric in D16433 / R16433C4: got 'n.a.'
## Warning: Expecting numeric in D16434 / R16434C4: got 'n.a.'
## Warning: Expecting numeric in D16435 / R16435C4: got 'n.a.'
## Warning: Expecting numeric in D16436 / R16436C4: got 'n.a.'
## Warning: Expecting numeric in D16437 / R16437C4: got 'n.a.'
## Warning: Expecting numeric in D16438 / R16438C4: got 'n.a.'
## Warning: Expecting numeric in D16439 / R16439C4: got 'n.a.'
## Warning: Expecting numeric in D16440 / R16440C4: got 'n.a.'
## Warning: Expecting numeric in D16441 / R16441C4: got 'n.a.'
## Warning: Expecting numeric in D16442 / R16442C4: got 'n.a.'
## Warning: Expecting numeric in D16443 / R16443C4: got 'n.a.'
## Warning: Expecting numeric in D16444 / R16444C4: got 'n.a.'
## Warning: Expecting numeric in D16445 / R16445C4: got 'n.a.'
## Warning: Expecting numeric in D16446 / R16446C4: got 'n.a.'
## Warning: Expecting numeric in D16447 / R16447C4: got 'n.a.'
## Warning: Expecting numeric in D16448 / R16448C4: got 'n.a.'
## Warning: Expecting numeric in D16449 / R16449C4: got 'n.a.'
## Warning: Expecting numeric in D16450 / R16450C4: got 'n.a.'
## Warning: Expecting numeric in D16451 / R16451C4: got 'n.a.'
## Warning: Expecting numeric in D16452 / R16452C4: got 'n.a.'
## Warning: Expecting numeric in D16453 / R16453C4: got 'n.a.'
## Warning: Expecting numeric in D16454 / R16454C4: got 'n.a.'
## Warning: Expecting numeric in D16455 / R16455C4: got 'n.a.'
## Warning: Expecting numeric in D16456 / R16456C4: got 'n.a.'
## Warning: Expecting numeric in D16457 / R16457C4: got 'n.a.'
## Warning: Expecting numeric in D16458 / R16458C4: got 'n.a.'
## Warning: Expecting numeric in D16459 / R16459C4: got 'n.a.'
## Warning: Expecting numeric in D16460 / R16460C4: got 'n.a.'
## Warning: Expecting numeric in D16461 / R16461C4: got 'n.a.'
## Warning: Expecting numeric in D16462 / R16462C4: got 'n.a.'
## Warning: Expecting numeric in D16463 / R16463C4: got 'n.a.'
## Warning: Expecting numeric in D16464 / R16464C4: got 'n.a.'
## Warning: Expecting numeric in D16465 / R16465C4: got 'n.a.'
## Warning: Expecting numeric in D16466 / R16466C4: got 'n.a.'
## Warning: Expecting numeric in D16467 / R16467C4: got 'n.a.'
## Warning: Expecting numeric in D16468 / R16468C4: got 'n.a.'
## Warning: Expecting numeric in D16469 / R16469C4: got 'n.a.'
## Warning: Expecting numeric in D16470 / R16470C4: got 'n.a.'
## Warning: Expecting numeric in D16471 / R16471C4: got 'n.a.'
## Warning: Expecting numeric in D16472 / R16472C4: got 'n.a.'
## Warning: Expecting numeric in D16473 / R16473C4: got 'n.a.'
## Warning: Expecting numeric in D16474 / R16474C4: got 'n.a.'
## Warning: Expecting numeric in D16475 / R16475C4: got 'n.a.'
## Warning: Expecting numeric in D16476 / R16476C4: got 'n.a.'
## Warning: Expecting numeric in D16477 / R16477C4: got 'n.a.'
## Warning: Expecting numeric in D16478 / R16478C4: got 'n.a.'
## Warning: Expecting numeric in D16479 / R16479C4: got 'n.a.'
## Warning: Expecting numeric in D16480 / R16480C4: got 'n.a.'
## Warning: Expecting numeric in D16481 / R16481C4: got 'n.a.'
## Warning: Expecting numeric in D16482 / R16482C4: got 'n.a.'
## Warning: Expecting numeric in D16483 / R16483C4: got 'n.a.'
## Warning: Expecting numeric in D16484 / R16484C4: got 'n.a.'
## Warning: Expecting numeric in D16485 / R16485C4: got 'n.a.'
## Warning: Expecting numeric in D16486 / R16486C4: got 'n.a.'
## Warning: Expecting numeric in D16487 / R16487C4: got 'n.a.'
## Warning: Expecting numeric in D16488 / R16488C4: got 'n.a.'
## Warning: Expecting numeric in D16489 / R16489C4: got 'n.a.'
## Warning: Expecting numeric in D16490 / R16490C4: got 'n.a.'
## Warning: Expecting numeric in D16491 / R16491C4: got 'n.a.'
## Warning: Expecting numeric in D16492 / R16492C4: got 'n.a.'
## Warning: Expecting numeric in D16493 / R16493C4: got 'n.a.'
## Warning: Expecting numeric in D16494 / R16494C4: got 'n.a.'
## Warning: Expecting numeric in D16495 / R16495C4: got 'n.a.'
## Warning: Expecting numeric in D16496 / R16496C4: got 'n.a.'
## Warning: Expecting numeric in D16497 / R16497C4: got 'n.a.'
## Warning: Expecting numeric in D16498 / R16498C4: got 'n.a.'
## Warning: Expecting numeric in D16499 / R16499C4: got 'n.a.'
## Warning: Expecting numeric in D16500 / R16500C4: got 'n.a.'
## Warning: Expecting numeric in D16501 / R16501C4: got 'n.a.'
## Warning: Expecting numeric in D16502 / R16502C4: got 'n.a.'
## Warning: Expecting numeric in D16503 / R16503C4: got 'n.a.'
## Warning: Expecting numeric in D16504 / R16504C4: got 'n.a.'
## Warning: Expecting numeric in D16505 / R16505C4: got 'n.a.'
## Warning: Expecting numeric in D16506 / R16506C4: got 'n.a.'
## Warning: Expecting numeric in D16507 / R16507C4: got 'n.a.'
## Warning: Expecting numeric in D16508 / R16508C4: got 'n.a.'
## Warning: Expecting numeric in D16509 / R16509C4: got 'n.a.'
## Warning: Expecting numeric in D16510 / R16510C4: got 'n.a.'
## Warning: Expecting numeric in D16511 / R16511C4: got 'n.a.'
## Warning: Expecting numeric in D16512 / R16512C4: got 'n.a.'
## Warning: Expecting numeric in D16513 / R16513C4: got 'n.a.'
## Warning: Expecting numeric in D16514 / R16514C4: got 'n.a.'
## Warning: Expecting numeric in D16515 / R16515C4: got 'n.a.'
## Warning: Expecting numeric in D16516 / R16516C4: got 'n.a.'
## Warning: Expecting numeric in D16517 / R16517C4: got 'n.a.'
## Warning: Expecting numeric in D16518 / R16518C4: got 'n.a.'
## Warning: Expecting numeric in D16519 / R16519C4: got 'n.a.'
## Warning: Expecting numeric in D16520 / R16520C4: got 'n.a.'
## Warning: Expecting numeric in D16521 / R16521C4: got 'n.a.'
## Warning: Expecting numeric in D16522 / R16522C4: got 'n.a.'
## Warning: Expecting numeric in D16523 / R16523C4: got 'n.a.'
## Warning: Expecting numeric in D16524 / R16524C4: got 'n.a.'
## Warning: Expecting numeric in D16525 / R16525C4: got 'n.a.'
## Warning: Expecting numeric in D16526 / R16526C4: got 'n.a.'
## Warning: Expecting numeric in D16527 / R16527C4: got 'n.a.'
## Warning: Expecting numeric in D16528 / R16528C4: got 'n.a.'
## Warning: Expecting numeric in D16529 / R16529C4: got 'n.a.'
## Warning: Expecting numeric in D16530 / R16530C4: got 'n.a.'
## Warning: Expecting numeric in D16531 / R16531C4: got 'n.a.'
## Warning: Expecting numeric in D16532 / R16532C4: got 'n.a.'
## Warning: Expecting numeric in D16533 / R16533C4: got 'n.a.'
## Warning: Expecting numeric in D16534 / R16534C4: got 'n.a.'
## Warning: Expecting numeric in D16535 / R16535C4: got 'n.a.'
## Warning: Expecting numeric in D16536 / R16536C4: got 'n.a.'
## Warning: Expecting numeric in D16537 / R16537C4: got 'n.a.'
## Warning: Expecting numeric in D16538 / R16538C4: got 'n.a.'
## Warning: Expecting numeric in D16539 / R16539C4: got 'n.a.'
## Warning: Expecting numeric in D16540 / R16540C4: got 'n.a.'
## Warning: Expecting numeric in D16541 / R16541C4: got 'n.a.'
## Warning: Expecting numeric in D16542 / R16542C4: got 'n.a.'
## Warning: Expecting numeric in D16543 / R16543C4: got 'n.a.'
## Warning: Expecting numeric in D16544 / R16544C4: got 'n.a.'
## Warning: Expecting numeric in D16545 / R16545C4: got 'n.a.'
## Warning: Expecting numeric in D16546 / R16546C4: got 'n.a.'
## Warning: Expecting numeric in D16547 / R16547C4: got 'n.a.'
## Warning: Expecting numeric in D16548 / R16548C4: got 'n.a.'
## Warning: Expecting numeric in D16549 / R16549C4: got 'n.a.'
## Warning: Expecting numeric in D16550 / R16550C4: got 'n.a.'
## Warning: Expecting numeric in D16551 / R16551C4: got 'n.a.'
## Warning: Expecting numeric in D16552 / R16552C4: got 'n.a.'
## Warning: Expecting numeric in D16553 / R16553C4: got 'n.a.'
## Warning: Expecting numeric in D16554 / R16554C4: got 'n.a.'
## Warning: Expecting numeric in D16555 / R16555C4: got 'n.a.'
## Warning: Expecting numeric in D16556 / R16556C4: got 'n.a.'
## Warning: Expecting numeric in D16557 / R16557C4: got 'n.a.'
## Warning: Expecting numeric in D16558 / R16558C4: got 'n.a.'
## Warning: Expecting numeric in D16559 / R16559C4: got 'n.a.'
## Warning: Expecting numeric in D16560 / R16560C4: got 'n.a.'
## Warning: Expecting numeric in D16561 / R16561C4: got 'n.a.'
## Warning: Expecting numeric in D16562 / R16562C4: got 'n.a.'
## Warning: Expecting numeric in D16563 / R16563C4: got 'n.a.'
## Warning: Expecting numeric in D16564 / R16564C4: got 'n.a.'
## Warning: Expecting numeric in D16565 / R16565C4: got 'n.a.'
## Warning: Expecting numeric in D16566 / R16566C4: got 'n.a.'
## Warning: Expecting numeric in D16567 / R16567C4: got 'n.a.'
## Warning: Expecting numeric in D16568 / R16568C4: got 'n.a.'
## Warning: Expecting numeric in D16569 / R16569C4: got 'n.a.'
## Warning: Expecting numeric in D16570 / R16570C4: got 'n.a.'
## Warning: Expecting numeric in D16571 / R16571C4: got 'n.a.'
## Warning: Expecting numeric in D16572 / R16572C4: got 'n.a.'
## Warning: Expecting numeric in D16573 / R16573C4: got 'n.a.'
## Warning: Expecting numeric in D16574 / R16574C4: got 'n.a.'
## Warning: Expecting numeric in D16575 / R16575C4: got 'n.a.'
## Warning: Expecting numeric in D16576 / R16576C4: got 'n.a.'
## Warning: Expecting numeric in D16577 / R16577C4: got 'n.a.'
## Warning: Expecting numeric in D16578 / R16578C4: got 'n.a.'
## Warning: Expecting numeric in D16579 / R16579C4: got 'n.a.'
## Warning: Expecting numeric in D16580 / R16580C4: got 'n.a.'
## Warning: Expecting numeric in D16581 / R16581C4: got 'n.a.'
## Warning: Expecting numeric in D16582 / R16582C4: got 'n.a.'
## Warning: Expecting numeric in D16583 / R16583C4: got 'n.a.'
## Warning: Expecting numeric in D16584 / R16584C4: got 'n.a.'
## Warning: Expecting numeric in D16585 / R16585C4: got 'n.a.'
## Warning: Expecting numeric in D16586 / R16586C4: got 'n.a.'
## Warning: Expecting numeric in D16587 / R16587C4: got 'n.a.'
## Warning: Expecting numeric in D16588 / R16588C4: got 'n.a.'
## Warning: Expecting numeric in D16589 / R16589C4: got 'n.a.'
## Warning: Expecting numeric in D16590 / R16590C4: got 'n.a.'
## Warning: Expecting numeric in D16591 / R16591C4: got 'n.a.'
## Warning: Expecting numeric in D16592 / R16592C4: got 'n.a.'
## Warning: Expecting numeric in D16593 / R16593C4: got 'n.a.'
## Warning: Expecting numeric in D16594 / R16594C4: got 'n.a.'
## Warning: Expecting numeric in D16595 / R16595C4: got 'n.a.'
## Warning: Expecting numeric in D16596 / R16596C4: got 'n.a.'
## Warning: Expecting numeric in D16597 / R16597C4: got 'n.a.'
## Warning: Expecting numeric in D16598 / R16598C4: got 'n.a.'
## Warning: Expecting numeric in D16599 / R16599C4: got 'n.a.'
## Warning: Expecting numeric in D16600 / R16600C4: got 'n.a.'
## Warning: Expecting numeric in D16601 / R16601C4: got 'n.a.'
## Warning: Expecting numeric in D16602 / R16602C4: got 'n.a.'
## Warning: Expecting numeric in D16603 / R16603C4: got 'n.a.'
## Warning: Expecting numeric in D16604 / R16604C4: got 'n.a.'
## Warning: Expecting numeric in D16605 / R16605C4: got 'n.a.'
## Warning: Expecting numeric in D16606 / R16606C4: got 'n.a.'
## Warning: Expecting numeric in D16607 / R16607C4: got 'n.a.'
## Warning: Expecting numeric in D16608 / R16608C4: got 'n.a.'
## Warning: Expecting numeric in D16609 / R16609C4: got 'n.a.'
## Warning: Expecting numeric in D16610 / R16610C4: got 'n.a.'
## Warning: Expecting numeric in D16611 / R16611C4: got 'n.a.'
## Warning: Expecting numeric in D16612 / R16612C4: got 'n.a.'
## Warning: Expecting numeric in D16613 / R16613C4: got 'n.a.'
## Warning: Expecting numeric in D16614 / R16614C4: got 'n.a.'
## Warning: Expecting numeric in D16615 / R16615C4: got 'n.a.'
## Warning: Expecting numeric in D16616 / R16616C4: got 'n.a.'
## Warning: Expecting numeric in D16617 / R16617C4: got 'n.a.'
## Warning: Expecting numeric in D16618 / R16618C4: got 'n.a.'
## Warning: Expecting numeric in D16619 / R16619C4: got 'n.a.'
## Warning: Expecting numeric in D16620 / R16620C4: got 'n.a.'
## Warning: Expecting numeric in D16621 / R16621C4: got 'n.a.'
## Warning: Expecting numeric in D16622 / R16622C4: got 'n.a.'
## Warning: Expecting numeric in D16623 / R16623C4: got 'n.a.'
## Warning: Expecting numeric in D16624 / R16624C4: got 'n.a.'
## Warning: Expecting numeric in D16625 / R16625C4: got 'n.a.'
## Warning: Expecting numeric in D16626 / R16626C4: got 'n.a.'
## Warning: Expecting numeric in D16627 / R16627C4: got 'n.a.'
## Warning: Expecting numeric in D16628 / R16628C4: got 'n.a.'
## Warning: Expecting numeric in D16629 / R16629C4: got 'n.a.'
## Warning: Expecting numeric in D16630 / R16630C4: got 'n.a.'
## Warning: Expecting numeric in D16631 / R16631C4: got 'n.a.'
## Warning: Expecting numeric in D16632 / R16632C4: got 'n.a.'
## Warning: Expecting numeric in D16633 / R16633C4: got 'n.a.'
## Warning: Expecting numeric in D16634 / R16634C4: got 'n.a.'
## Warning: Expecting numeric in D16635 / R16635C4: got 'n.a.'
## Warning: Expecting numeric in D16636 / R16636C4: got 'n.a.'
## Warning: Expecting numeric in D16637 / R16637C4: got 'n.a.'
## Warning: Expecting numeric in D16638 / R16638C4: got 'n.a.'
## Warning: Expecting numeric in D16639 / R16639C4: got 'n.a.'
## Warning: Expecting numeric in D16640 / R16640C4: got 'n.a.'
## Warning: Expecting numeric in D16641 / R16641C4: got 'n.a.'
## Warning: Expecting numeric in D16642 / R16642C4: got 'n.a.'
## Warning: Expecting numeric in D16643 / R16643C4: got 'n.a.'
## Warning: Expecting numeric in D16644 / R16644C4: got 'n.a.'
## Warning: Expecting numeric in D16645 / R16645C4: got 'n.a.'
## Warning: Expecting numeric in D16646 / R16646C4: got 'n.a.'
## Warning: Expecting numeric in D16647 / R16647C4: got 'n.a.'
## Warning: Expecting numeric in D16648 / R16648C4: got 'n.a.'
## Warning: Expecting numeric in D16649 / R16649C4: got 'n.a.'
## Warning: Expecting numeric in D16650 / R16650C4: got 'n.a.'
## Warning: Expecting numeric in D16651 / R16651C4: got 'n.a.'
## Warning: Expecting numeric in D16652 / R16652C4: got 'n.a.'
## Warning: Expecting numeric in D16653 / R16653C4: got 'n.a.'
## Warning: Expecting numeric in D16654 / R16654C4: got 'n.a.'
## Warning: Expecting numeric in D16655 / R16655C4: got 'n.a.'
## Warning: Expecting numeric in D16656 / R16656C4: got 'n.a.'
## Warning: Expecting numeric in D16657 / R16657C4: got 'n.a.'
## Warning: Expecting numeric in D16658 / R16658C4: got 'n.a.'
## Warning: Expecting numeric in D16659 / R16659C4: got 'n.a.'
## Warning: Expecting numeric in D16660 / R16660C4: got 'n.a.'
## Warning: Expecting numeric in D16661 / R16661C4: got 'n.a.'
## Warning: Expecting numeric in D16662 / R16662C4: got 'n.a.'
## Warning: Expecting numeric in D16663 / R16663C4: got 'n.a.'
## Warning: Expecting numeric in D16664 / R16664C4: got 'n.a.'
## Warning: Expecting numeric in D16665 / R16665C4: got 'n.a.'
## Warning: Expecting numeric in D16666 / R16666C4: got 'n.a.'
## Warning: Expecting numeric in D16667 / R16667C4: got 'n.a.'
## Warning: Expecting numeric in D16668 / R16668C4: got 'n.a.'
## Warning: Expecting numeric in D16669 / R16669C4: got 'n.a.'
## Warning: Expecting numeric in D16670 / R16670C4: got 'n.a.'
## Warning: Expecting numeric in D16671 / R16671C4: got 'n.a.'
## Warning: Expecting numeric in D16672 / R16672C4: got 'n.a.'
## Warning: Expecting numeric in D16673 / R16673C4: got 'n.a.'
## Warning: Expecting numeric in D16674 / R16674C4: got 'n.a.'
## Warning: Expecting numeric in D16675 / R16675C4: got 'n.a.'
## Warning: Expecting numeric in D16676 / R16676C4: got 'n.a.'
## Warning: Expecting numeric in D16677 / R16677C4: got 'n.a.'
## Warning: Expecting numeric in D16678 / R16678C4: got 'n.a.'
## Warning: Expecting numeric in D16679 / R16679C4: got 'n.a.'
## Warning: Expecting numeric in D16680 / R16680C4: got 'n.a.'
## Warning: Expecting numeric in D16681 / R16681C4: got 'n.a.'
## Warning: Expecting numeric in D16682 / R16682C4: got 'n.a.'
## Warning: Expecting numeric in D16683 / R16683C4: got 'n.a.'
## Warning: Expecting numeric in D16684 / R16684C4: got 'n.a.'
## Warning: Expecting numeric in D16685 / R16685C4: got 'n.a.'
## Warning: Expecting numeric in D16686 / R16686C4: got 'n.a.'
## Warning: Expecting numeric in D16687 / R16687C4: got 'n.a.'
## Warning: Expecting numeric in D16688 / R16688C4: got 'n.a.'
## Warning: Expecting numeric in D16689 / R16689C4: got 'n.a.'
## Warning: Expecting numeric in D16690 / R16690C4: got 'n.a.'
## Warning: Expecting numeric in D16691 / R16691C4: got 'n.a.'
## Warning: Expecting numeric in D16692 / R16692C4: got 'n.a.'
## Warning: Expecting numeric in D16693 / R16693C4: got 'n.a.'
## Warning: Expecting numeric in D16694 / R16694C4: got 'n.a.'
## Warning: Expecting numeric in D16695 / R16695C4: got 'n.a.'
## Warning: Expecting numeric in D16696 / R16696C4: got 'n.a.'
## Warning: Expecting numeric in D16697 / R16697C4: got 'n.a.'
## Warning: Expecting numeric in D16698 / R16698C4: got 'n.a.'
## Warning: Expecting numeric in D16699 / R16699C4: got 'n.a.'
## Warning: Expecting numeric in D16700 / R16700C4: got 'n.a.'
## Warning: Expecting numeric in D16701 / R16701C4: got 'n.a.'
## Warning: Expecting numeric in D16702 / R16702C4: got 'n.a.'
## Warning: Expecting numeric in D16703 / R16703C4: got 'n.a.'
## Warning: Expecting numeric in D16704 / R16704C4: got 'n.a.'
## Warning: Expecting numeric in D16705 / R16705C4: got 'n.a.'
## Warning: Expecting numeric in D16706 / R16706C4: got 'n.a.'
## Warning: Expecting numeric in D16707 / R16707C4: got 'n.a.'
## Warning: Expecting numeric in D16708 / R16708C4: got 'n.a.'
## Warning: Expecting numeric in D16709 / R16709C4: got 'n.a.'
## Warning: Expecting numeric in D16710 / R16710C4: got 'n.a.'
## Warning: Expecting numeric in D16711 / R16711C4: got 'n.a.'
## Warning: Expecting numeric in D16712 / R16712C4: got 'n.a.'
## Warning: Expecting numeric in D16713 / R16713C4: got 'n.a.'
## Warning: Expecting numeric in D16714 / R16714C4: got 'n.a.'
## Warning: Expecting numeric in D16715 / R16715C4: got 'n.a.'
## Warning: Expecting numeric in D16716 / R16716C4: got 'n.a.'
## Warning: Expecting numeric in D16717 / R16717C4: got 'n.a.'
## Warning: Expecting numeric in D16718 / R16718C4: got 'n.a.'
## Warning: Expecting numeric in D16719 / R16719C4: got 'n.a.'
## Warning: Expecting numeric in D16720 / R16720C4: got 'n.a.'
## Warning: Expecting numeric in D16721 / R16721C4: got 'n.a.'
## Warning: Expecting numeric in D16722 / R16722C4: got 'n.a.'
## Warning: Expecting numeric in D16723 / R16723C4: got 'n.a.'
## Warning: Expecting numeric in D16724 / R16724C4: got 'n.a.'
## Warning: Expecting numeric in D16725 / R16725C4: got 'n.a.'
## Warning: Expecting numeric in D16726 / R16726C4: got 'n.a.'
## Warning: Expecting numeric in D16727 / R16727C4: got 'n.a.'
## Warning: Expecting numeric in D16728 / R16728C4: got 'n.a.'
## Warning: Expecting numeric in D16729 / R16729C4: got 'n.a.'
## Warning: Expecting numeric in D16730 / R16730C4: got 'n.a.'
## Warning: Expecting numeric in D16731 / R16731C4: got 'n.a.'
## Warning: Expecting numeric in D16732 / R16732C4: got 'n.a.'
## Warning: Expecting numeric in D16733 / R16733C4: got 'n.a.'
## Warning: Expecting numeric in D16734 / R16734C4: got 'n.a.'
## Warning: Expecting numeric in D16735 / R16735C4: got 'n.a.'
## Warning: Expecting numeric in D16736 / R16736C4: got 'n.a.'
## Warning: Expecting numeric in D16737 / R16737C4: got 'n.a.'
## Warning: Expecting numeric in D16738 / R16738C4: got 'n.a.'
## Warning: Expecting numeric in D16739 / R16739C4: got 'n.a.'
## Warning: Expecting numeric in D16740 / R16740C4: got 'n.a.'
## Warning: Expecting numeric in D16741 / R16741C4: got 'n.a.'
## Warning: Expecting numeric in D16742 / R16742C4: got 'n.a.'
## Warning: Expecting numeric in D16743 / R16743C4: got 'n.a.'
## Warning: Expecting numeric in D16744 / R16744C4: got 'n.a.'
## Warning: Expecting numeric in D16745 / R16745C4: got 'n.a.'
## Warning: Expecting numeric in D16746 / R16746C4: got 'n.a.'
## Warning: Expecting numeric in D16747 / R16747C4: got 'n.a.'
## Warning: Expecting numeric in D16748 / R16748C4: got 'n.a.'
## Warning: Expecting numeric in D16749 / R16749C4: got 'n.a.'
## Warning: Expecting numeric in D16750 / R16750C4: got 'n.a.'
## Warning: Expecting numeric in D16751 / R16751C4: got 'n.a.'
## Warning: Expecting numeric in D16752 / R16752C4: got 'n.a.'
## Warning: Expecting numeric in D16753 / R16753C4: got 'n.a.'
## Warning: Expecting numeric in D16754 / R16754C4: got 'n.a.'
## Warning: Expecting numeric in D16755 / R16755C4: got 'n.a.'
## Warning: Expecting numeric in D16756 / R16756C4: got 'n.a.'
## Warning: Expecting numeric in D16757 / R16757C4: got 'n.a.'
## Warning: Expecting numeric in D16758 / R16758C4: got 'n.a.'
## Warning: Expecting numeric in D16759 / R16759C4: got 'n.a.'
## Warning: Expecting numeric in D16760 / R16760C4: got 'n.a.'
## Warning: Expecting numeric in D16761 / R16761C4: got 'n.a.'
## Warning: Expecting numeric in D16762 / R16762C4: got 'n.a.'
## Warning: Expecting numeric in D16763 / R16763C4: got 'n.a.'
## Warning: Expecting numeric in D16764 / R16764C4: got 'n.a.'
## Warning: Expecting numeric in D16765 / R16765C4: got 'n.a.'
## Warning: Expecting numeric in D16766 / R16766C4: got 'n.a.'
## Warning: Expecting numeric in D16767 / R16767C4: got 'n.a.'
## Warning: Expecting numeric in D16768 / R16768C4: got 'n.a.'
## Warning: Expecting numeric in D16769 / R16769C4: got 'n.a.'
## Warning: Expecting numeric in D16770 / R16770C4: got 'n.a.'
## Warning: Expecting numeric in D16771 / R16771C4: got 'n.a.'
## Warning: Expecting numeric in D16772 / R16772C4: got 'n.a.'
## Warning: Expecting numeric in D16773 / R16773C4: got 'n.a.'
## Warning: Expecting numeric in D16774 / R16774C4: got 'n.a.'
## Warning: Expecting numeric in D16775 / R16775C4: got 'n.a.'
## Warning: Expecting numeric in D16776 / R16776C4: got 'n.a.'
## Warning: Expecting numeric in D16777 / R16777C4: got 'n.a.'
## Warning: Expecting numeric in D16778 / R16778C4: got 'n.a.'
## Warning: Expecting numeric in D16779 / R16779C4: got 'n.a.'
## Warning: Expecting numeric in D16780 / R16780C4: got 'n.a.'
## Warning: Expecting numeric in D16781 / R16781C4: got 'n.a.'
## Warning: Expecting numeric in D16782 / R16782C4: got 'n.a.'
## Warning: Expecting numeric in D16783 / R16783C4: got 'n.a.'
## Warning: Expecting numeric in D16784 / R16784C4: got 'n.a.'
## Warning: Expecting numeric in D16785 / R16785C4: got 'n.a.'
## Warning: Expecting numeric in D16786 / R16786C4: got 'n.a.'
## Warning: Expecting numeric in D16787 / R16787C4: got 'n.a.'
## Warning: Expecting numeric in D16788 / R16788C4: got 'n.a.'
## Warning: Expecting numeric in D16789 / R16789C4: got 'n.a.'
## Warning: Expecting numeric in D16790 / R16790C4: got 'n.a.'
## Warning: Expecting numeric in D16791 / R16791C4: got 'n.a.'
## Warning: Expecting numeric in D16792 / R16792C4: got 'n.a.'
## Warning: Expecting numeric in D16793 / R16793C4: got 'n.a.'
## Warning: Expecting numeric in D16794 / R16794C4: got 'n.a.'
## Warning: Expecting numeric in D16795 / R16795C4: got 'n.a.'
## Warning: Expecting numeric in D16796 / R16796C4: got 'n.a.'
## Warning: Expecting numeric in D16797 / R16797C4: got 'n.a.'
## Warning: Expecting numeric in D16798 / R16798C4: got 'n.a.'
## Warning: Expecting numeric in D16799 / R16799C4: got 'n.a.'
## Warning: Expecting numeric in D16800 / R16800C4: got 'n.a.'
## Warning: Expecting numeric in D16801 / R16801C4: got 'n.a.'
## Warning: Expecting numeric in D16802 / R16802C4: got 'n.a.'
## Warning: Expecting numeric in D16803 / R16803C4: got 'n.a.'
## Warning: Expecting numeric in D16804 / R16804C4: got 'n.a.'
## Warning: Expecting numeric in D16805 / R16805C4: got 'n.a.'
## Warning: Expecting numeric in D16806 / R16806C4: got 'n.a.'
## Warning: Expecting numeric in D16807 / R16807C4: got 'n.a.'
## Warning: Expecting numeric in D16808 / R16808C4: got 'n.a.'
## Warning: Expecting numeric in D16809 / R16809C4: got 'n.a.'
## Warning: Expecting numeric in D16810 / R16810C4: got 'n.a.'
## Warning: Expecting numeric in D16811 / R16811C4: got 'n.a.'
## Warning: Expecting numeric in D16812 / R16812C4: got 'n.a.'
## Warning: Expecting numeric in D16813 / R16813C4: got 'n.a.'
## Warning: Expecting numeric in D16814 / R16814C4: got 'n.a.'
## Warning: Expecting numeric in D16815 / R16815C4: got 'n.a.'
## Warning: Expecting numeric in D16816 / R16816C4: got 'n.a.'
## Warning: Expecting numeric in D16817 / R16817C4: got 'n.a.'
## Warning: Expecting numeric in D16818 / R16818C4: got 'n.a.'
## Warning: Expecting numeric in D16819 / R16819C4: got 'n.a.'
## Warning: Expecting numeric in D16820 / R16820C4: got 'n.a.'
## Warning: Expecting numeric in D16821 / R16821C4: got 'n.a.'
## Warning: Expecting numeric in D16822 / R16822C4: got 'n.a.'
## Warning: Expecting numeric in D16823 / R16823C4: got 'n.a.'
## Warning: Expecting numeric in D16824 / R16824C4: got 'n.a.'
## Warning: Expecting numeric in D16825 / R16825C4: got 'n.a.'
## Warning: Expecting numeric in D16826 / R16826C4: got 'n.a.'
## Warning: Expecting numeric in D16827 / R16827C4: got 'n.a.'
## Warning: Expecting numeric in D16828 / R16828C4: got 'n.a.'
## Warning: Expecting numeric in D16829 / R16829C4: got 'n.a.'
## Warning: Expecting numeric in D16830 / R16830C4: got 'n.a.'
## Warning: Expecting numeric in D16831 / R16831C4: got 'n.a.'
## Warning: Expecting numeric in D16832 / R16832C4: got 'n.a.'
## Warning: Expecting numeric in D16833 / R16833C4: got 'n.a.'
## Warning: Expecting numeric in D16834 / R16834C4: got 'n.a.'
## Warning: Expecting numeric in D16835 / R16835C4: got 'n.a.'
## Warning: Expecting numeric in D16836 / R16836C4: got 'n.a.'
## Warning: Expecting numeric in D16837 / R16837C4: got 'n.a.'
## Warning: Expecting numeric in D16838 / R16838C4: got 'n.a.'
## Warning: Expecting numeric in D16839 / R16839C4: got 'n.a.'
## Warning: Expecting numeric in D16840 / R16840C4: got 'n.a.'
## Warning: Expecting numeric in D16841 / R16841C4: got 'n.a.'
## Warning: Expecting numeric in D16842 / R16842C4: got 'n.a.'
## Warning: Expecting numeric in D16843 / R16843C4: got 'n.a.'
## Warning: Expecting numeric in D16844 / R16844C4: got 'n.a.'
## Warning: Expecting numeric in D16845 / R16845C4: got 'n.a.'
## Warning: Expecting numeric in D16846 / R16846C4: got 'n.a.'
## Warning: Expecting numeric in D16847 / R16847C4: got 'n.a.'
## Warning: Expecting numeric in D16848 / R16848C4: got 'n.a.'
## Warning: Expecting numeric in D16849 / R16849C4: got 'n.a.'
## Warning: Expecting numeric in D16850 / R16850C4: got 'n.a.'
## Warning: Expecting numeric in D16851 / R16851C4: got 'n.a.'
## Warning: Expecting numeric in D16852 / R16852C4: got 'n.a.'
## Warning: Expecting numeric in D16853 / R16853C4: got 'n.a.'
## Warning: Expecting numeric in D16854 / R16854C4: got 'n.a.'
## Warning: Expecting numeric in D16855 / R16855C4: got 'n.a.'
## Warning: Expecting numeric in D16856 / R16856C4: got 'n.a.'
## Warning: Expecting numeric in D16857 / R16857C4: got 'n.a.'
## Warning: Expecting numeric in D16858 / R16858C4: got 'n.a.'
## Warning: Expecting numeric in D16859 / R16859C4: got 'n.a.'
## Warning: Expecting numeric in D16860 / R16860C4: got 'n.a.'
## Warning: Expecting numeric in D16861 / R16861C4: got 'n.a.'
## Warning: Expecting numeric in D16862 / R16862C4: got 'n.a.'
## Warning: Expecting numeric in D16863 / R16863C4: got 'n.a.'
## Warning: Expecting numeric in D16864 / R16864C4: got 'n.a.'
## Warning: Expecting numeric in D16865 / R16865C4: got 'n.a.'
## Warning: Expecting numeric in D16866 / R16866C4: got 'n.a.'
## Warning: Expecting numeric in D16867 / R16867C4: got 'n.a.'
## Warning: Expecting numeric in D16868 / R16868C4: got 'n.a.'
## Warning: Expecting numeric in D16869 / R16869C4: got 'n.a.'
## Warning: Expecting numeric in D16870 / R16870C4: got 'n.a.'
## Warning: Expecting numeric in D16871 / R16871C4: got 'n.a.'
## Warning: Expecting numeric in D16872 / R16872C4: got 'n.a.'
## Warning: Expecting numeric in D16873 / R16873C4: got 'n.a.'
## Warning: Expecting numeric in D16874 / R16874C4: got 'n.a.'
## Warning: Expecting numeric in D16875 / R16875C4: got 'n.a.'
## Warning: Expecting numeric in D16876 / R16876C4: got 'n.a.'
## Warning: Expecting numeric in D16877 / R16877C4: got 'n.a.'
## Warning: Expecting numeric in D16878 / R16878C4: got 'n.a.'
## Warning: Expecting numeric in D16879 / R16879C4: got 'n.a.'
## Warning: Expecting numeric in D16880 / R16880C4: got 'n.a.'
## Warning: Expecting numeric in D16881 / R16881C4: got 'n.a.'
## Warning: Expecting numeric in D16882 / R16882C4: got 'n.a.'
## Warning: Expecting numeric in D16883 / R16883C4: got 'n.a.'
## Warning: Expecting numeric in D16884 / R16884C4: got 'n.a.'
## Warning: Expecting numeric in D16885 / R16885C4: got 'n.a.'
## Warning: Expecting numeric in D16886 / R16886C4: got 'n.a.'
## Warning: Expecting numeric in D16887 / R16887C4: got 'n.a.'
## Warning: Expecting numeric in D16888 / R16888C4: got 'n.a.'
## Warning: Expecting numeric in D16889 / R16889C4: got 'n.a.'
## Warning: Expecting numeric in D16890 / R16890C4: got 'n.a.'
## Warning: Expecting numeric in D16891 / R16891C4: got 'n.a.'
## Warning: Expecting numeric in D16892 / R16892C4: got 'n.a.'
## Warning: Expecting numeric in D16893 / R16893C4: got 'n.a.'
## Warning: Expecting numeric in D16894 / R16894C4: got 'n.a.'
## Warning: Expecting numeric in D16895 / R16895C4: got 'n.a.'
## Warning: Expecting numeric in D16896 / R16896C4: got 'n.a.'
## Warning: Expecting numeric in D16897 / R16897C4: got 'n.a.'
## Warning: Expecting numeric in D16898 / R16898C4: got 'n.a.'
## Warning: Expecting numeric in D16899 / R16899C4: got 'n.a.'
## Warning: Expecting numeric in D16900 / R16900C4: got 'n.a.'
## Warning: Expecting numeric in D16901 / R16901C4: got 'n.a.'
## Warning: Expecting numeric in D16902 / R16902C4: got 'n.a.'
## Warning: Expecting numeric in D16903 / R16903C4: got 'n.a.'
## Warning: Expecting numeric in D16904 / R16904C4: got 'n.a.'
## Warning: Expecting numeric in D16905 / R16905C4: got 'n.a.'
## Warning: Expecting numeric in D16906 / R16906C4: got 'n.a.'
## Warning: Expecting numeric in D16907 / R16907C4: got 'n.a.'
## Warning: Expecting numeric in D16908 / R16908C4: got 'n.a.'
## Warning: Expecting numeric in D16909 / R16909C4: got 'n.a.'
## Warning: Expecting numeric in D16910 / R16910C4: got 'n.a.'
## Warning: Expecting numeric in D16911 / R16911C4: got 'n.a.'
## Warning: Expecting numeric in D16912 / R16912C4: got 'n.a.'
## Warning: Expecting numeric in D16913 / R16913C4: got 'n.a.'
## Warning: Expecting numeric in D16914 / R16914C4: got 'n.a.'
## Warning: Expecting numeric in D16915 / R16915C4: got 'n.a.'
## Warning: Expecting numeric in D16916 / R16916C4: got 'n.a.'
## Warning: Expecting numeric in D16917 / R16917C4: got 'n.a.'
## Warning: Expecting numeric in D16918 / R16918C4: got 'n.a.'
## Warning: Expecting numeric in D16919 / R16919C4: got 'n.a.'
## Warning: Expecting numeric in D16920 / R16920C4: got 'n.a.'
## Warning: Expecting numeric in D16921 / R16921C4: got 'n.a.'
## Warning: Expecting numeric in D16922 / R16922C4: got 'n.a.'
## Warning: Expecting numeric in D16923 / R16923C4: got 'n.a.'
## Warning: Expecting numeric in D16924 / R16924C4: got 'n.a.'
## Warning: Expecting numeric in D16925 / R16925C4: got 'n.a.'
## Warning: Expecting numeric in D16926 / R16926C4: got 'n.a.'
## Warning: Expecting numeric in D16927 / R16927C4: got 'n.a.'
## Warning: Expecting numeric in D16928 / R16928C4: got 'n.a.'
## Warning: Expecting numeric in D16929 / R16929C4: got 'n.a.'
## Warning: Expecting numeric in D16930 / R16930C4: got 'n.a.'
## Warning: Expecting numeric in D16931 / R16931C4: got 'n.a.'
## Warning: Expecting numeric in D16932 / R16932C4: got 'n.a.'
## Warning: Expecting numeric in D16933 / R16933C4: got 'n.a.'
## Warning: Expecting numeric in D16934 / R16934C4: got 'n.a.'
## Warning: Expecting numeric in D16935 / R16935C4: got 'n.a.'
## Warning: Expecting numeric in D16936 / R16936C4: got 'n.a.'
## Warning: Expecting numeric in D16937 / R16937C4: got 'n.a.'
## Warning: Expecting numeric in D16938 / R16938C4: got 'n.a.'
## Warning: Expecting numeric in D16939 / R16939C4: got 'n.a.'
## Warning: Expecting numeric in D16940 / R16940C4: got 'n.a.'
## Warning: Expecting numeric in D16941 / R16941C4: got 'n.a.'
## Warning: Expecting numeric in D16942 / R16942C4: got 'n.a.'
## Warning: Expecting numeric in D16943 / R16943C4: got 'n.a.'
## Warning: Expecting numeric in D16944 / R16944C4: got 'n.a.'
## Warning: Expecting numeric in D16945 / R16945C4: got 'n.a.'
## Warning: Expecting numeric in D16946 / R16946C4: got 'n.a.'
## Warning: Expecting numeric in D16947 / R16947C4: got 'n.a.'
## Warning: Expecting numeric in D16948 / R16948C4: got 'n.a.'
## Warning: Expecting numeric in D16949 / R16949C4: got 'n.a.'
## Warning: Expecting numeric in D16950 / R16950C4: got 'n.a.'
## Warning: Expecting numeric in D16951 / R16951C4: got 'n.a.'
## Warning: Expecting numeric in D16952 / R16952C4: got 'n.a.'
## Warning: Expecting numeric in D16953 / R16953C4: got 'n.a.'
## Warning: Expecting numeric in D16954 / R16954C4: got 'n.a.'
## Warning: Expecting numeric in D16955 / R16955C4: got 'n.a.'
## Warning: Expecting numeric in D16956 / R16956C4: got 'n.a.'
## Warning: Expecting numeric in D16957 / R16957C4: got 'n.a.'
## Warning: Expecting numeric in D16958 / R16958C4: got 'n.a.'
## Warning: Expecting numeric in D16959 / R16959C4: got 'n.a.'
## Warning: Expecting numeric in D16960 / R16960C4: got 'n.a.'
## Warning: Expecting numeric in D16961 / R16961C4: got 'n.a.'
## Warning: Expecting numeric in D16962 / R16962C4: got 'n.a.'
## Warning: Expecting numeric in D16963 / R16963C4: got 'n.a.'
## Warning: Expecting numeric in D16964 / R16964C4: got 'n.a.'
## Warning: Expecting numeric in D16965 / R16965C4: got 'n.a.'
## Warning: Expecting numeric in D16966 / R16966C4: got 'n.a.'
## Warning: Expecting numeric in D16967 / R16967C4: got 'n.a.'
## Warning: Expecting numeric in D16968 / R16968C4: got 'n.a.'
## Warning: Expecting numeric in D16969 / R16969C4: got 'n.a.'
## Warning: Expecting numeric in D16970 / R16970C4: got 'n.a.'
## Warning: Expecting numeric in D16971 / R16971C4: got 'n.a.'
## Warning: Expecting numeric in D16972 / R16972C4: got 'n.a.'
## Warning: Expecting numeric in D16973 / R16973C4: got 'n.a.'
## Warning: Expecting numeric in D16974 / R16974C4: got 'n.a.'
## Warning: Expecting numeric in D16975 / R16975C4: got 'n.a.'
## Warning: Expecting numeric in D16976 / R16976C4: got 'n.a.'
## Warning: Expecting numeric in D16977 / R16977C4: got 'n.a.'
## Warning: Expecting numeric in D16978 / R16978C4: got 'n.a.'
## Warning: Expecting numeric in D16979 / R16979C4: got 'n.a.'
## Warning: Expecting numeric in D16980 / R16980C4: got 'n.a.'
## Warning: Expecting numeric in D16981 / R16981C4: got 'n.a.'
## Warning: Expecting numeric in D16982 / R16982C4: got 'n.a.'
## Warning: Expecting numeric in D16983 / R16983C4: got 'n.a.'
## Warning: Expecting numeric in D16984 / R16984C4: got 'n.a.'
## Warning: Expecting numeric in D16985 / R16985C4: got 'n.a.'
## Warning: Expecting numeric in D16986 / R16986C4: got 'n.a.'
## Warning: Expecting numeric in D16987 / R16987C4: got 'n.a.'
## Warning: Expecting numeric in D16988 / R16988C4: got 'n.a.'
## Warning: Expecting numeric in D16989 / R16989C4: got 'n.a.'
## Warning: Expecting numeric in D16990 / R16990C4: got 'n.a.'
## Warning: Expecting numeric in D16991 / R16991C4: got 'n.a.'
## Warning: Expecting numeric in D16992 / R16992C4: got 'n.a.'
## Warning: Expecting numeric in D16993 / R16993C4: got 'n.a.'
## Warning: Expecting numeric in D16994 / R16994C4: got 'n.a.'
## Warning: Expecting numeric in D16995 / R16995C4: got 'n.a.'
## Warning: Expecting numeric in D16996 / R16996C4: got 'n.a.'
## Warning: Expecting numeric in D16997 / R16997C4: got 'n.a.'
## Warning: Expecting numeric in D16998 / R16998C4: got 'n.a.'
## Warning: Expecting numeric in D16999 / R16999C4: got 'n.a.'
## Warning: Expecting numeric in D17000 / R17000C4: got 'n.a.'
## Warning: Expecting numeric in D17001 / R17001C4: got 'n.a.'
## Warning: Expecting numeric in D17002 / R17002C4: got 'n.a.'
## Warning: Expecting numeric in D17003 / R17003C4: got 'n.a.'
## Warning: Expecting numeric in D17004 / R17004C4: got 'n.a.'
## Warning: Expecting numeric in D17005 / R17005C4: got 'n.a.'
## Warning: Expecting numeric in D17006 / R17006C4: got 'n.a.'
## Warning: Expecting numeric in D17007 / R17007C4: got 'n.a.'
## Warning: Expecting numeric in D17008 / R17008C4: got 'n.a.'
## Warning: Expecting numeric in D17009 / R17009C4: got 'n.a.'
## Warning: Expecting numeric in D17010 / R17010C4: got 'n.a.'
## Warning: Expecting numeric in D17011 / R17011C4: got 'n.a.'
## Warning: Expecting numeric in D17012 / R17012C4: got 'n.a.'
## Warning: Expecting numeric in D17013 / R17013C4: got 'n.a.'
## Warning: Expecting numeric in D17014 / R17014C4: got 'n.a.'
## Warning: Expecting numeric in D17015 / R17015C4: got 'n.a.'
## Warning: Expecting numeric in D17016 / R17016C4: got 'n.a.'
## Warning: Expecting numeric in D17017 / R17017C4: got 'n.a.'
## Warning: Expecting numeric in D17018 / R17018C4: got 'n.a.'
## Warning: Expecting numeric in D17019 / R17019C4: got 'n.a.'
## Warning: Expecting numeric in D17020 / R17020C4: got 'n.a.'
## Warning: Expecting numeric in D17021 / R17021C4: got 'n.a.'
## Warning: Expecting numeric in D17022 / R17022C4: got 'n.a.'
## Warning: Expecting numeric in D17023 / R17023C4: got 'n.a.'
## Warning: Expecting numeric in D17024 / R17024C4: got 'n.a.'
## Warning: Expecting numeric in D17025 / R17025C4: got 'n.a.'
## Warning: Expecting numeric in D17026 / R17026C4: got 'n.a.'
## Warning: Expecting numeric in D17027 / R17027C4: got 'n.a.'
## Warning: Expecting numeric in D17028 / R17028C4: got 'n.a.'
## Warning: Expecting numeric in D17029 / R17029C4: got 'n.a.'
## Warning: Expecting numeric in D17030 / R17030C4: got 'n.a.'
## Warning: Expecting numeric in D17031 / R17031C4: got 'n.a.'
## Warning: Expecting numeric in D17032 / R17032C4: got 'n.a.'
## Warning: Expecting numeric in D17033 / R17033C4: got 'n.a.'
## Warning: Expecting numeric in D17034 / R17034C4: got 'n.a.'
## Warning: Expecting numeric in D17035 / R17035C4: got 'n.a.'
## Warning: Expecting numeric in D17036 / R17036C4: got 'n.a.'
## Warning: Expecting numeric in D17037 / R17037C4: got 'n.a.'
## Warning: Expecting numeric in D17038 / R17038C4: got 'n.a.'
## Warning: Expecting numeric in D17039 / R17039C4: got 'n.a.'
## Warning: Expecting numeric in D17040 / R17040C4: got 'n.a.'
## Warning: Expecting numeric in D17041 / R17041C4: got 'n.a.'
## Warning: Expecting numeric in D17042 / R17042C4: got 'n.a.'
## Warning: Expecting numeric in D17043 / R17043C4: got 'n.a.'
## Warning: Expecting numeric in D17044 / R17044C4: got 'n.a.'
## Warning: Expecting numeric in D17045 / R17045C4: got 'n.a.'
## Warning: Expecting numeric in D17046 / R17046C4: got 'n.a.'
## Warning: Expecting numeric in D17047 / R17047C4: got 'n.a.'
## Warning: Expecting numeric in D17048 / R17048C4: got 'n.a.'
## Warning: Expecting numeric in D17049 / R17049C4: got 'n.a.'
## Warning: Expecting numeric in D17050 / R17050C4: got 'n.a.'
## Warning: Expecting numeric in D17051 / R17051C4: got 'n.a.'
## Warning: Expecting numeric in D17052 / R17052C4: got 'n.a.'
## Warning: Expecting numeric in D17053 / R17053C4: got 'n.a.'
## Warning: Expecting numeric in D17054 / R17054C4: got 'n.a.'
## Warning: Expecting numeric in D17055 / R17055C4: got 'n.a.'
## Warning: Expecting numeric in D17056 / R17056C4: got 'n.a.'
## Warning: Expecting numeric in D17057 / R17057C4: got 'n.a.'
## Warning: Expecting numeric in D17058 / R17058C4: got 'n.a.'
## Warning: Expecting numeric in D17059 / R17059C4: got 'n.a.'
## Warning: Expecting numeric in D17060 / R17060C4: got 'n.a.'
## Warning: Expecting numeric in D17061 / R17061C4: got 'n.a.'
## Warning: Expecting numeric in D17062 / R17062C4: got 'n.a.'
## Warning: Expecting numeric in D17063 / R17063C4: got 'n.a.'
## Warning: Expecting numeric in D17064 / R17064C4: got 'n.a.'
## Warning: Expecting numeric in D17065 / R17065C4: got 'n.a.'
## Warning: Expecting numeric in D17066 / R17066C4: got 'n.a.'
## Warning: Expecting numeric in D17067 / R17067C4: got 'n.a.'
## Warning: Expecting numeric in D17068 / R17068C4: got 'n.a.'
## Warning: Expecting numeric in D17069 / R17069C4: got 'n.a.'
## Warning: Expecting numeric in D17070 / R17070C4: got 'n.a.'
## Warning: Expecting numeric in D17071 / R17071C4: got 'n.a.'
## Warning: Expecting numeric in D17072 / R17072C4: got 'n.a.'
## Warning: Expecting numeric in D17073 / R17073C4: got 'n.a.'
## Warning: Expecting numeric in D17074 / R17074C4: got 'n.a.'
## Warning: Expecting numeric in D17075 / R17075C4: got 'n.a.'
## Warning: Expecting numeric in D17076 / R17076C4: got 'n.a.'
## Warning: Expecting numeric in D17077 / R17077C4: got 'n.a.'
## Warning: Expecting numeric in D17078 / R17078C4: got 'n.a.'
## Warning: Expecting numeric in D17079 / R17079C4: got 'n.a.'
## Warning: Expecting numeric in D17080 / R17080C4: got 'n.a.'
## Warning: Expecting numeric in D17081 / R17081C4: got 'n.a.'
## Warning: Expecting numeric in D17082 / R17082C4: got 'n.a.'
## Warning: Expecting numeric in D17083 / R17083C4: got 'n.a.'
## Warning: Expecting numeric in D17084 / R17084C4: got 'n.a.'
## Warning: Expecting numeric in D17085 / R17085C4: got 'n.a.'
## Warning: Expecting numeric in D17086 / R17086C4: got 'n.a.'
## Warning: Expecting numeric in D17087 / R17087C4: got 'n.a.'
## Warning: Expecting numeric in D17088 / R17088C4: got 'n.a.'
## Warning: Expecting numeric in D17089 / R17089C4: got 'n.a.'
## Warning: Expecting numeric in D17090 / R17090C4: got 'n.a.'
## Warning: Expecting numeric in D17091 / R17091C4: got 'n.a.'
## Warning: Expecting numeric in D17092 / R17092C4: got 'n.a.'
## Warning: Expecting numeric in D17093 / R17093C4: got 'n.a.'
## Warning: Expecting numeric in D17094 / R17094C4: got 'n.a.'
## Warning: Expecting numeric in D17095 / R17095C4: got 'n.a.'
## Warning: Expecting numeric in D17096 / R17096C4: got 'n.a.'
## Warning: Expecting numeric in D17097 / R17097C4: got 'n.a.'
## Warning: Expecting numeric in D17098 / R17098C4: got 'n.a.'
## Warning: Expecting numeric in D17099 / R17099C4: got 'n.a.'
## Warning: Expecting numeric in D17100 / R17100C4: got 'n.a.'
## Warning: Expecting numeric in D17101 / R17101C4: got 'n.a.'
## Warning: Expecting numeric in D17102 / R17102C4: got 'n.a.'
## Warning: Expecting numeric in D17103 / R17103C4: got 'n.a.'
## Warning: Expecting numeric in D17104 / R17104C4: got 'n.a.'
## Warning: Expecting numeric in D17105 / R17105C4: got 'n.a.'
## Warning: Expecting numeric in D17106 / R17106C4: got 'n.a.'
## Warning: Expecting numeric in D17107 / R17107C4: got 'n.a.'
## Warning: Expecting numeric in D17108 / R17108C4: got 'n.a.'
## Warning: Expecting numeric in D17109 / R17109C4: got 'n.a.'
## Warning: Expecting numeric in D17110 / R17110C4: got 'n.a.'
## Warning: Expecting numeric in D17111 / R17111C4: got 'n.a.'
## Warning: Expecting numeric in D17112 / R17112C4: got 'n.a.'
## Warning: Expecting numeric in D17113 / R17113C4: got 'n.a.'
## Warning: Expecting numeric in D17114 / R17114C4: got 'n.a.'
## Warning: Expecting numeric in D17115 / R17115C4: got 'n.a.'
## Warning: Expecting numeric in D17116 / R17116C4: got 'n.a.'
## Warning: Expecting numeric in D17117 / R17117C4: got 'n.a.'
## Warning: Expecting numeric in D17118 / R17118C4: got 'n.a.'
## Warning: Expecting numeric in D17119 / R17119C4: got 'n.a.'
## Warning: Expecting numeric in D17120 / R17120C4: got 'n.a.'
## Warning: Expecting numeric in D17121 / R17121C4: got 'n.a.'
## Warning: Expecting numeric in D17122 / R17122C4: got 'n.a.'
## Warning: Expecting numeric in D17123 / R17123C4: got 'n.a.'
## Warning: Expecting numeric in D17124 / R17124C4: got 'n.a.'
## Warning: Expecting numeric in D17125 / R17125C4: got 'n.a.'
## Warning: Expecting numeric in D17126 / R17126C4: got 'n.a.'
## Warning: Expecting numeric in D17127 / R17127C4: got 'n.a.'
## Warning: Expecting numeric in D17128 / R17128C4: got 'n.a.'
## Warning: Expecting numeric in D17129 / R17129C4: got 'n.a.'
## Warning: Expecting numeric in D17130 / R17130C4: got 'n.a.'
## Warning: Expecting numeric in D17131 / R17131C4: got 'n.a.'
## Warning: Expecting numeric in D17132 / R17132C4: got 'n.a.'
## Warning: Expecting numeric in D17133 / R17133C4: got 'n.a.'
## Warning: Expecting numeric in D17134 / R17134C4: got 'n.a.'
## Warning: Expecting numeric in D17135 / R17135C4: got 'n.a.'
## Warning: Expecting numeric in D17136 / R17136C4: got 'n.a.'
## Warning: Expecting numeric in D17137 / R17137C4: got 'n.a.'
## Warning: Expecting numeric in D17138 / R17138C4: got 'n.a.'
## Warning: Expecting numeric in D17139 / R17139C4: got 'n.a.'
## Warning: Expecting numeric in D17140 / R17140C4: got 'n.a.'
## Warning: Expecting numeric in D17141 / R17141C4: got 'n.a.'
## Warning: Expecting numeric in D17142 / R17142C4: got 'n.a.'
## Warning: Expecting numeric in D17143 / R17143C4: got 'n.a.'
## Warning: Expecting numeric in D17144 / R17144C4: got 'n.a.'
## Warning: Expecting numeric in D17145 / R17145C4: got 'n.a.'
## Warning: Expecting numeric in D17146 / R17146C4: got 'n.a.'
## Warning: Expecting numeric in D17147 / R17147C4: got 'n.a.'
## Warning: Expecting numeric in D17148 / R17148C4: got 'n.a.'
## Warning: Expecting numeric in D17149 / R17149C4: got 'n.a.'
## Warning: Expecting numeric in D17150 / R17150C4: got 'n.a.'
## Warning: Expecting numeric in D17151 / R17151C4: got 'n.a.'
## Warning: Expecting numeric in D17152 / R17152C4: got 'n.a.'
## Warning: Expecting numeric in D17153 / R17153C4: got 'n.a.'
## Warning: Expecting numeric in D17154 / R17154C4: got 'n.a.'
## Warning: Expecting numeric in D17155 / R17155C4: got 'n.a.'
## Warning: Expecting numeric in D17156 / R17156C4: got 'n.a.'
## Warning: Expecting numeric in D17157 / R17157C4: got 'n.a.'
## Warning: Expecting numeric in D17158 / R17158C4: got 'n.a.'
## Warning: Expecting numeric in D17159 / R17159C4: got 'n.a.'
## Warning: Expecting numeric in D17160 / R17160C4: got 'n.a.'
## Warning: Expecting numeric in D17161 / R17161C4: got 'n.a.'
## Warning: Expecting numeric in D17162 / R17162C4: got 'n.a.'
## Warning: Expecting numeric in D17163 / R17163C4: got 'n.a.'
## Warning: Expecting numeric in D17164 / R17164C4: got 'n.a.'
## Warning: Expecting numeric in D17165 / R17165C4: got 'n.a.'
## Warning: Expecting numeric in D17166 / R17166C4: got 'n.a.'
## Warning: Expecting numeric in D17167 / R17167C4: got 'n.a.'
## Warning: Expecting numeric in D17168 / R17168C4: got 'n.a.'
## Warning: Expecting numeric in D17169 / R17169C4: got 'n.a.'
## Warning: Expecting numeric in D17170 / R17170C4: got 'n.a.'
## Warning: Expecting numeric in D17171 / R17171C4: got 'n.a.'
## Warning: Expecting numeric in D17172 / R17172C4: got 'n.a.'
## Warning: Expecting numeric in D17173 / R17173C4: got 'n.a.'
## Warning: Expecting numeric in D17174 / R17174C4: got 'n.a.'
## Warning: Expecting numeric in D17175 / R17175C4: got 'n.a.'
## Warning: Expecting numeric in D17176 / R17176C4: got 'n.a.'
## Warning: Expecting numeric in D17177 / R17177C4: got 'n.a.'
## Warning: Expecting numeric in D17178 / R17178C4: got 'n.a.'
## Warning: Expecting numeric in D17179 / R17179C4: got 'n.a.'
## Warning: Expecting numeric in D17180 / R17180C4: got 'n.a.'
## Warning: Expecting numeric in D17181 / R17181C4: got 'n.a.'
## Warning: Expecting numeric in D17182 / R17182C4: got 'n.a.'
## Warning: Expecting numeric in D17183 / R17183C4: got 'n.a.'
## Warning: Expecting numeric in D17184 / R17184C4: got 'n.a.'
## Warning: Expecting numeric in D17185 / R17185C4: got 'n.a.'
## Warning: Expecting numeric in D17186 / R17186C4: got 'n.a.'
## Warning: Expecting numeric in D17187 / R17187C4: got 'n.a.'
## Warning: Expecting numeric in D17188 / R17188C4: got 'n.a.'
## Warning: Expecting numeric in D17189 / R17189C4: got 'n.a.'
## Warning: Expecting numeric in D17190 / R17190C4: got 'n.a.'
## Warning: Expecting numeric in D17191 / R17191C4: got 'n.a.'
## Warning: Expecting numeric in D17192 / R17192C4: got 'n.a.'
## Warning: Expecting numeric in D17193 / R17193C4: got 'n.a.'
## Warning: Expecting numeric in D17194 / R17194C4: got 'n.a.'
## Warning: Expecting numeric in D17195 / R17195C4: got 'n.a.'
## Warning: Expecting numeric in D17196 / R17196C4: got 'n.a.'
## Warning: Expecting numeric in D17197 / R17197C4: got 'n.a.'
## Warning: Expecting numeric in D17198 / R17198C4: got 'n.a.'
## Warning: Expecting numeric in D17199 / R17199C4: got 'n.a.'
## Warning: Expecting numeric in D17200 / R17200C4: got 'n.a.'
## Warning: Expecting numeric in D17201 / R17201C4: got 'n.a.'
## Warning: Expecting numeric in D17202 / R17202C4: got 'n.a.'
## Warning: Expecting numeric in D17203 / R17203C4: got 'n.a.'
## Warning: Expecting numeric in D17204 / R17204C4: got 'n.a.'
## Warning: Expecting numeric in D17205 / R17205C4: got 'n.a.'
## Warning: Expecting numeric in D17206 / R17206C4: got 'n.a.'
## Warning: Expecting numeric in D17207 / R17207C4: got 'n.a.'
## Warning: Expecting numeric in D17208 / R17208C4: got 'n.a.'
## Warning: Expecting numeric in D17209 / R17209C4: got 'n.a.'
## Warning: Expecting numeric in D17210 / R17210C4: got 'n.a.'
## Warning: Expecting numeric in D17211 / R17211C4: got 'n.a.'
## Warning: Expecting numeric in D17212 / R17212C4: got 'n.a.'
## Warning: Expecting numeric in D17213 / R17213C4: got 'n.a.'
## Warning: Expecting numeric in D17214 / R17214C4: got 'n.a.'
## Warning: Expecting numeric in D17215 / R17215C4: got 'n.a.'
## Warning: Expecting numeric in D17216 / R17216C4: got 'n.a.'
## Warning: Expecting numeric in D17217 / R17217C4: got 'n.a.'
## Warning: Expecting numeric in D17218 / R17218C4: got 'n.a.'
## Warning: Expecting numeric in D17219 / R17219C4: got 'n.a.'
## Warning: Expecting numeric in D17220 / R17220C4: got 'n.a.'
## Warning: Expecting numeric in D17221 / R17221C4: got 'n.a.'
## Warning: Expecting numeric in D17222 / R17222C4: got 'n.a.'
## Warning: Expecting numeric in D17223 / R17223C4: got 'n.a.'
## Warning: Expecting numeric in D17224 / R17224C4: got 'n.a.'
## Warning: Expecting numeric in D17225 / R17225C4: got 'n.a.'
## Warning: Expecting numeric in D17226 / R17226C4: got 'n.a.'
## Warning: Expecting numeric in D17227 / R17227C4: got 'n.a.'
## Warning: Expecting numeric in D17228 / R17228C4: got 'n.a.'
## Warning: Expecting numeric in D17229 / R17229C4: got 'n.a.'
## Warning: Expecting numeric in D17230 / R17230C4: got 'n.a.'
## Warning: Expecting numeric in D17231 / R17231C4: got 'n.a.'
## Warning: Expecting numeric in D17232 / R17232C4: got 'n.a.'
## Warning: Expecting numeric in D17233 / R17233C4: got 'n.a.'
## Warning: Expecting numeric in D17234 / R17234C4: got 'n.a.'
## Warning: Expecting numeric in D17235 / R17235C4: got 'n.a.'
## Warning: Expecting numeric in D17236 / R17236C4: got 'n.a.'
## Warning: Expecting numeric in D17237 / R17237C4: got 'n.a.'
## Warning: Expecting numeric in D17238 / R17238C4: got 'n.a.'
## Warning: Expecting numeric in D17239 / R17239C4: got 'n.a.'
## Warning: Expecting numeric in D17240 / R17240C4: got 'n.a.'
## Warning: Expecting numeric in D17241 / R17241C4: got 'n.a.'
## Warning: Expecting numeric in D17242 / R17242C4: got 'n.a.'
## Warning: Expecting numeric in D17243 / R17243C4: got 'n.a.'
## Warning: Expecting numeric in D17244 / R17244C4: got 'n.a.'
## Warning: Expecting numeric in D17245 / R17245C4: got 'n.a.'
## Warning: Expecting numeric in D17246 / R17246C4: got 'n.a.'
## Warning: Expecting numeric in D17247 / R17247C4: got 'n.a.'
## Warning: Expecting numeric in D17248 / R17248C4: got 'n.a.'
## Warning: Expecting numeric in D17249 / R17249C4: got 'n.a.'
## Warning: Expecting numeric in D17250 / R17250C4: got 'n.a.'
## Warning: Expecting numeric in D17251 / R17251C4: got 'n.a.'
## Warning: Expecting numeric in D17252 / R17252C4: got 'n.a.'
## Warning: Expecting numeric in D17253 / R17253C4: got 'n.a.'
## Warning: Expecting numeric in D17254 / R17254C4: got 'n.a.'
## Warning: Expecting numeric in D17255 / R17255C4: got 'n.a.'
## Warning: Expecting numeric in D17256 / R17256C4: got 'n.a.'
## Warning: Expecting numeric in D17257 / R17257C4: got 'n.a.'
## Warning: Expecting numeric in D17258 / R17258C4: got 'n.a.'
## Warning: Expecting numeric in D17259 / R17259C4: got 'n.a.'
## Warning: Expecting numeric in D17260 / R17260C4: got 'n.a.'
## Warning: Expecting numeric in D17261 / R17261C4: got 'n.a.'
## Warning: Expecting numeric in D17262 / R17262C4: got 'n.a.'
## Warning: Expecting numeric in D17263 / R17263C4: got 'n.a.'
## Warning: Expecting numeric in D17264 / R17264C4: got 'n.a.'
## Warning: Expecting numeric in D17265 / R17265C4: got 'n.a.'
## Warning: Expecting numeric in D17266 / R17266C4: got 'n.a.'
## Warning: Expecting numeric in D17267 / R17267C4: got 'n.a.'
## Warning: Expecting numeric in D17268 / R17268C4: got 'n.a.'
## Warning: Expecting numeric in D17269 / R17269C4: got 'n.a.'
## Warning: Expecting numeric in D17270 / R17270C4: got 'n.a.'
## Warning: Expecting numeric in D17271 / R17271C4: got 'n.a.'
## Warning: Expecting numeric in D17272 / R17272C4: got 'n.a.'
## Warning: Expecting numeric in D17273 / R17273C4: got 'n.a.'
## Warning: Expecting numeric in D17274 / R17274C4: got 'n.a.'
## Warning: Expecting numeric in D17275 / R17275C4: got 'n.a.'
## Warning: Expecting numeric in D17276 / R17276C4: got 'n.a.'
## Warning: Expecting numeric in D17277 / R17277C4: got 'n.a.'
## Warning: Expecting numeric in D17278 / R17278C4: got 'n.a.'
## Warning: Expecting numeric in D17279 / R17279C4: got 'n.a.'
## Warning: Expecting numeric in D17280 / R17280C4: got 'n.a.'
## Warning: Expecting numeric in D17281 / R17281C4: got 'n.a.'
## Warning: Expecting numeric in D17282 / R17282C4: got 'n.a.'
## Warning: Expecting numeric in D17283 / R17283C4: got 'n.a.'
## Warning: Expecting numeric in D17284 / R17284C4: got 'n.a.'
## Warning: Expecting numeric in D17285 / R17285C4: got 'n.a.'
## Warning: Expecting numeric in D17286 / R17286C4: got 'n.a.'
## Warning: Expecting numeric in D17287 / R17287C4: got 'n.a.'
## Warning: Expecting numeric in D17288 / R17288C4: got 'n.a.'
## Warning: Expecting numeric in D17289 / R17289C4: got 'n.a.'
## Warning: Expecting numeric in D17290 / R17290C4: got 'n.a.'
## Warning: Expecting numeric in D17291 / R17291C4: got 'n.a.'
## Warning: Expecting numeric in D17292 / R17292C4: got 'n.a.'
## Warning: Expecting numeric in D17293 / R17293C4: got 'n.a.'
## Warning: Expecting numeric in D17294 / R17294C4: got 'n.a.'
## Warning: Expecting numeric in D17295 / R17295C4: got 'n.a.'
## Warning: Expecting numeric in D17296 / R17296C4: got 'n.a.'
## Warning: Expecting numeric in D17297 / R17297C4: got 'n.a.'
## Warning: Expecting numeric in D17298 / R17298C4: got 'n.a.'
## Warning: Expecting numeric in D17299 / R17299C4: got 'n.a.'
## Warning: Expecting numeric in D17300 / R17300C4: got 'n.a.'
## Warning: Expecting numeric in D17301 / R17301C4: got 'n.a.'
## Warning: Expecting numeric in D17302 / R17302C4: got 'n.a.'
## Warning: Expecting numeric in D17303 / R17303C4: got 'n.a.'
## Warning: Expecting numeric in D17304 / R17304C4: got 'n.a.'
## Warning: Expecting numeric in D17305 / R17305C4: got 'n.a.'
## Warning: Expecting numeric in D17306 / R17306C4: got 'n.a.'
## Warning: Expecting numeric in D17307 / R17307C4: got 'n.a.'
## Warning: Expecting numeric in D17308 / R17308C4: got 'n.a.'
## Warning: Expecting numeric in D17309 / R17309C4: got 'n.a.'
## Warning: Expecting numeric in D17310 / R17310C4: got 'n.a.'
## Warning: Expecting numeric in D17311 / R17311C4: got 'n.a.'
## Warning: Expecting numeric in D17312 / R17312C4: got 'n.a.'
## Warning: Expecting numeric in D17313 / R17313C4: got 'n.a.'
## Warning: Expecting numeric in D17314 / R17314C4: got 'n.a.'
## Warning: Expecting numeric in D17315 / R17315C4: got 'n.a.'
## Warning: Expecting numeric in D17316 / R17316C4: got 'n.a.'
## Warning: Expecting numeric in D17317 / R17317C4: got 'n.a.'
## Warning: Expecting numeric in D17318 / R17318C4: got 'n.a.'
## Warning: Expecting numeric in D17319 / R17319C4: got 'n.a.'
## Warning: Expecting numeric in D17320 / R17320C4: got 'n.a.'
## Warning: Expecting numeric in D17321 / R17321C4: got 'n.a.'
## Warning: Expecting numeric in D17322 / R17322C4: got 'n.a.'
## Warning: Expecting numeric in D17323 / R17323C4: got 'n.a.'
## Warning: Expecting numeric in D17324 / R17324C4: got 'n.a.'
## Warning: Expecting numeric in D17325 / R17325C4: got 'n.a.'
## Warning: Expecting numeric in D17326 / R17326C4: got 'n.a.'
## Warning: Expecting numeric in D17327 / R17327C4: got 'n.a.'
## Warning: Expecting numeric in D17328 / R17328C4: got 'n.a.'
## Warning: Expecting numeric in D17329 / R17329C4: got 'n.a.'
## Warning: Expecting numeric in D17330 / R17330C4: got 'n.a.'
## Warning: Expecting numeric in D17331 / R17331C4: got 'n.a.'
## Warning: Expecting numeric in D17332 / R17332C4: got 'n.a.'
## Warning: Expecting numeric in D17333 / R17333C4: got 'n.a.'
## Warning: Expecting numeric in D17334 / R17334C4: got 'n.a.'
## Warning: Expecting numeric in D17335 / R17335C4: got 'n.a.'
## Warning: Expecting numeric in D17336 / R17336C4: got 'n.a.'
## Warning: Expecting numeric in D17337 / R17337C4: got 'n.a.'
## Warning: Expecting numeric in D17338 / R17338C4: got 'n.a.'
## Warning: Expecting numeric in D17339 / R17339C4: got 'n.a.'
## Warning: Expecting numeric in D17340 / R17340C4: got 'n.a.'
## Warning: Expecting numeric in D17341 / R17341C4: got 'n.a.'
## Warning: Expecting numeric in D17342 / R17342C4: got 'n.a.'
## Warning: Expecting numeric in D17343 / R17343C4: got 'n.a.'
## Warning: Expecting numeric in D17344 / R17344C4: got 'n.a.'
## Warning: Expecting numeric in D17345 / R17345C4: got 'n.a.'
## Warning: Expecting numeric in D17346 / R17346C4: got 'n.a.'
## Warning: Expecting numeric in D17347 / R17347C4: got 'n.a.'
## Warning: Expecting numeric in D17348 / R17348C4: got 'n.a.'
## Warning: Expecting numeric in D17349 / R17349C4: got 'n.a.'
## Warning: Expecting numeric in D17350 / R17350C4: got 'n.a.'
## Warning: Expecting numeric in D17351 / R17351C4: got 'n.a.'
## Warning: Expecting numeric in D17352 / R17352C4: got 'n.a.'
## Warning: Expecting numeric in D17353 / R17353C4: got 'n.a.'
## Warning: Expecting numeric in D17354 / R17354C4: got 'n.a.'
## Warning: Expecting numeric in D17355 / R17355C4: got 'n.a.'
## Warning: Expecting numeric in D17356 / R17356C4: got 'n.a.'
## Warning: Expecting numeric in D17357 / R17357C4: got 'n.a.'
## Warning: Expecting numeric in D17358 / R17358C4: got 'n.a.'
## Warning: Expecting numeric in D17359 / R17359C4: got 'n.a.'
## Warning: Expecting numeric in D17360 / R17360C4: got 'n.a.'
## Warning: Expecting numeric in D17361 / R17361C4: got 'n.a.'
## Warning: Expecting numeric in D17362 / R17362C4: got 'n.a.'
## Warning: Expecting numeric in D17363 / R17363C4: got 'n.a.'
## Warning: Expecting numeric in D17364 / R17364C4: got 'n.a.'
## Warning: Expecting numeric in D17365 / R17365C4: got 'n.a.'
## Warning: Expecting numeric in D17366 / R17366C4: got 'n.a.'
## Warning: Expecting numeric in D17367 / R17367C4: got 'n.a.'
## Warning: Expecting numeric in D17368 / R17368C4: got 'n.a.'
## Warning: Expecting numeric in D17369 / R17369C4: got 'n.a.'
## Warning: Expecting numeric in D17370 / R17370C4: got 'n.a.'
## Warning: Expecting numeric in D17371 / R17371C4: got 'n.a.'
## Warning: Expecting numeric in D17372 / R17372C4: got 'n.a.'
## Warning: Expecting numeric in D17373 / R17373C4: got 'n.a.'
## Warning: Expecting numeric in D17374 / R17374C4: got 'n.a.'
## Warning: Expecting numeric in D17375 / R17375C4: got 'n.a.'
## Warning: Expecting numeric in D17376 / R17376C4: got 'n.a.'
## Warning: Expecting numeric in D17377 / R17377C4: got 'n.a.'
## Warning: Expecting numeric in D17378 / R17378C4: got 'n.a.'
## Warning: Expecting numeric in D17379 / R17379C4: got 'n.a.'
## Warning: Expecting numeric in D17380 / R17380C4: got 'n.a.'
## Warning: Expecting numeric in D17381 / R17381C4: got 'n.a.'
## Warning: Expecting numeric in D17382 / R17382C4: got 'n.a.'
## Warning: Expecting numeric in D17383 / R17383C4: got 'n.a.'
## Warning: Expecting numeric in D17384 / R17384C4: got 'n.a.'
## Warning: Expecting numeric in D17385 / R17385C4: got 'n.a.'
## Warning: Expecting numeric in D17386 / R17386C4: got 'n.a.'
## Warning: Expecting numeric in D17387 / R17387C4: got 'n.a.'
## Warning: Expecting numeric in D17388 / R17388C4: got 'n.a.'
## Warning: Expecting numeric in D17389 / R17389C4: got 'n.a.'
## Warning: Expecting numeric in D17390 / R17390C4: got 'n.a.'
## Warning: Expecting numeric in D17391 / R17391C4: got 'n.a.'
## Warning: Expecting numeric in D17392 / R17392C4: got 'n.a.'
## Warning: Expecting numeric in D17393 / R17393C4: got 'n.a.'
## Warning: Expecting numeric in D17394 / R17394C4: got 'n.a.'
## Warning: Expecting numeric in D17395 / R17395C4: got 'n.a.'
## Warning: Expecting numeric in D17396 / R17396C4: got 'n.a.'
## Warning: Expecting numeric in D17397 / R17397C4: got 'n.a.'
## Warning: Expecting numeric in D17398 / R17398C4: got 'n.a.'
## Warning: Expecting numeric in D17399 / R17399C4: got 'n.a.'
## Warning: Expecting numeric in D17400 / R17400C4: got 'n.a.'
## Warning: Expecting numeric in D17401 / R17401C4: got 'n.a.'
## Warning: Expecting numeric in D17402 / R17402C4: got 'n.a.'
## Warning: Expecting numeric in D17403 / R17403C4: got 'n.a.'
## Warning: Expecting numeric in D17404 / R17404C4: got 'n.a.'
## Warning: Expecting numeric in D17405 / R17405C4: got 'n.a.'
## Warning: Expecting numeric in D17406 / R17406C4: got 'n.a.'
## Warning: Expecting numeric in D17407 / R17407C4: got 'n.a.'
## Warning: Expecting numeric in D17408 / R17408C4: got 'n.a.'
## Warning: Expecting numeric in D17409 / R17409C4: got 'n.a.'
## Warning: Expecting numeric in D17410 / R17410C4: got 'n.a.'
## Warning: Expecting numeric in D17411 / R17411C4: got 'n.a.'
## Warning: Expecting numeric in D17412 / R17412C4: got 'n.a.'
## Warning: Expecting numeric in D17413 / R17413C4: got 'n.a.'
## Warning: Expecting numeric in D17414 / R17414C4: got 'n.a.'
## Warning: Expecting numeric in D17415 / R17415C4: got 'n.a.'
## Warning: Expecting numeric in D17416 / R17416C4: got 'n.a.'
## Warning: Expecting numeric in D17417 / R17417C4: got 'n.a.'
## Warning: Expecting numeric in D17418 / R17418C4: got 'n.a.'
## Warning: Expecting numeric in D17419 / R17419C4: got 'n.a.'
## Warning: Expecting numeric in D17420 / R17420C4: got 'n.a.'
## Warning: Expecting numeric in D17421 / R17421C4: got 'n.a.'
## Warning: Expecting numeric in D17422 / R17422C4: got 'n.a.'
## Warning: Expecting numeric in D17423 / R17423C4: got 'n.a.'
## Warning: Expecting numeric in D17424 / R17424C4: got 'n.a.'
## Warning: Expecting numeric in D17425 / R17425C4: got 'n.a.'
## Warning: Expecting numeric in D17426 / R17426C4: got 'n.a.'
## Warning: Expecting numeric in D17427 / R17427C4: got 'n.a.'
## Warning: Expecting numeric in D17428 / R17428C4: got 'n.a.'
## Warning: Expecting numeric in D17429 / R17429C4: got 'n.a.'
## Warning: Expecting numeric in D17430 / R17430C4: got 'n.a.'
## Warning: Expecting numeric in D17431 / R17431C4: got 'n.a.'
## Warning: Expecting numeric in D17432 / R17432C4: got 'n.a.'
## Warning: Expecting numeric in D17433 / R17433C4: got 'n.a.'
## Warning: Expecting numeric in D17434 / R17434C4: got 'n.a.'
## Warning: Expecting numeric in D17435 / R17435C4: got 'n.a.'
## Warning: Expecting numeric in D17436 / R17436C4: got 'n.a.'
## Warning: Expecting numeric in D17437 / R17437C4: got 'n.a.'
## Warning: Expecting numeric in D17438 / R17438C4: got 'n.a.'
## Warning: Expecting numeric in D17439 / R17439C4: got 'n.a.'
## Warning: Expecting numeric in D17440 / R17440C4: got 'n.a.'
## Warning: Expecting numeric in D17441 / R17441C4: got 'n.a.'
## Warning: Expecting numeric in D17442 / R17442C4: got 'n.a.'
## Warning: Expecting numeric in D17443 / R17443C4: got 'n.a.'
## Warning: Expecting numeric in D17444 / R17444C4: got 'n.a.'
## Warning: Expecting numeric in D17445 / R17445C4: got 'n.a.'
## Warning: Expecting numeric in D17446 / R17446C4: got 'n.a.'
## Warning: Expecting numeric in D17447 / R17447C4: got 'n.a.'
## Warning: Expecting numeric in D17448 / R17448C4: got 'n.a.'
## Warning: Expecting numeric in D17449 / R17449C4: got 'n.a.'
## Warning: Expecting numeric in D17450 / R17450C4: got 'n.a.'
## Warning: Expecting numeric in D17451 / R17451C4: got 'n.a.'
## Warning: Expecting numeric in D17452 / R17452C4: got 'n.a.'
## Warning: Expecting numeric in D17453 / R17453C4: got 'n.a.'
## Warning: Expecting numeric in D17454 / R17454C4: got 'n.a.'
## Warning: Expecting numeric in D17455 / R17455C4: got 'n.a.'
## Warning: Expecting numeric in D17456 / R17456C4: got 'n.a.'
## Warning: Expecting numeric in D17457 / R17457C4: got 'n.a.'
## Warning: Expecting numeric in D17458 / R17458C4: got 'n.a.'
## Warning: Expecting numeric in D17459 / R17459C4: got 'n.a.'
## Warning: Expecting numeric in D17460 / R17460C4: got 'n.a.'
## Warning: Expecting numeric in D17461 / R17461C4: got 'n.a.'
## Warning: Expecting numeric in D17462 / R17462C4: got 'n.a.'
## Warning: Expecting numeric in D17463 / R17463C4: got 'n.a.'
## Warning: Expecting numeric in D17464 / R17464C4: got 'n.a.'
## Warning: Expecting numeric in D17465 / R17465C4: got 'n.a.'
## Warning: Expecting numeric in D17466 / R17466C4: got 'n.a.'
## Warning: Expecting numeric in D17467 / R17467C4: got 'n.a.'
## Warning: Expecting numeric in D17468 / R17468C4: got 'n.a.'
## Warning: Expecting numeric in D17469 / R17469C4: got 'n.a.'
## Warning: Expecting numeric in D17470 / R17470C4: got 'n.a.'
## Warning: Expecting numeric in D17471 / R17471C4: got 'n.a.'
## Warning: Expecting numeric in D17472 / R17472C4: got 'n.a.'
## Warning: Expecting numeric in D17473 / R17473C4: got 'n.a.'
## Warning: Expecting numeric in D17474 / R17474C4: got 'n.a.'
## Warning: Expecting numeric in D17475 / R17475C4: got 'n.a.'
## Warning: Expecting numeric in D17476 / R17476C4: got 'n.a.'
## Warning: Expecting numeric in D17477 / R17477C4: got 'n.a.'
## Warning: Expecting numeric in D17478 / R17478C4: got 'n.a.'
## Warning: Expecting numeric in D17479 / R17479C4: got 'n.a.'
## Warning: Expecting numeric in D17480 / R17480C4: got 'n.a.'
## Warning: Expecting numeric in D17481 / R17481C4: got 'n.a.'
## Warning: Expecting numeric in D17482 / R17482C4: got 'n.a.'
## Warning: Expecting numeric in D17483 / R17483C4: got 'n.a.'
## Warning: Expecting numeric in D17484 / R17484C4: got 'n.a.'
## Warning: Expecting numeric in D17485 / R17485C4: got 'n.a.'
## Warning: Expecting numeric in D17486 / R17486C4: got 'n.a.'
## Warning: Expecting numeric in D17487 / R17487C4: got 'n.a.'
## Warning: Expecting numeric in D17488 / R17488C4: got 'n.a.'
## Warning: Expecting numeric in D17489 / R17489C4: got 'n.a.'
## Warning: Expecting numeric in D17490 / R17490C4: got 'n.a.'
## Warning: Expecting numeric in D17491 / R17491C4: got 'n.a.'
## Warning: Expecting numeric in D17492 / R17492C4: got 'n.a.'
## Warning: Expecting numeric in D17493 / R17493C4: got 'n.a.'
## Warning: Expecting numeric in D17494 / R17494C4: got 'n.a.'
## Warning: Expecting numeric in D17495 / R17495C4: got 'n.a.'
## Warning: Expecting numeric in D17496 / R17496C4: got 'n.a.'
## Warning: Expecting numeric in D17497 / R17497C4: got 'n.a.'
## Warning: Expecting numeric in D17498 / R17498C4: got 'n.a.'
## Warning: Expecting numeric in D17499 / R17499C4: got 'n.a.'
## Warning: Expecting numeric in D17500 / R17500C4: got 'n.a.'
## Warning: Expecting numeric in D17501 / R17501C4: got 'n.a.'
## Warning: Expecting numeric in D17502 / R17502C4: got 'n.a.'
## Warning: Expecting numeric in D17503 / R17503C4: got 'n.a.'
## Warning: Expecting numeric in D17504 / R17504C4: got 'n.a.'
## Warning: Expecting numeric in D17505 / R17505C4: got 'n.a.'
## Warning: Expecting numeric in D17506 / R17506C4: got 'n.a.'
## Warning: Expecting numeric in D17507 / R17507C4: got 'n.a.'
## Warning: Expecting numeric in D17508 / R17508C4: got 'n.a.'
## Warning: Expecting numeric in D17509 / R17509C4: got 'n.a.'
## Warning: Expecting numeric in D17510 / R17510C4: got 'n.a.'
## Warning: Expecting numeric in D17511 / R17511C4: got 'n.a.'
## Warning: Expecting numeric in D17512 / R17512C4: got 'n.a.'
## Warning: Expecting numeric in D17513 / R17513C4: got 'n.a.'
## Warning: Expecting numeric in D17514 / R17514C4: got 'n.a.'
## Warning: Expecting numeric in D17515 / R17515C4: got 'n.a.'
## Warning: Expecting numeric in D17516 / R17516C4: got 'n.a.'
## Warning: Expecting numeric in D17517 / R17517C4: got 'n.a.'
## Warning: Expecting numeric in D17518 / R17518C4: got 'n.a.'
## Warning: Expecting numeric in D17519 / R17519C4: got 'n.a.'
## Warning: Expecting numeric in D17520 / R17520C4: got 'n.a.'
## Warning: Expecting numeric in D17521 / R17521C4: got 'n.a.'
## Warning: Expecting numeric in D17522 / R17522C4: got 'n.a.'
## Warning: Expecting numeric in D17523 / R17523C4: got 'n.a.'
## Warning: Expecting numeric in D17524 / R17524C4: got 'n.a.'
## Warning: Expecting numeric in D17525 / R17525C4: got 'n.a.'
## Warning: Expecting numeric in D17526 / R17526C4: got 'n.a.'
## Warning: Expecting numeric in D17527 / R17527C4: got 'n.a.'
## Warning: Expecting numeric in D17528 / R17528C4: got 'n.a.'
## Warning: Expecting numeric in D17529 / R17529C4: got 'n.a.'
## Warning: Expecting numeric in D17530 / R17530C4: got 'n.a.'
## Warning: Expecting numeric in D17531 / R17531C4: got 'n.a.'
## Warning: Expecting numeric in D17532 / R17532C4: got 'n.a.'
## Warning: Expecting numeric in D17533 / R17533C4: got 'n.a.'
## Warning: Expecting numeric in D17534 / R17534C4: got 'n.a.'
## Warning: Expecting numeric in D17535 / R17535C4: got 'n.a.'
## Warning: Expecting numeric in D17536 / R17536C4: got 'n.a.'
## Warning: Expecting numeric in D17537 / R17537C4: got 'n.a.'
## Warning: Expecting numeric in D17538 / R17538C4: got 'n.a.'
## Warning: Expecting numeric in D17539 / R17539C4: got 'n.a.'
## Warning: Expecting numeric in D17540 / R17540C4: got 'n.a.'
## Warning: Expecting numeric in D17541 / R17541C4: got 'n.a.'
## Warning: Expecting numeric in D17542 / R17542C4: got 'n.a.'
## Warning: Expecting numeric in D17543 / R17543C4: got 'n.a.'
## Warning: Expecting numeric in D17544 / R17544C4: got 'n.a.'
## Warning: Expecting numeric in D17545 / R17545C4: got 'n.a.'
## Warning: Expecting numeric in D17546 / R17546C4: got 'n.a.'
## Warning: Expecting numeric in D17547 / R17547C4: got 'n.a.'
## Warning: Expecting numeric in D17548 / R17548C4: got 'n.a.'
## Warning: Expecting numeric in D17549 / R17549C4: got 'n.a.'
## Warning: Expecting numeric in D17550 / R17550C4: got 'n.a.'
## Warning: Expecting numeric in D17551 / R17551C4: got 'n.a.'
## Warning: Expecting numeric in D17552 / R17552C4: got 'n.a.'
## Warning: Expecting numeric in D17553 / R17553C4: got 'n.a.'
## Warning: Expecting numeric in D17554 / R17554C4: got 'n.a.'
## Warning: Expecting numeric in D17555 / R17555C4: got 'n.a.'
## Warning: Expecting numeric in D17556 / R17556C4: got 'n.a.'
## Warning: Expecting numeric in D17557 / R17557C4: got 'n.a.'
## Warning: Expecting numeric in D17558 / R17558C4: got 'n.a.'
## Warning: Expecting numeric in D17559 / R17559C4: got 'n.a.'
## Warning: Expecting numeric in D17560 / R17560C4: got 'n.a.'
## Warning: Expecting numeric in D17561 / R17561C4: got 'n.a.'
## Warning: Expecting numeric in D17562 / R17562C4: got 'n.a.'
## Warning: Expecting numeric in D17563 / R17563C4: got 'n.a.'
## Warning: Expecting numeric in D17564 / R17564C4: got 'n.a.'
## Warning: Expecting numeric in D17565 / R17565C4: got 'n.a.'
## Warning: Expecting numeric in D17566 / R17566C4: got 'n.a.'
## Warning: Expecting numeric in D17567 / R17567C4: got 'n.a.'
## Warning: Expecting numeric in D17568 / R17568C4: got 'n.a.'
## Warning: Expecting numeric in D17569 / R17569C4: got 'n.a.'
## Warning: Expecting numeric in D17570 / R17570C4: got 'n.a.'
## Warning: Expecting numeric in D17571 / R17571C4: got 'n.a.'
## Warning: Expecting numeric in D17572 / R17572C4: got 'n.a.'
## Warning: Expecting numeric in D17573 / R17573C4: got 'n.a.'
## Warning: Expecting numeric in D17574 / R17574C4: got 'n.a.'
## Warning: Expecting numeric in D17575 / R17575C4: got 'n.a.'
## Warning: Expecting numeric in D17576 / R17576C4: got 'n.a.'
## Warning: Expecting numeric in D17577 / R17577C4: got 'n.a.'
## Warning: Expecting numeric in D17578 / R17578C4: got 'n.a.'
## Warning: Expecting numeric in D17579 / R17579C4: got 'n.a.'
## Warning: Expecting numeric in D17580 / R17580C4: got 'n.a.'
## Warning: Expecting numeric in D17581 / R17581C4: got 'n.a.'
## Warning: Expecting numeric in D17582 / R17582C4: got 'n.a.'
## Warning: Expecting numeric in D17583 / R17583C4: got 'n.a.'
## Warning: Expecting numeric in D17584 / R17584C4: got 'n.a.'
## Warning: Expecting numeric in D17585 / R17585C4: got 'n.a.'
## Warning: Expecting numeric in D17586 / R17586C4: got 'n.a.'
## Warning: Expecting numeric in D17587 / R17587C4: got 'n.a.'
## Warning: Expecting numeric in D17588 / R17588C4: got 'n.a.'
## Warning: Expecting numeric in D17589 / R17589C4: got 'n.a.'
## Warning: Expecting numeric in D17590 / R17590C4: got 'n.a.'
## Warning: Expecting numeric in D17591 / R17591C4: got 'n.a.'
## Warning: Expecting numeric in D17592 / R17592C4: got 'n.a.'
## Warning: Expecting numeric in D17593 / R17593C4: got 'n.a.'
## Warning: Expecting numeric in D17594 / R17594C4: got 'n.a.'
## Warning: Expecting numeric in D17595 / R17595C4: got 'n.a.'
## Warning: Expecting numeric in D17596 / R17596C4: got 'n.a.'
## Warning: Expecting numeric in D17597 / R17597C4: got 'n.a.'
## Warning: Expecting numeric in D17598 / R17598C4: got 'n.a.'
## Warning: Expecting numeric in D17599 / R17599C4: got 'n.a.'
## Warning: Expecting numeric in D17600 / R17600C4: got 'n.a.'
## Warning: Expecting numeric in D17601 / R17601C4: got 'n.a.'
## Warning: Expecting numeric in D17602 / R17602C4: got 'n.a.'
## Warning: Expecting numeric in D17603 / R17603C4: got 'n.a.'
## Warning: Expecting numeric in D17604 / R17604C4: got 'n.a.'
## Warning: Expecting numeric in D17605 / R17605C4: got 'n.a.'
## Warning: Expecting numeric in D17606 / R17606C4: got 'n.a.'
## Warning: Expecting numeric in D17607 / R17607C4: got 'n.a.'
## Warning: Expecting numeric in D17608 / R17608C4: got 'n.a.'
## Warning: Expecting numeric in D17609 / R17609C4: got 'n.a.'
## Warning: Expecting numeric in D17610 / R17610C4: got 'n.a.'
## Warning: Expecting numeric in D17611 / R17611C4: got 'n.a.'
## Warning: Expecting numeric in D17612 / R17612C4: got 'n.a.'
## Warning: Expecting numeric in D17613 / R17613C4: got 'n.a.'
## Warning: Expecting numeric in D17614 / R17614C4: got 'n.a.'
## Warning: Expecting numeric in D17615 / R17615C4: got 'n.a.'
## Warning: Expecting numeric in D17616 / R17616C4: got 'n.a.'
## Warning: Expecting numeric in D17617 / R17617C4: got 'n.a.'
## Warning: Expecting numeric in D17618 / R17618C4: got 'n.a.'
## Warning: Expecting numeric in D17619 / R17619C4: got 'n.a.'
## Warning: Expecting numeric in D17620 / R17620C4: got 'n.a.'
## Warning: Expecting numeric in D17621 / R17621C4: got 'n.a.'
## Warning: Expecting numeric in D17622 / R17622C4: got 'n.a.'
## Warning: Expecting numeric in D17623 / R17623C4: got 'n.a.'
## Warning: Expecting numeric in D17624 / R17624C4: got 'n.a.'
## Warning: Expecting numeric in D17625 / R17625C4: got 'n.a.'
## Warning: Expecting numeric in D17626 / R17626C4: got 'n.a.'
## Warning: Expecting numeric in D17627 / R17627C4: got 'n.a.'
## Warning: Expecting numeric in D17628 / R17628C4: got 'n.a.'
## Warning: Expecting numeric in D17629 / R17629C4: got 'n.a.'
## Warning: Expecting numeric in D17630 / R17630C4: got 'n.a.'
## Warning: Expecting numeric in D17631 / R17631C4: got 'n.a.'
## Warning: Expecting numeric in D17632 / R17632C4: got 'n.a.'
## Warning: Expecting numeric in D17633 / R17633C4: got 'n.a.'
## Warning: Expecting numeric in D17634 / R17634C4: got 'n.a.'
## Warning: Expecting numeric in D17635 / R17635C4: got 'n.a.'
## Warning: Expecting numeric in D17636 / R17636C4: got 'n.a.'
## Warning: Expecting numeric in D17637 / R17637C4: got 'n.a.'
## Warning: Expecting numeric in D17638 / R17638C4: got 'n.a.'
## Warning: Expecting numeric in D17639 / R17639C4: got 'n.a.'
## Warning: Expecting numeric in D17640 / R17640C4: got 'n.a.'
## Warning: Expecting numeric in D17641 / R17641C4: got 'n.a.'
## Warning: Expecting numeric in D17642 / R17642C4: got 'n.a.'
## Warning: Expecting numeric in D17643 / R17643C4: got 'n.a.'
## Warning: Expecting numeric in D17644 / R17644C4: got 'n.a.'
## Warning: Expecting numeric in D17645 / R17645C4: got 'n.a.'
## Warning: Expecting numeric in D17646 / R17646C4: got 'n.a.'
## Warning: Expecting numeric in D17647 / R17647C4: got 'n.a.'
## Warning: Expecting numeric in D17648 / R17648C4: got 'n.a.'
## Warning: Expecting numeric in D17649 / R17649C4: got 'n.a.'
## Warning: Expecting numeric in D17650 / R17650C4: got 'n.a.'
## Warning: Expecting numeric in D17651 / R17651C4: got 'n.a.'
## Warning: Expecting numeric in D17652 / R17652C4: got 'n.a.'
## Warning: Expecting numeric in D17653 / R17653C4: got 'n.a.'
## Warning: Expecting numeric in D17654 / R17654C4: got 'n.a.'
## Warning: Expecting numeric in D17655 / R17655C4: got 'n.a.'
## Warning: Expecting numeric in D17656 / R17656C4: got 'n.a.'
## Warning: Expecting numeric in D17657 / R17657C4: got 'n.a.'
## Warning: Expecting numeric in D17658 / R17658C4: got 'n.a.'
## Warning: Expecting numeric in D17659 / R17659C4: got 'n.a.'
## Warning: Expecting numeric in D17660 / R17660C4: got 'n.a.'
## Warning: Expecting numeric in D17661 / R17661C4: got 'n.a.'
## Warning: Expecting numeric in D17662 / R17662C4: got 'n.a.'
## Warning: Expecting numeric in D17663 / R17663C4: got 'n.a.'
## Warning: Expecting numeric in D17664 / R17664C4: got 'n.a.'
## Warning: Expecting numeric in D17665 / R17665C4: got 'n.a.'
## Warning: Expecting numeric in D17666 / R17666C4: got 'n.a.'
## Warning: Expecting numeric in D17667 / R17667C4: got 'n.a.'
## Warning: Expecting numeric in D17668 / R17668C4: got 'n.a.'
## Warning: Expecting numeric in D17669 / R17669C4: got 'n.a.'
## Warning: Expecting numeric in D17670 / R17670C4: got 'n.a.'
## Warning: Expecting numeric in D17671 / R17671C4: got 'n.a.'
## Warning: Expecting numeric in D17672 / R17672C4: got 'n.a.'
## Warning: Expecting numeric in D17673 / R17673C4: got 'n.a.'
## Warning: Expecting numeric in D17674 / R17674C4: got 'n.a.'
## Warning: Expecting numeric in D17675 / R17675C4: got 'n.a.'
## Warning: Expecting numeric in D17676 / R17676C4: got 'n.a.'
## Warning: Expecting numeric in D17677 / R17677C4: got 'n.a.'
## Warning: Expecting numeric in D17678 / R17678C4: got 'n.a.'
## Warning: Expecting numeric in D17679 / R17679C4: got 'n.a.'
## Warning: Expecting numeric in D17680 / R17680C4: got 'n.a.'
## Warning: Expecting numeric in D17681 / R17681C4: got 'n.a.'
## Warning: Expecting numeric in D17682 / R17682C4: got 'n.a.'
## Warning: Expecting numeric in D17683 / R17683C4: got 'n.a.'
## Warning: Expecting numeric in D17684 / R17684C4: got 'n.a.'
## Warning: Expecting numeric in D17685 / R17685C4: got 'n.a.'
## Warning: Expecting numeric in D17686 / R17686C4: got 'n.a.'
## Warning: Expecting numeric in D17687 / R17687C4: got 'n.a.'
## Warning: Expecting numeric in D17688 / R17688C4: got 'n.a.'
## Warning: Expecting numeric in D17689 / R17689C4: got 'n.a.'
## Warning: Expecting numeric in D17690 / R17690C4: got 'n.a.'
## Warning: Expecting numeric in D17691 / R17691C4: got 'n.a.'
## Warning: Expecting numeric in D17692 / R17692C4: got 'n.a.'
## Warning: Expecting numeric in D17693 / R17693C4: got 'n.a.'
## Warning: Expecting numeric in D17694 / R17694C4: got 'n.a.'
## Warning: Expecting numeric in D17695 / R17695C4: got 'n.a.'
## Warning: Expecting numeric in D17696 / R17696C4: got 'n.a.'
## Warning: Expecting numeric in D17697 / R17697C4: got 'n.a.'
## Warning: Expecting numeric in D17698 / R17698C4: got 'n.a.'
## Warning: Expecting numeric in D17699 / R17699C4: got 'n.a.'
## Warning: Expecting numeric in D17700 / R17700C4: got 'n.a.'
## Warning: Expecting numeric in D17701 / R17701C4: got 'n.a.'
## Warning: Expecting numeric in D17702 / R17702C4: got 'n.a.'
## Warning: Expecting numeric in D17703 / R17703C4: got 'n.a.'
## Warning: Expecting numeric in D17704 / R17704C4: got 'n.a.'
## Warning: Expecting numeric in D17705 / R17705C4: got 'n.a.'
## Warning: Expecting numeric in D17706 / R17706C4: got 'n.a.'
## Warning: Expecting numeric in D17707 / R17707C4: got 'n.a.'
## Warning: Expecting numeric in D17708 / R17708C4: got 'n.a.'
## Warning: Expecting numeric in D17709 / R17709C4: got 'n.a.'
## Warning: Expecting numeric in D17710 / R17710C4: got 'n.a.'
## Warning: Expecting numeric in D17711 / R17711C4: got 'n.a.'
## Warning: Expecting numeric in D17712 / R17712C4: got 'n.a.'
## Warning: Expecting numeric in D17713 / R17713C4: got 'n.a.'
## Warning: Expecting numeric in D17714 / R17714C4: got 'n.a.'
## Warning: Expecting numeric in D17715 / R17715C4: got 'n.a.'
## Warning: Expecting numeric in D17716 / R17716C4: got 'n.a.'
## Warning: Expecting numeric in D17717 / R17717C4: got 'n.a.'
## Warning: Expecting numeric in D17718 / R17718C4: got 'n.a.'
## Warning: Expecting numeric in D17719 / R17719C4: got 'n.a.'
## Warning: Expecting numeric in D17720 / R17720C4: got 'n.a.'
## Warning: Expecting numeric in D17721 / R17721C4: got 'n.a.'
## Warning: Expecting numeric in D17722 / R17722C4: got 'n.a.'
## Warning: Expecting numeric in D17723 / R17723C4: got 'n.a.'
## Warning: Expecting numeric in D17724 / R17724C4: got 'n.a.'
## Warning: Expecting numeric in D17725 / R17725C4: got 'n.a.'
## Warning: Expecting numeric in D17726 / R17726C4: got 'n.a.'
## Warning: Expecting numeric in D17727 / R17727C4: got 'n.a.'
## Warning: Expecting numeric in D17728 / R17728C4: got 'n.a.'
## Warning: Expecting numeric in D17729 / R17729C4: got 'n.a.'
## Warning: Expecting numeric in D17730 / R17730C4: got 'n.a.'
## Warning: Expecting numeric in D17731 / R17731C4: got 'n.a.'
## Warning: Expecting numeric in D17732 / R17732C4: got 'n.a.'
## Warning: Expecting numeric in D17733 / R17733C4: got 'n.a.'
## Warning: Expecting numeric in D17734 / R17734C4: got 'n.a.'
## Warning: Expecting numeric in D17735 / R17735C4: got 'n.a.'
## Warning: Expecting numeric in D17736 / R17736C4: got 'n.a.'
## Warning: Expecting numeric in D17737 / R17737C4: got 'n.a.'
## Warning: Expecting numeric in D17738 / R17738C4: got 'n.a.'
## Warning: Expecting numeric in D17739 / R17739C4: got 'n.a.'
## Warning: Expecting numeric in D17740 / R17740C4: got 'n.a.'
## Warning: Expecting numeric in D17741 / R17741C4: got 'n.a.'
## Warning: Expecting numeric in D17742 / R17742C4: got 'n.a.'
## Warning: Expecting numeric in D17743 / R17743C4: got 'n.a.'
## Warning: Expecting numeric in D17744 / R17744C4: got 'n.a.'
## Warning: Expecting numeric in D17745 / R17745C4: got 'n.a.'
## Warning: Expecting numeric in D17746 / R17746C4: got 'n.a.'
## Warning: Expecting numeric in D17747 / R17747C4: got 'n.a.'
## Warning: Expecting numeric in D17748 / R17748C4: got 'n.a.'
## Warning: Expecting numeric in D17749 / R17749C4: got 'n.a.'
## Warning: Expecting numeric in D17750 / R17750C4: got 'n.a.'
## Warning: Expecting numeric in D17751 / R17751C4: got 'n.a.'
## Warning: Expecting numeric in D17752 / R17752C4: got 'n.a.'
## Warning: Expecting numeric in D17753 / R17753C4: got 'n.a.'
## Warning: Expecting numeric in D17754 / R17754C4: got 'n.a.'
## Warning: Expecting numeric in D17755 / R17755C4: got 'n.a.'
## Warning: Expecting numeric in D17756 / R17756C4: got 'n.a.'
## Warning: Expecting numeric in D17757 / R17757C4: got 'n.a.'
## Warning: Expecting numeric in D17758 / R17758C4: got 'n.a.'
## Warning: Expecting numeric in D17759 / R17759C4: got 'n.a.'
## Warning: Expecting numeric in D17760 / R17760C4: got 'n.a.'
## Warning: Expecting numeric in D17761 / R17761C4: got 'n.a.'
## Warning: Expecting numeric in D17762 / R17762C4: got 'n.a.'
## Warning: Expecting numeric in D17763 / R17763C4: got 'n.a.'
## Warning: Expecting numeric in D17764 / R17764C4: got 'n.a.'
## Warning: Expecting numeric in D17765 / R17765C4: got 'n.a.'
## Warning: Expecting numeric in D17766 / R17766C4: got 'n.a.'
## Warning: Expecting numeric in D17767 / R17767C4: got 'n.a.'
## Warning: Expecting numeric in D17768 / R17768C4: got 'n.a.'
## Warning: Expecting numeric in D17769 / R17769C4: got 'n.a.'
## Warning: Expecting numeric in D17770 / R17770C4: got 'n.a.'
## Warning: Expecting numeric in D17771 / R17771C4: got 'n.a.'
## Warning: Expecting numeric in D17772 / R17772C4: got 'n.a.'
## Warning: Expecting numeric in D17773 / R17773C4: got 'n.a.'
## Warning: Expecting numeric in D17774 / R17774C4: got 'n.a.'
## Warning: Expecting numeric in D17775 / R17775C4: got 'n.a.'
## Warning: Expecting numeric in D17776 / R17776C4: got 'n.a.'
## Warning: Expecting numeric in D17777 / R17777C4: got 'n.a.'
## Warning: Expecting numeric in D17778 / R17778C4: got 'n.a.'
## Warning: Expecting numeric in D17779 / R17779C4: got 'n.a.'
## Warning: Expecting numeric in D17780 / R17780C4: got 'n.a.'
## Warning: Expecting numeric in D17781 / R17781C4: got 'n.a.'
## Warning: Expecting numeric in D17782 / R17782C4: got 'n.a.'
## Warning: Expecting numeric in D17783 / R17783C4: got 'n.a.'
## Warning: Expecting numeric in D17784 / R17784C4: got 'n.a.'
## Warning: Expecting numeric in D17785 / R17785C4: got 'n.a.'
## Warning: Expecting numeric in D17786 / R17786C4: got 'n.a.'
## Warning: Expecting numeric in D17787 / R17787C4: got 'n.a.'
## Warning: Expecting numeric in D17788 / R17788C4: got 'n.a.'
## Warning: Expecting numeric in D17789 / R17789C4: got 'n.a.'
## Warning: Expecting numeric in D17790 / R17790C4: got 'n.a.'
## Warning: Expecting numeric in D17791 / R17791C4: got 'n.a.'
## Warning: Expecting numeric in D17792 / R17792C4: got 'n.a.'
## Warning: Expecting numeric in D17793 / R17793C4: got 'n.a.'
## Warning: Expecting numeric in D17794 / R17794C4: got 'n.a.'
## Warning: Expecting numeric in D17795 / R17795C4: got 'n.a.'
## Warning: Expecting numeric in D17796 / R17796C4: got 'n.a.'
## Warning: Expecting numeric in D17797 / R17797C4: got 'n.a.'
## Warning: Expecting numeric in D17798 / R17798C4: got 'n.a.'
## Warning: Expecting numeric in D17799 / R17799C4: got 'n.a.'
## Warning: Expecting numeric in D17800 / R17800C4: got 'n.a.'
## Warning: Expecting numeric in D17801 / R17801C4: got 'n.a.'
## Warning: Expecting numeric in D17802 / R17802C4: got 'n.a.'
## Warning: Expecting numeric in D17803 / R17803C4: got 'n.a.'
## Warning: Expecting numeric in D17804 / R17804C4: got 'n.a.'
## Warning: Expecting numeric in D17805 / R17805C4: got 'n.a.'
## Warning: Expecting numeric in D17806 / R17806C4: got 'n.a.'
## Warning: Expecting numeric in D17807 / R17807C4: got 'n.a.'
## Warning: Expecting numeric in D17808 / R17808C4: got 'n.a.'
## Warning: Expecting numeric in D17809 / R17809C4: got 'n.a.'
## Warning: Expecting numeric in D17810 / R17810C4: got 'n.a.'
## Warning: Expecting numeric in D17811 / R17811C4: got 'n.a.'
## Warning: Expecting numeric in D17812 / R17812C4: got 'n.a.'
## Warning: Expecting numeric in D17813 / R17813C4: got 'n.a.'
## Warning: Expecting numeric in D17814 / R17814C4: got 'n.a.'
## Warning: Expecting numeric in D17815 / R17815C4: got 'n.a.'
## Warning: Expecting numeric in D17816 / R17816C4: got 'n.a.'
## Warning: Expecting numeric in D17817 / R17817C4: got 'n.a.'
## Warning: Expecting numeric in D17818 / R17818C4: got 'n.a.'
## Warning: Expecting numeric in D17819 / R17819C4: got 'n.a.'
## Warning: Expecting numeric in D17820 / R17820C4: got 'n.a.'
## Warning: Expecting numeric in D17821 / R17821C4: got 'n.a.'
## Warning: Expecting numeric in D17822 / R17822C4: got 'n.a.'
## Warning: Expecting numeric in D17823 / R17823C4: got 'n.a.'
## Warning: Expecting numeric in D17824 / R17824C4: got 'n.a.'
## Warning: Expecting numeric in D17825 / R17825C4: got 'n.a.'
## Warning: Expecting numeric in D17826 / R17826C4: got 'n.a.'
## Warning: Expecting numeric in D17827 / R17827C4: got 'n.a.'
## Warning: Expecting numeric in D17828 / R17828C4: got 'n.a.'
## Warning: Expecting numeric in D17829 / R17829C4: got 'n.a.'
## Warning: Expecting numeric in D17830 / R17830C4: got 'n.a.'
## Warning: Expecting numeric in D17831 / R17831C4: got 'n.a.'
## Warning: Expecting numeric in D17832 / R17832C4: got 'n.a.'
## Warning: Expecting numeric in D17833 / R17833C4: got 'n.a.'
## Warning: Expecting numeric in D17834 / R17834C4: got 'n.a.'
## Warning: Expecting numeric in D17835 / R17835C4: got 'n.a.'
## Warning: Expecting numeric in D17836 / R17836C4: got 'n.a.'
## Warning: Expecting numeric in D17837 / R17837C4: got 'n.a.'
## Warning: Expecting numeric in D17838 / R17838C4: got 'n.a.'
## Warning: Expecting numeric in D17839 / R17839C4: got 'n.a.'
## Warning: Expecting numeric in D17840 / R17840C4: got 'n.a.'
## Warning: Expecting numeric in D17841 / R17841C4: got 'n.a.'
## Warning: Expecting numeric in D17842 / R17842C4: got 'n.a.'
## Warning: Expecting numeric in D17843 / R17843C4: got 'n.a.'
## Warning: Expecting numeric in D17844 / R17844C4: got 'n.a.'
## Warning: Expecting numeric in D17845 / R17845C4: got 'n.a.'
## Warning: Expecting numeric in D17846 / R17846C4: got 'n.a.'
## Warning: Expecting numeric in D17847 / R17847C4: got 'n.a.'
## Warning: Expecting numeric in D17848 / R17848C4: got 'n.a.'
## Warning: Expecting numeric in D17849 / R17849C4: got 'n.a.'
## Warning: Expecting numeric in D17850 / R17850C4: got 'n.a.'
## Warning: Expecting numeric in D17851 / R17851C4: got 'n.a.'
## Warning: Expecting numeric in D17852 / R17852C4: got 'n.a.'
## Warning: Expecting numeric in D17853 / R17853C4: got 'n.a.'
## Warning: Expecting numeric in D17854 / R17854C4: got 'n.a.'
## Warning: Expecting numeric in D17855 / R17855C4: got 'n.a.'
## Warning: Expecting numeric in D17856 / R17856C4: got 'n.a.'
## Warning: Expecting numeric in D17857 / R17857C4: got 'n.a.'
## Warning: Expecting numeric in D17858 / R17858C4: got 'n.a.'
## Warning: Expecting numeric in D17859 / R17859C4: got 'n.a.'
## Warning: Expecting numeric in D17860 / R17860C4: got 'n.a.'
## Warning: Expecting numeric in D17861 / R17861C4: got 'n.a.'
## Warning: Expecting numeric in D17862 / R17862C4: got 'n.a.'
## Warning: Expecting numeric in D17863 / R17863C4: got 'n.a.'
## Warning: Expecting numeric in D17864 / R17864C4: got 'n.a.'
## Warning: Expecting numeric in D17865 / R17865C4: got 'n.a.'
## Warning: Expecting numeric in D17866 / R17866C4: got 'n.a.'
## Warning: Expecting numeric in D17867 / R17867C4: got 'n.a.'
## Warning: Expecting numeric in D17868 / R17868C4: got 'n.a.'
## Warning: Expecting numeric in D17869 / R17869C4: got 'n.a.'
## Warning: Expecting numeric in D17870 / R17870C4: got 'n.a.'
## Warning: Expecting numeric in D17871 / R17871C4: got 'n.a.'
## Warning: Expecting numeric in D17872 / R17872C4: got 'n.a.'
## Warning: Expecting numeric in D17873 / R17873C4: got 'n.a.'
## Warning: Expecting numeric in D17874 / R17874C4: got 'n.a.'
## Warning: Expecting numeric in D17875 / R17875C4: got 'n.a.'
## Warning: Expecting numeric in D17876 / R17876C4: got 'n.a.'
## Warning: Expecting numeric in D17877 / R17877C4: got 'n.a.'
## Warning: Expecting numeric in D17878 / R17878C4: got 'n.a.'
## Warning: Expecting numeric in D17879 / R17879C4: got 'n.a.'
## Warning: Expecting numeric in D17880 / R17880C4: got 'n.a.'
## Warning: Expecting numeric in D17881 / R17881C4: got 'n.a.'
## Warning: Expecting numeric in D17882 / R17882C4: got 'n.a.'
## Warning: Expecting numeric in D17883 / R17883C4: got 'n.a.'
## Warning: Expecting numeric in D17884 / R17884C4: got 'n.a.'
## Warning: Expecting numeric in D17885 / R17885C4: got 'n.a.'
## Warning: Expecting numeric in D17886 / R17886C4: got 'n.a.'
## Warning: Expecting numeric in D17887 / R17887C4: got 'n.a.'
## Warning: Expecting numeric in D17888 / R17888C4: got 'n.a.'
## Warning: Expecting numeric in D17889 / R17889C4: got 'n.a.'
## Warning: Expecting numeric in D17890 / R17890C4: got 'n.a.'
## Warning: Expecting numeric in D17891 / R17891C4: got 'n.a.'
## Warning: Expecting numeric in D17892 / R17892C4: got 'n.a.'
## Warning: Expecting numeric in D17893 / R17893C4: got 'n.a.'
## Warning: Expecting numeric in D17894 / R17894C4: got 'n.a.'
## Warning: Expecting numeric in D17895 / R17895C4: got 'n.a.'
## Warning: Expecting numeric in D17896 / R17896C4: got 'n.a.'
## Warning: Expecting numeric in D17897 / R17897C4: got 'n.a.'
## Warning: Expecting numeric in D17898 / R17898C4: got 'n.a.'
## Warning: Expecting numeric in D17899 / R17899C4: got 'n.a.'
## Warning: Expecting numeric in D17900 / R17900C4: got 'n.a.'
## Warning: Expecting numeric in D17901 / R17901C4: got 'n.a.'
## Warning: Expecting numeric in D17902 / R17902C4: got 'n.a.'
## Warning: Expecting numeric in D17903 / R17903C4: got 'n.a.'
## Warning: Expecting numeric in D17904 / R17904C4: got 'n.a.'
## Warning: Expecting numeric in D17905 / R17905C4: got 'n.a.'
## Warning: Expecting numeric in D17906 / R17906C4: got 'n.a.'
## Warning: Expecting numeric in D17907 / R17907C4: got 'n.a.'
## Warning: Expecting numeric in D17908 / R17908C4: got 'n.a.'
## Warning: Expecting numeric in D17909 / R17909C4: got 'n.a.'
## Warning: Expecting numeric in D17910 / R17910C4: got 'n.a.'
## Warning: Expecting numeric in D17911 / R17911C4: got 'n.a.'
## Warning: Expecting numeric in D17912 / R17912C4: got 'n.a.'
## Warning: Expecting numeric in D17913 / R17913C4: got 'n.a.'
## Warning: Expecting numeric in D17914 / R17914C4: got 'n.a.'
## Warning: Expecting numeric in D17915 / R17915C4: got 'n.a.'
## Warning: Expecting numeric in D17916 / R17916C4: got 'n.a.'
## Warning: Expecting numeric in D17917 / R17917C4: got 'n.a.'
## Warning: Expecting numeric in D17918 / R17918C4: got 'n.a.'
## Warning: Expecting numeric in D17919 / R17919C4: got 'n.a.'
## Warning: Expecting numeric in D17920 / R17920C4: got 'n.a.'
## Warning: Expecting numeric in D17921 / R17921C4: got 'n.a.'
## Warning: Expecting numeric in D17922 / R17922C4: got 'n.a.'
## Warning: Expecting numeric in D17923 / R17923C4: got 'n.a.'
## Warning: Expecting numeric in D17924 / R17924C4: got 'n.a.'
## Warning: Expecting numeric in D17925 / R17925C4: got 'n.a.'
## Warning: Expecting numeric in D17926 / R17926C4: got 'n.a.'
## Warning: Expecting numeric in D17927 / R17927C4: got 'n.a.'
## Warning: Expecting numeric in D17928 / R17928C4: got 'n.a.'
## Warning: Expecting numeric in D17929 / R17929C4: got 'n.a.'
## Warning: Expecting numeric in D17930 / R17930C4: got 'n.a.'
## Warning: Expecting numeric in D17931 / R17931C4: got 'n.a.'
## Warning: Expecting numeric in D17932 / R17932C4: got 'n.a.'
## Warning: Expecting numeric in D17933 / R17933C4: got 'n.a.'
## Warning: Expecting numeric in D17934 / R17934C4: got 'n.a.'
## Warning: Expecting numeric in D17935 / R17935C4: got 'n.a.'
## Warning: Expecting numeric in D17936 / R17936C4: got 'n.a.'
## Warning: Expecting numeric in D17937 / R17937C4: got 'n.a.'
## Warning: Expecting numeric in D17938 / R17938C4: got 'n.a.'
## Warning: Expecting numeric in D17939 / R17939C4: got 'n.a.'
## Warning: Expecting numeric in D17940 / R17940C4: got 'n.a.'
## Warning: Expecting numeric in D17941 / R17941C4: got 'n.a.'
## Warning: Expecting numeric in D17942 / R17942C4: got 'n.a.'
## Warning: Expecting numeric in D17943 / R17943C4: got 'n.a.'
## Warning: Expecting numeric in D17944 / R17944C4: got 'n.a.'
## Warning: Expecting numeric in D17945 / R17945C4: got 'n.a.'
## Warning: Expecting numeric in D17946 / R17946C4: got 'n.a.'
## Warning: Expecting numeric in D17947 / R17947C4: got 'n.a.'
## Warning: Expecting numeric in D17948 / R17948C4: got 'n.a.'
## Warning: Expecting numeric in D17949 / R17949C4: got 'n.a.'
## Warning: Expecting numeric in D17950 / R17950C4: got 'n.a.'
## Warning: Expecting numeric in D17951 / R17951C4: got 'n.a.'
## Warning: Expecting numeric in D17952 / R17952C4: got 'n.a.'
## Warning: Expecting numeric in D17953 / R17953C4: got 'n.a.'
## Warning: Expecting numeric in D17954 / R17954C4: got 'n.a.'
## Warning: Expecting numeric in D17955 / R17955C4: got 'n.a.'
## Warning: Expecting numeric in D17956 / R17956C4: got 'n.a.'
## Warning: Expecting numeric in D17957 / R17957C4: got 'n.a.'
## Warning: Expecting numeric in D17958 / R17958C4: got 'n.a.'
## Warning: Expecting numeric in D17959 / R17959C4: got 'n.a.'
## Warning: Expecting numeric in D17960 / R17960C4: got 'n.a.'
## Warning: Expecting numeric in D17961 / R17961C4: got 'n.a.'
## Warning: Expecting numeric in D17962 / R17962C4: got 'n.a.'
## Warning: Expecting numeric in D17963 / R17963C4: got 'n.a.'
## Warning: Expecting numeric in D17964 / R17964C4: got 'n.a.'
## Warning: Expecting numeric in D17965 / R17965C4: got 'n.a.'
## Warning: Expecting numeric in D17966 / R17966C4: got 'n.a.'
## Warning: Expecting numeric in D17967 / R17967C4: got 'n.a.'
## Warning: Expecting numeric in D17968 / R17968C4: got 'n.a.'
## Warning: Expecting numeric in D17969 / R17969C4: got 'n.a.'
## Warning: Expecting numeric in D17970 / R17970C4: got 'n.a.'
## Warning: Expecting numeric in D17971 / R17971C4: got 'n.a.'
## Warning: Expecting numeric in D17972 / R17972C4: got 'n.a.'
## Warning: Expecting numeric in D17973 / R17973C4: got 'n.a.'
## Warning: Expecting numeric in D17974 / R17974C4: got 'n.a.'
## Warning: Expecting numeric in D17975 / R17975C4: got 'n.a.'
## Warning: Expecting numeric in D17976 / R17976C4: got 'n.a.'
## Warning: Expecting numeric in D17977 / R17977C4: got 'n.a.'
## Warning: Expecting numeric in D17978 / R17978C4: got 'n.a.'
## Warning: Expecting numeric in D17979 / R17979C4: got 'n.a.'
## Warning: Expecting numeric in D17980 / R17980C4: got 'n.a.'
## Warning: Expecting numeric in D17981 / R17981C4: got 'n.a.'
## Warning: Expecting numeric in D17982 / R17982C4: got 'n.a.'
## Warning: Expecting numeric in D17983 / R17983C4: got 'n.a.'
## Warning: Expecting numeric in D17984 / R17984C4: got 'n.a.'
## Warning: Expecting numeric in D17985 / R17985C4: got 'n.a.'
## Warning: Expecting numeric in D17986 / R17986C4: got 'n.a.'
## Warning: Expecting numeric in D17987 / R17987C4: got 'n.a.'
## Warning: Expecting numeric in D17988 / R17988C4: got 'n.a.'
## Warning: Expecting numeric in D17989 / R17989C4: got 'n.a.'
## Warning: Expecting numeric in D17990 / R17990C4: got 'n.a.'
## Warning: Expecting numeric in D17991 / R17991C4: got 'n.a.'
## Warning: Expecting numeric in D17992 / R17992C4: got 'n.a.'
## Warning: Expecting numeric in D17993 / R17993C4: got 'n.a.'
## Warning: Expecting numeric in D17994 / R17994C4: got 'n.a.'
## Warning: Expecting numeric in D17995 / R17995C4: got 'n.a.'
## Warning: Expecting numeric in D17996 / R17996C4: got 'n.a.'
## Warning: Expecting numeric in D17997 / R17997C4: got 'n.a.'
## Warning: Expecting numeric in D17998 / R17998C4: got 'n.a.'
## Warning: Expecting numeric in D17999 / R17999C4: got 'n.a.'
## Warning: Expecting numeric in D18000 / R18000C4: got 'n.a.'
## Warning: Expecting numeric in D18001 / R18001C4: got 'n.a.'
## Warning: Expecting numeric in D18002 / R18002C4: got 'n.a.'
## Warning: Expecting numeric in D18003 / R18003C4: got 'n.a.'
## Warning: Expecting numeric in D18004 / R18004C4: got 'n.a.'
## Warning: Expecting numeric in D18005 / R18005C4: got 'n.a.'
## Warning: Expecting numeric in D18006 / R18006C4: got 'n.a.'
## Warning: Expecting numeric in D18007 / R18007C4: got 'n.a.'
## Warning: Expecting numeric in D18008 / R18008C4: got 'n.a.'
## Warning: Expecting numeric in D18009 / R18009C4: got 'n.a.'
## Warning: Expecting numeric in D18010 / R18010C4: got 'n.a.'
## Warning: Expecting numeric in D18011 / R18011C4: got 'n.a.'
## Warning: Expecting numeric in D18012 / R18012C4: got 'n.a.'
## Warning: Expecting numeric in D18013 / R18013C4: got 'n.a.'
## Warning: Expecting numeric in D18014 / R18014C4: got 'n.a.'
## Warning: Expecting numeric in D18015 / R18015C4: got 'n.a.'
## Warning: Expecting numeric in D18016 / R18016C4: got 'n.a.'
## Warning: Expecting numeric in D18017 / R18017C4: got 'n.a.'
## Warning: Expecting numeric in D18018 / R18018C4: got 'n.a.'
## Warning: Expecting numeric in D18019 / R18019C4: got 'n.a.'
## Warning: Expecting numeric in D18020 / R18020C4: got 'n.a.'
## Warning: Expecting numeric in D18021 / R18021C4: got 'n.a.'
## Warning: Expecting numeric in D18022 / R18022C4: got 'n.a.'
## Warning: Expecting numeric in D18023 / R18023C4: got 'n.a.'
## Warning: Expecting numeric in D18024 / R18024C4: got 'n.a.'
## Warning: Expecting numeric in D18025 / R18025C4: got 'n.a.'
## Warning: Expecting numeric in D18026 / R18026C4: got 'n.a.'
## Warning: Expecting numeric in D18027 / R18027C4: got 'n.a.'
## Warning: Expecting numeric in D18028 / R18028C4: got 'n.a.'
## Warning: Expecting numeric in D18029 / R18029C4: got 'n.a.'
## Warning: Expecting numeric in D18030 / R18030C4: got 'n.a.'
## Warning: Expecting numeric in D18031 / R18031C4: got 'n.a.'
## Warning: Expecting numeric in D18032 / R18032C4: got 'n.a.'
## Warning: Expecting numeric in D18033 / R18033C4: got 'n.a.'
## Warning: Expecting numeric in D18034 / R18034C4: got 'n.a.'
## Warning: Expecting numeric in D18035 / R18035C4: got 'n.a.'
## Warning: Expecting numeric in D18036 / R18036C4: got 'n.a.'
## Warning: Expecting numeric in D18037 / R18037C4: got 'n.a.'
## Warning: Expecting numeric in D18038 / R18038C4: got 'n.a.'
## Warning: Expecting numeric in D18039 / R18039C4: got 'n.a.'
## Warning: Expecting numeric in D18040 / R18040C4: got 'n.a.'
## Warning: Expecting numeric in D18041 / R18041C4: got 'n.a.'
## Warning: Expecting numeric in D18042 / R18042C4: got 'n.a.'
## Warning: Expecting numeric in D18043 / R18043C4: got 'n.a.'
## Warning: Expecting numeric in D18044 / R18044C4: got 'n.a.'
## Warning: Expecting numeric in D18045 / R18045C4: got 'n.a.'
## Warning: Expecting numeric in D18046 / R18046C4: got 'n.a.'
## Warning: Expecting numeric in D18047 / R18047C4: got 'n.a.'
## Warning: Expecting numeric in D18048 / R18048C4: got 'n.a.'
## Warning: Expecting numeric in D18049 / R18049C4: got 'n.a.'
## Warning: Expecting numeric in D18050 / R18050C4: got 'n.a.'
## Warning: Expecting numeric in D18051 / R18051C4: got 'n.a.'
## Warning: Expecting numeric in D18052 / R18052C4: got 'n.a.'
## Warning: Expecting numeric in D18053 / R18053C4: got 'n.a.'
## Warning: Expecting numeric in D18054 / R18054C4: got 'n.a.'
## Warning: Expecting numeric in D18055 / R18055C4: got 'n.a.'
## Warning: Expecting numeric in D18056 / R18056C4: got 'n.a.'
## Warning: Expecting numeric in D18057 / R18057C4: got 'n.a.'
## Warning: Expecting numeric in D18058 / R18058C4: got 'n.a.'
## Warning: Expecting numeric in D18059 / R18059C4: got 'n.a.'
## Warning: Expecting numeric in D18060 / R18060C4: got 'n.a.'
## Warning: Expecting numeric in D18061 / R18061C4: got 'n.a.'
## Warning: Expecting numeric in D18062 / R18062C4: got 'n.a.'
## Warning: Expecting numeric in D18063 / R18063C4: got 'n.a.'
## Warning: Expecting numeric in D18064 / R18064C4: got 'n.a.'
## Warning: Expecting numeric in D18065 / R18065C4: got 'n.a.'
## Warning: Expecting numeric in D18066 / R18066C4: got 'n.a.'
## Warning: Expecting numeric in D18067 / R18067C4: got 'n.a.'
## Warning: Expecting numeric in D18068 / R18068C4: got 'n.a.'
## Warning: Expecting numeric in D18069 / R18069C4: got 'n.a.'
## Warning: Expecting numeric in D18070 / R18070C4: got 'n.a.'
## Warning: Expecting numeric in D18071 / R18071C4: got 'n.a.'
## Warning: Expecting numeric in D18072 / R18072C4: got 'n.a.'
## Warning: Expecting numeric in D18073 / R18073C4: got 'n.a.'
## Warning: Expecting numeric in D18074 / R18074C4: got 'n.a.'
## Warning: Expecting numeric in D18075 / R18075C4: got 'n.a.'
## Warning: Expecting numeric in D18076 / R18076C4: got 'n.a.'
## Warning: Expecting numeric in D18077 / R18077C4: got 'n.a.'
## Warning: Expecting numeric in D18078 / R18078C4: got 'n.a.'
## Warning: Expecting numeric in D18079 / R18079C4: got 'n.a.'
## Warning: Expecting numeric in D18080 / R18080C4: got 'n.a.'
## Warning: Expecting numeric in D18081 / R18081C4: got 'n.a.'
## Warning: Expecting numeric in D18082 / R18082C4: got 'n.a.'
## Warning: Expecting numeric in D18083 / R18083C4: got 'n.a.'
## Warning: Expecting numeric in D18084 / R18084C4: got 'n.a.'
## Warning: Expecting numeric in D18085 / R18085C4: got 'n.a.'
## Warning: Expecting numeric in D18086 / R18086C4: got 'n.a.'
## Warning: Expecting numeric in D18087 / R18087C4: got 'n.a.'
## Warning: Expecting numeric in D18088 / R18088C4: got 'n.a.'
## Warning: Expecting numeric in D18089 / R18089C4: got 'n.a.'
## Warning: Expecting numeric in D18090 / R18090C4: got 'n.a.'
## Warning: Expecting numeric in D18091 / R18091C4: got 'n.a.'
## Warning: Expecting numeric in D18092 / R18092C4: got 'n.a.'
## Warning: Expecting numeric in D18093 / R18093C4: got 'n.a.'
## Warning: Expecting numeric in D18094 / R18094C4: got 'n.a.'
## Warning: Expecting numeric in D18095 / R18095C4: got 'n.a.'
## Warning: Expecting numeric in D18096 / R18096C4: got 'n.a.'
## Warning: Expecting numeric in D18097 / R18097C4: got 'n.a.'
## Warning: Expecting numeric in D18098 / R18098C4: got 'n.a.'
## Warning: Expecting numeric in D18099 / R18099C4: got 'n.a.'
## Warning: Expecting numeric in D18100 / R18100C4: got 'n.a.'
## Warning: Expecting numeric in D18101 / R18101C4: got 'n.a.'
## Warning: Expecting numeric in D18102 / R18102C4: got 'n.a.'
## Warning: Expecting numeric in D18103 / R18103C4: got 'n.a.'
## Warning: Expecting numeric in D18104 / R18104C4: got 'n.a.'
## Warning: Expecting numeric in D18105 / R18105C4: got 'n.a.'
## Warning: Expecting numeric in D18106 / R18106C4: got 'n.a.'
## Warning: Expecting numeric in D18107 / R18107C4: got 'n.a.'
## Warning: Expecting numeric in D18108 / R18108C4: got 'n.a.'
## Warning: Expecting numeric in D18109 / R18109C4: got 'n.a.'
## Warning: Expecting numeric in D18110 / R18110C4: got 'n.a.'
## Warning: Expecting numeric in D18111 / R18111C4: got 'n.a.'
## Warning: Expecting numeric in D18112 / R18112C4: got 'n.a.'
## Warning: Expecting numeric in D18113 / R18113C4: got 'n.a.'
## Warning: Expecting numeric in D18114 / R18114C4: got 'n.a.'
## Warning: Expecting numeric in D18115 / R18115C4: got 'n.a.'
## Warning: Expecting numeric in D18116 / R18116C4: got 'n.a.'
## Warning: Expecting numeric in D18117 / R18117C4: got 'n.a.'
## Warning: Expecting numeric in D18118 / R18118C4: got 'n.a.'
## Warning: Expecting numeric in D18119 / R18119C4: got 'n.a.'
## Warning: Expecting numeric in D18120 / R18120C4: got 'n.a.'
## Warning: Expecting numeric in D18121 / R18121C4: got 'n.a.'
## Warning: Expecting numeric in D18122 / R18122C4: got 'n.a.'
## Warning: Expecting numeric in D18123 / R18123C4: got 'n.a.'
## Warning: Expecting numeric in D18124 / R18124C4: got 'n.a.'
## Warning: Expecting numeric in D18125 / R18125C4: got 'n.a.'
## Warning: Expecting numeric in D18126 / R18126C4: got 'n.a.'
## Warning: Expecting numeric in D18127 / R18127C4: got 'n.a.'
## Warning: Expecting numeric in D18128 / R18128C4: got 'n.a.'
## Warning: Expecting numeric in D18129 / R18129C4: got 'n.a.'
## Warning: Expecting numeric in D18130 / R18130C4: got 'n.a.'
## Warning: Expecting numeric in D18131 / R18131C4: got 'n.a.'
## Warning: Expecting numeric in D18132 / R18132C4: got 'n.a.'
## Warning: Expecting numeric in D18133 / R18133C4: got 'n.a.'
## Warning: Expecting numeric in D18134 / R18134C4: got 'n.a.'
## Warning: Expecting numeric in D18135 / R18135C4: got 'n.a.'
## Warning: Expecting numeric in D18136 / R18136C4: got 'n.a.'
## Warning: Expecting numeric in D18137 / R18137C4: got 'n.a.'
## Warning: Expecting numeric in D18138 / R18138C4: got 'n.a.'
## Warning: Expecting numeric in D18139 / R18139C4: got 'n.a.'
## Warning: Expecting numeric in D18140 / R18140C4: got 'n.a.'
## Warning: Expecting numeric in D18141 / R18141C4: got 'n.a.'
## Warning: Expecting numeric in D18142 / R18142C4: got 'n.a.'
## Warning: Expecting numeric in D18143 / R18143C4: got 'n.a.'
## Warning: Expecting numeric in D18144 / R18144C4: got 'n.a.'
## Warning: Expecting numeric in D18145 / R18145C4: got 'n.a.'
## Warning: Expecting numeric in D18146 / R18146C4: got 'n.a.'
## Warning: Expecting numeric in D18147 / R18147C4: got 'n.a.'
## Warning: Expecting numeric in D18148 / R18148C4: got 'n.a.'
## Warning: Expecting numeric in D18149 / R18149C4: got 'n.a.'
## Warning: Expecting numeric in D18150 / R18150C4: got 'n.a.'
## Warning: Expecting numeric in D18151 / R18151C4: got 'n.a.'
## Warning: Expecting numeric in D18152 / R18152C4: got 'n.a.'
## Warning: Expecting numeric in D18153 / R18153C4: got 'n.a.'
## Warning: Expecting numeric in D18154 / R18154C4: got 'n.a.'
## Warning: Expecting numeric in D18155 / R18155C4: got 'n.a.'
## Warning: Expecting numeric in D18156 / R18156C4: got 'n.a.'
## Warning: Expecting numeric in D18157 / R18157C4: got 'n.a.'
## Warning: Expecting numeric in D18158 / R18158C4: got 'n.a.'
## Warning: Expecting numeric in D18159 / R18159C4: got 'n.a.'
## Warning: Expecting numeric in D18160 / R18160C4: got 'n.a.'
## Warning: Expecting numeric in D18161 / R18161C4: got 'n.a.'
## Warning: Expecting numeric in D18162 / R18162C4: got 'n.a.'
## Warning: Expecting numeric in D18163 / R18163C4: got 'n.a.'
## Warning: Expecting numeric in D18164 / R18164C4: got 'n.a.'
## Warning: Expecting numeric in D18165 / R18165C4: got 'n.a.'
## Warning: Expecting numeric in D18166 / R18166C4: got 'n.a.'
## Warning: Expecting numeric in D18167 / R18167C4: got 'n.a.'
## Warning: Expecting numeric in D18168 / R18168C4: got 'n.a.'
## Warning: Expecting numeric in D18169 / R18169C4: got 'n.a.'
## Warning: Expecting numeric in D18170 / R18170C4: got 'n.a.'
## Warning: Expecting numeric in D18171 / R18171C4: got 'n.a.'
## Warning: Expecting numeric in D18172 / R18172C4: got 'n.a.'
## Warning: Expecting numeric in D18173 / R18173C4: got 'n.a.'
## Warning: Expecting numeric in D18174 / R18174C4: got 'n.a.'
## Warning: Expecting numeric in D18175 / R18175C4: got 'n.a.'
## Warning: Expecting numeric in D18176 / R18176C4: got 'n.a.'
## Warning: Expecting numeric in D18177 / R18177C4: got 'n.a.'
## Warning: Expecting numeric in D18178 / R18178C4: got 'n.a.'
## Warning: Expecting numeric in D18179 / R18179C4: got 'n.a.'
## Warning: Expecting numeric in D18180 / R18180C4: got 'n.a.'
## Warning: Expecting numeric in D18181 / R18181C4: got 'n.a.'
## Warning: Expecting numeric in D18182 / R18182C4: got 'n.a.'
## Warning: Expecting numeric in D18183 / R18183C4: got 'n.a.'
## Warning: Expecting numeric in D18184 / R18184C4: got 'n.a.'
## Warning: Expecting numeric in D18185 / R18185C4: got 'n.a.'
## Warning: Expecting numeric in D18186 / R18186C4: got 'n.a.'
## Warning: Expecting numeric in D18187 / R18187C4: got 'n.a.'
## Warning: Expecting numeric in D18188 / R18188C4: got 'n.a.'
## Warning: Expecting numeric in D18189 / R18189C4: got 'n.a.'
## Warning: Expecting numeric in D18190 / R18190C4: got 'n.a.'
## Warning: Expecting numeric in D18191 / R18191C4: got 'n.a.'
## Warning: Expecting numeric in D18192 / R18192C4: got 'n.a.'
## Warning: Expecting numeric in D18193 / R18193C4: got 'n.a.'
## Warning: Expecting numeric in D18194 / R18194C4: got 'n.a.'
## Warning: Expecting numeric in D18195 / R18195C4: got 'n.a.'
## Warning: Expecting numeric in D18196 / R18196C4: got 'n.a.'
## Warning: Expecting numeric in D18197 / R18197C4: got 'n.a.'
## Warning: Expecting numeric in D18198 / R18198C4: got 'n.a.'
## Warning: Expecting numeric in D18199 / R18199C4: got 'n.a.'
## Warning: Expecting numeric in D18200 / R18200C4: got 'n.a.'
## Warning: Expecting numeric in D18201 / R18201C4: got 'n.a.'
## Warning: Expecting numeric in D18202 / R18202C4: got 'n.a.'
## Warning: Expecting numeric in D18203 / R18203C4: got 'n.a.'
## Warning: Expecting numeric in D18204 / R18204C4: got 'n.a.'
## Warning: Expecting numeric in D18205 / R18205C4: got 'n.a.'
## Warning: Expecting numeric in D18206 / R18206C4: got 'n.a.'
## Warning: Expecting numeric in D18207 / R18207C4: got 'n.a.'
## Warning: Expecting numeric in D18208 / R18208C4: got 'n.a.'
## Warning: Expecting numeric in D18209 / R18209C4: got 'n.a.'
## Warning: Expecting numeric in D18210 / R18210C4: got 'n.a.'
## Warning: Expecting numeric in D18211 / R18211C4: got 'n.a.'
## Warning: Expecting numeric in D18212 / R18212C4: got 'n.a.'
## Warning: Expecting numeric in D18213 / R18213C4: got 'n.a.'
## Warning: Expecting numeric in D18214 / R18214C4: got 'n.a.'
## Warning: Expecting numeric in D18215 / R18215C4: got 'n.a.'
## Warning: Expecting numeric in D18216 / R18216C4: got 'n.a.'
## Warning: Expecting numeric in D18217 / R18217C4: got 'n.a.'
## Warning: Expecting numeric in D18218 / R18218C4: got 'n.a.'
## Warning: Expecting numeric in D18219 / R18219C4: got 'n.a.'
## Warning: Expecting numeric in D18220 / R18220C4: got 'n.a.'
## Warning: Expecting numeric in D18221 / R18221C4: got 'n.a.'
## Warning: Expecting numeric in D18222 / R18222C4: got 'n.a.'
## Warning: Expecting numeric in D18223 / R18223C4: got 'n.a.'
## Warning: Expecting numeric in D18224 / R18224C4: got 'n.a.'
## Warning: Expecting numeric in D18225 / R18225C4: got 'n.a.'
## Warning: Expecting numeric in D18226 / R18226C4: got 'n.a.'
## Warning: Expecting numeric in D18227 / R18227C4: got 'n.a.'
## Warning: Expecting numeric in D18228 / R18228C4: got 'n.a.'
## Warning: Expecting numeric in D18229 / R18229C4: got 'n.a.'
## Warning: Expecting numeric in D18230 / R18230C4: got 'n.a.'
## Warning: Expecting numeric in D18231 / R18231C4: got 'n.a.'
## Warning: Expecting numeric in D18232 / R18232C4: got 'n.a.'
## Warning: Expecting numeric in D18233 / R18233C4: got 'n.a.'
## Warning: Expecting numeric in D18234 / R18234C4: got 'n.a.'
## Warning: Expecting numeric in D18235 / R18235C4: got 'n.a.'
## Warning: Expecting numeric in D18236 / R18236C4: got 'n.a.'
## Warning: Expecting numeric in D18237 / R18237C4: got 'n.a.'
## Warning: Expecting numeric in D18238 / R18238C4: got 'n.a.'
## Warning: Expecting numeric in D18239 / R18239C4: got 'n.a.'
## Warning: Expecting numeric in D18240 / R18240C4: got 'n.a.'
## Warning: Expecting numeric in D18241 / R18241C4: got 'n.a.'
## Warning: Expecting numeric in D18242 / R18242C4: got 'n.a.'
## Warning: Expecting numeric in D18243 / R18243C4: got 'n.a.'
## Warning: Expecting numeric in D18244 / R18244C4: got 'n.a.'
## Warning: Expecting numeric in D18245 / R18245C4: got 'n.a.'
## Warning: Expecting numeric in D18246 / R18246C4: got 'n.a.'
## Warning: Expecting numeric in D18247 / R18247C4: got 'n.a.'
## Warning: Expecting numeric in D18248 / R18248C4: got 'n.a.'
## Warning: Expecting numeric in D18249 / R18249C4: got 'n.a.'
## Warning: Expecting numeric in D18250 / R18250C4: got 'n.a.'
## Warning: Expecting numeric in D18251 / R18251C4: got 'n.a.'
## Warning: Expecting numeric in D18252 / R18252C4: got 'n.a.'
## Warning: Expecting numeric in D18253 / R18253C4: got 'n.a.'
## Warning: Expecting numeric in D18254 / R18254C4: got 'n.a.'
## Warning: Expecting numeric in D18255 / R18255C4: got 'n.a.'
## Warning: Expecting numeric in D18256 / R18256C4: got 'n.a.'
## Warning: Expecting numeric in D18257 / R18257C4: got 'n.a.'
## Warning: Expecting numeric in D18258 / R18258C4: got 'n.a.'
## Warning: Expecting numeric in D18259 / R18259C4: got 'n.a.'
## Warning: Expecting numeric in D18260 / R18260C4: got 'n.a.'
## Warning: Expecting numeric in D18261 / R18261C4: got 'n.a.'
## Warning: Expecting numeric in D18262 / R18262C4: got 'n.a.'
## Warning: Expecting numeric in D18263 / R18263C4: got 'n.a.'
## Warning: Expecting numeric in D18264 / R18264C4: got 'n.a.'
## Warning: Expecting numeric in D18265 / R18265C4: got 'n.a.'
## Warning: Expecting numeric in D18266 / R18266C4: got 'n.a.'
## Warning: Expecting numeric in D18267 / R18267C4: got 'n.a.'
## Warning: Expecting numeric in D18268 / R18268C4: got 'n.a.'
## Warning: Expecting numeric in D18269 / R18269C4: got 'n.a.'
## Warning: Expecting numeric in D18270 / R18270C4: got 'n.a.'
## Warning: Expecting numeric in D18271 / R18271C4: got 'n.a.'
## Warning: Expecting numeric in D18272 / R18272C4: got 'n.a.'
## Warning: Expecting numeric in D18273 / R18273C4: got 'n.a.'
## Warning: Expecting numeric in D18274 / R18274C4: got 'n.a.'
## Warning: Expecting numeric in D18275 / R18275C4: got 'n.a.'
## Warning: Expecting numeric in D18276 / R18276C4: got 'n.a.'
## Warning: Expecting numeric in D18277 / R18277C4: got 'n.a.'
## Warning: Expecting numeric in D18278 / R18278C4: got 'n.a.'
## Warning: Expecting numeric in D18279 / R18279C4: got 'n.a.'
## Warning: Expecting numeric in D18280 / R18280C4: got 'n.a.'
## Warning: Expecting numeric in D18281 / R18281C4: got 'n.a.'
## Warning: Expecting numeric in D18282 / R18282C4: got 'n.a.'
## Warning: Expecting numeric in D18283 / R18283C4: got 'n.a.'
## Warning: Expecting numeric in D18284 / R18284C4: got 'n.a.'
## Warning: Expecting numeric in D18285 / R18285C4: got 'n.a.'
## Warning: Expecting numeric in D18286 / R18286C4: got 'n.a.'
## Warning: Expecting numeric in D18287 / R18287C4: got 'n.a.'
## Warning: Expecting numeric in D18288 / R18288C4: got 'n.a.'
## Warning: Expecting numeric in D18289 / R18289C4: got 'n.a.'
## Warning: Expecting numeric in D18290 / R18290C4: got 'n.a.'
## Warning: Expecting numeric in D18291 / R18291C4: got 'n.a.'
## Warning: Expecting numeric in D18292 / R18292C4: got 'n.a.'
## Warning: Expecting numeric in D18293 / R18293C4: got 'n.a.'
## Warning: Expecting numeric in D18294 / R18294C4: got 'n.a.'
## Warning: Expecting numeric in D18295 / R18295C4: got 'n.a.'
## Warning: Expecting numeric in D18296 / R18296C4: got 'n.a.'
## Warning: Expecting numeric in D18297 / R18297C4: got 'n.a.'
## Warning: Expecting numeric in D18298 / R18298C4: got 'n.a.'
## Warning: Expecting numeric in D18299 / R18299C4: got 'n.a.'
## Warning: Expecting numeric in D18300 / R18300C4: got 'n.a.'
## Warning: Expecting numeric in D18301 / R18301C4: got 'n.a.'
## Warning: Expecting numeric in D18302 / R18302C4: got 'n.a.'
## Warning: Expecting numeric in D18303 / R18303C4: got 'n.a.'
## Warning: Expecting numeric in D18304 / R18304C4: got 'n.a.'
## Warning: Expecting numeric in D18305 / R18305C4: got 'n.a.'
## Warning: Expecting numeric in D18306 / R18306C4: got 'n.a.'
## Warning: Expecting numeric in D18307 / R18307C4: got 'n.a.'
## Warning: Expecting numeric in D18308 / R18308C4: got 'n.a.'
## Warning: Expecting numeric in D18309 / R18309C4: got 'n.a.'
## Warning: Expecting numeric in D18310 / R18310C4: got 'n.a.'
## Warning: Expecting numeric in D18311 / R18311C4: got 'n.a.'
## Warning: Expecting numeric in D18312 / R18312C4: got 'n.a.'
## Warning: Expecting numeric in D18313 / R18313C4: got 'n.a.'
## Warning: Expecting numeric in D18314 / R18314C4: got 'n.a.'
## Warning: Expecting numeric in D18315 / R18315C4: got 'n.a.'
## Warning: Expecting numeric in D18316 / R18316C4: got 'n.a.'
## Warning: Expecting numeric in D18317 / R18317C4: got 'n.a.'
## Warning: Expecting numeric in D18318 / R18318C4: got 'n.a.'
## Warning: Expecting numeric in D18319 / R18319C4: got 'n.a.'
## Warning: Expecting numeric in D18320 / R18320C4: got 'n.a.'
## Warning: Expecting numeric in D18321 / R18321C4: got 'n.a.'
## Warning: Expecting numeric in D18322 / R18322C4: got 'n.a.'
## Warning: Expecting numeric in D18323 / R18323C4: got 'n.a.'
## Warning: Expecting numeric in D18324 / R18324C4: got 'n.a.'
## Warning: Expecting numeric in D18325 / R18325C4: got 'n.a.'
## Warning: Expecting numeric in D18326 / R18326C4: got 'n.a.'
## Warning: Expecting numeric in D18327 / R18327C4: got 'n.a.'
## Warning: Expecting numeric in D18328 / R18328C4: got 'n.a.'
## Warning: Expecting numeric in D18329 / R18329C4: got 'n.a.'
## Warning: Expecting numeric in D18330 / R18330C4: got 'n.a.'
## Warning: Expecting numeric in D18331 / R18331C4: got 'n.a.'
## Warning: Expecting numeric in D18332 / R18332C4: got 'n.a.'
## Warning: Expecting numeric in D18333 / R18333C4: got 'n.a.'
## Warning: Expecting numeric in D18334 / R18334C4: got 'n.a.'
## Warning: Expecting numeric in D18335 / R18335C4: got 'n.a.'
## Warning: Expecting numeric in D18336 / R18336C4: got 'n.a.'
## Warning: Expecting numeric in D18337 / R18337C4: got 'n.a.'
## Warning: Expecting numeric in D18338 / R18338C4: got 'n.a.'
## Warning: Expecting numeric in D18339 / R18339C4: got 'n.a.'
## Warning: Expecting numeric in D18340 / R18340C4: got 'n.a.'
## Warning: Expecting numeric in D18341 / R18341C4: got 'n.a.'
## Warning: Expecting numeric in D18342 / R18342C4: got 'n.a.'
## Warning: Expecting numeric in D18343 / R18343C4: got 'n.a.'
## Warning: Expecting numeric in D18344 / R18344C4: got 'n.a.'
## Warning: Expecting numeric in D18345 / R18345C4: got 'n.a.'
## Warning: Expecting numeric in D18346 / R18346C4: got 'n.a.'
## Warning: Expecting numeric in D18347 / R18347C4: got 'n.a.'
## Warning: Expecting numeric in D18348 / R18348C4: got 'n.a.'
## Warning: Expecting numeric in D18349 / R18349C4: got 'n.a.'
## Warning: Expecting numeric in D18350 / R18350C4: got 'n.a.'
## Warning: Expecting numeric in D18351 / R18351C4: got 'n.a.'
## Warning: Expecting numeric in D18352 / R18352C4: got 'n.a.'
## Warning: Expecting numeric in D18353 / R18353C4: got 'n.a.'
## Warning: Expecting numeric in D18354 / R18354C4: got 'n.a.'
## Warning: Expecting numeric in D18355 / R18355C4: got 'n.a.'
## Warning: Expecting numeric in D18356 / R18356C4: got 'n.a.'
## Warning: Expecting numeric in D18357 / R18357C4: got 'n.a.'
## Warning: Expecting numeric in D18358 / R18358C4: got 'n.a.'
## Warning: Expecting numeric in D18359 / R18359C4: got 'n.a.'
## Warning: Expecting numeric in D18360 / R18360C4: got 'n.a.'
## Warning: Expecting numeric in D18361 / R18361C4: got 'n.a.'
## Warning: Expecting numeric in D18362 / R18362C4: got 'n.a.'
## Warning: Expecting numeric in D18363 / R18363C4: got 'n.a.'
## Warning: Expecting numeric in D18364 / R18364C4: got 'n.a.'
## Warning: Expecting numeric in D18365 / R18365C4: got 'n.a.'
## Warning: Expecting numeric in D18366 / R18366C4: got 'n.a.'
## Warning: Expecting numeric in D18367 / R18367C4: got 'n.a.'
## Warning: Expecting numeric in D18368 / R18368C4: got 'n.a.'
## Warning: Expecting numeric in D18369 / R18369C4: got 'n.a.'
## Warning: Expecting numeric in D18370 / R18370C4: got 'n.a.'
## Warning: Expecting numeric in D18371 / R18371C4: got 'n.a.'
## Warning: Expecting numeric in D18372 / R18372C4: got 'n.a.'
## Warning: Expecting numeric in D18373 / R18373C4: got 'n.a.'
## Warning: Expecting numeric in D18374 / R18374C4: got 'n.a.'
## Warning: Expecting numeric in D18375 / R18375C4: got 'n.a.'
## Warning: Expecting numeric in D18376 / R18376C4: got 'n.a.'
## Warning: Expecting numeric in D18377 / R18377C4: got 'n.a.'
## Warning: Expecting numeric in D18378 / R18378C4: got 'n.a.'
## Warning: Expecting numeric in D18379 / R18379C4: got 'n.a.'
## Warning: Expecting numeric in D18380 / R18380C4: got 'n.a.'
## Warning: Expecting numeric in D18381 / R18381C4: got 'n.a.'
## Warning: Expecting numeric in D18382 / R18382C4: got 'n.a.'
## Warning: Expecting numeric in D18383 / R18383C4: got 'n.a.'
## Warning: Expecting numeric in D18384 / R18384C4: got 'n.a.'
## Warning: Expecting numeric in D18385 / R18385C4: got 'n.a.'
## Warning: Expecting numeric in D18386 / R18386C4: got 'n.a.'
## Warning: Expecting numeric in D18387 / R18387C4: got 'n.a.'
## Warning: Expecting numeric in D18388 / R18388C4: got 'n.a.'
## Warning: Expecting numeric in D18389 / R18389C4: got 'n.a.'
## Warning: Expecting numeric in D18390 / R18390C4: got 'n.a.'
## Warning: Expecting numeric in D18391 / R18391C4: got 'n.a.'
## Warning: Expecting numeric in D18392 / R18392C4: got 'n.a.'
## Warning: Expecting numeric in D18393 / R18393C4: got 'n.a.'
## Warning: Expecting numeric in D18394 / R18394C4: got 'n.a.'
## Warning: Expecting numeric in D18395 / R18395C4: got 'n.a.'
## Warning: Expecting numeric in D18396 / R18396C4: got 'n.a.'
## Warning: Expecting numeric in D18397 / R18397C4: got 'n.a.'
## Warning: Expecting numeric in D18398 / R18398C4: got 'n.a.'
## Warning: Expecting numeric in D18399 / R18399C4: got 'n.a.'
## Warning: Expecting numeric in D18400 / R18400C4: got 'n.a.'
## Warning: Expecting numeric in D18401 / R18401C4: got 'n.a.'
## Warning: Expecting numeric in D18402 / R18402C4: got 'n.a.'
## Warning: Expecting numeric in D18403 / R18403C4: got 'n.a.'
## Warning: Expecting numeric in D18404 / R18404C4: got 'n.a.'
## Warning: Expecting numeric in D18405 / R18405C4: got 'n.a.'
## Warning: Expecting numeric in D18406 / R18406C4: got 'n.a.'
## Warning: Expecting numeric in D18407 / R18407C4: got 'n.a.'
## Warning: Expecting numeric in D18408 / R18408C4: got 'n.a.'
## Warning: Expecting numeric in D18409 / R18409C4: got 'n.a.'
## Warning: Expecting numeric in D18410 / R18410C4: got 'n.a.'
## Warning: Expecting numeric in D18411 / R18411C4: got 'n.a.'
## Warning: Expecting numeric in D18412 / R18412C4: got 'n.a.'
## Warning: Expecting numeric in D18413 / R18413C4: got 'n.a.'
## Warning: Expecting numeric in D18414 / R18414C4: got 'n.a.'
## Warning: Expecting numeric in D18415 / R18415C4: got 'n.a.'
## Warning: Expecting numeric in D18416 / R18416C4: got 'n.a.'
## Warning: Expecting numeric in D18417 / R18417C4: got 'n.a.'
## Warning: Expecting numeric in D18418 / R18418C4: got 'n.a.'
## Warning: Expecting numeric in D18419 / R18419C4: got 'n.a.'
## Warning: Expecting numeric in D18420 / R18420C4: got 'n.a.'
## Warning: Expecting numeric in D18421 / R18421C4: got 'n.a.'
## Warning: Expecting numeric in D18422 / R18422C4: got 'n.a.'
## Warning: Expecting numeric in D18423 / R18423C4: got 'n.a.'
## Warning: Expecting numeric in D18424 / R18424C4: got 'n.a.'
## Warning: Expecting numeric in D18425 / R18425C4: got 'n.a.'
## Warning: Expecting numeric in D18426 / R18426C4: got 'n.a.'
## Warning: Expecting numeric in D18427 / R18427C4: got 'n.a.'
## Warning: Expecting numeric in D18428 / R18428C4: got 'n.a.'
## Warning: Expecting numeric in D18429 / R18429C4: got 'n.a.'
## Warning: Expecting numeric in D18430 / R18430C4: got 'n.a.'
## Warning: Expecting numeric in D18431 / R18431C4: got 'n.a.'
## Warning: Expecting numeric in D18432 / R18432C4: got 'n.a.'
## Warning: Expecting numeric in D18433 / R18433C4: got 'n.a.'
## Warning: Expecting numeric in D18434 / R18434C4: got 'n.a.'
## Warning: Expecting numeric in D18435 / R18435C4: got 'n.a.'
## Warning: Expecting numeric in D18436 / R18436C4: got 'n.a.'
## Warning: Expecting numeric in D18437 / R18437C4: got 'n.a.'
## Warning: Expecting numeric in D18438 / R18438C4: got 'n.a.'
## Warning: Expecting numeric in D18439 / R18439C4: got 'n.a.'
## Warning: Expecting numeric in D18440 / R18440C4: got 'n.a.'
## Warning: Expecting numeric in D18441 / R18441C4: got 'n.a.'
## Warning: Expecting numeric in D18442 / R18442C4: got 'n.a.'
## Warning: Expecting numeric in D18443 / R18443C4: got 'n.a.'
## Warning: Expecting numeric in D18444 / R18444C4: got 'n.a.'
## Warning: Expecting numeric in D18445 / R18445C4: got 'n.a.'
## Warning: Expecting numeric in D18446 / R18446C4: got 'n.a.'
## Warning: Expecting numeric in D18447 / R18447C4: got 'n.a.'
## Warning: Expecting numeric in D18448 / R18448C4: got 'n.a.'
## Warning: Expecting numeric in D18449 / R18449C4: got 'n.a.'
## Warning: Expecting numeric in D18450 / R18450C4: got 'n.a.'
## Warning: Expecting numeric in D18451 / R18451C4: got 'n.a.'
## Warning: Expecting numeric in D18452 / R18452C4: got 'n.a.'
## Warning: Expecting numeric in D18453 / R18453C4: got 'n.a.'
## Warning: Expecting numeric in D18454 / R18454C4: got 'n.a.'
## Warning: Expecting numeric in D18455 / R18455C4: got 'n.a.'
## Warning: Expecting numeric in D18456 / R18456C4: got 'n.a.'
## Warning: Expecting numeric in D18457 / R18457C4: got 'n.a.'
## Warning: Expecting numeric in D18458 / R18458C4: got 'n.a.'
## Warning: Expecting numeric in D18459 / R18459C4: got 'n.a.'
## Warning: Expecting numeric in D18460 / R18460C4: got 'n.a.'
## Warning: Expecting numeric in D18461 / R18461C4: got 'n.a.'
## Warning: Expecting numeric in D18462 / R18462C4: got 'n.a.'
## Warning: Expecting numeric in D18463 / R18463C4: got 'n.a.'
## Warning: Expecting numeric in D18464 / R18464C4: got 'n.a.'
## Warning: Expecting numeric in D18465 / R18465C4: got 'n.a.'
## Warning: Expecting numeric in D18466 / R18466C4: got 'n.a.'
## Warning: Expecting numeric in D18467 / R18467C4: got 'n.a.'
## Warning: Expecting numeric in D18468 / R18468C4: got 'n.a.'
## Warning: Expecting numeric in D18469 / R18469C4: got 'n.a.'
## Warning: Expecting numeric in D18470 / R18470C4: got 'n.a.'
## Warning: Expecting numeric in D18471 / R18471C4: got 'n.a.'
## Warning: Expecting numeric in D18472 / R18472C4: got 'n.a.'
## Warning: Expecting numeric in D18473 / R18473C4: got 'n.a.'
## Warning: Expecting numeric in D18474 / R18474C4: got 'n.a.'
## Warning: Expecting numeric in D18475 / R18475C4: got 'n.a.'
## Warning: Expecting numeric in D18476 / R18476C4: got 'n.a.'
## Warning: Expecting numeric in D18477 / R18477C4: got 'n.a.'
## Warning: Expecting numeric in D18478 / R18478C4: got 'n.a.'
## Warning: Expecting numeric in D18479 / R18479C4: got 'n.a.'
## Warning: Expecting numeric in D18480 / R18480C4: got 'n.a.'
## Warning: Expecting numeric in D18481 / R18481C4: got 'n.a.'
## Warning: Expecting numeric in D18482 / R18482C4: got 'n.a.'
## Warning: Expecting numeric in D18483 / R18483C4: got 'n.a.'
## Warning: Expecting numeric in D18484 / R18484C4: got 'n.a.'
## Warning: Expecting numeric in D18485 / R18485C4: got 'n.a.'
## Warning: Expecting numeric in D18486 / R18486C4: got 'n.a.'
## Warning: Expecting numeric in D18487 / R18487C4: got 'n.a.'
## Warning: Expecting numeric in D18488 / R18488C4: got 'n.a.'
## Warning: Expecting numeric in D18489 / R18489C4: got 'n.a.'
## Warning: Expecting numeric in D18490 / R18490C4: got 'n.a.'
## Warning: Expecting numeric in D18491 / R18491C4: got 'n.a.'
## Warning: Expecting numeric in D18492 / R18492C4: got 'n.a.'
## Warning: Expecting numeric in D18493 / R18493C4: got 'n.a.'
## Warning: Expecting numeric in D18494 / R18494C4: got 'n.a.'
## Warning: Expecting numeric in D18495 / R18495C4: got 'n.a.'
## Warning: Expecting numeric in D18496 / R18496C4: got 'n.a.'
## Warning: Expecting numeric in D18497 / R18497C4: got 'n.a.'
## Warning: Expecting numeric in D18498 / R18498C4: got 'n.a.'
## Warning: Expecting numeric in D18499 / R18499C4: got 'n.a.'
## Warning: Expecting numeric in D18500 / R18500C4: got 'n.a.'
## Warning: Expecting numeric in D18501 / R18501C4: got 'n.a.'
## Warning: Expecting numeric in D18502 / R18502C4: got 'n.a.'
## Warning: Expecting numeric in D18503 / R18503C4: got 'n.a.'
## Warning: Expecting numeric in D18504 / R18504C4: got 'n.a.'
## Warning: Expecting numeric in D18505 / R18505C4: got 'n.a.'
## Warning: Expecting numeric in D18506 / R18506C4: got 'n.a.'
## Warning: Expecting numeric in D18507 / R18507C4: got 'n.a.'
## Warning: Expecting numeric in D18508 / R18508C4: got 'n.a.'
## Warning: Expecting numeric in D18509 / R18509C4: got 'n.a.'
## Warning: Expecting numeric in D18510 / R18510C4: got 'n.a.'
## Warning: Expecting numeric in D18511 / R18511C4: got 'n.a.'
## Warning: Expecting numeric in D18512 / R18512C4: got 'n.a.'
## Warning: Expecting numeric in D18513 / R18513C4: got 'n.a.'
## Warning: Expecting numeric in D18514 / R18514C4: got 'n.a.'
## Warning: Expecting numeric in D18515 / R18515C4: got 'n.a.'
## Warning: Expecting numeric in D18516 / R18516C4: got 'n.a.'
## Warning: Expecting numeric in D18517 / R18517C4: got 'n.a.'
## Warning: Expecting numeric in D18518 / R18518C4: got 'n.a.'
## Warning: Expecting numeric in D18519 / R18519C4: got 'n.a.'
## Warning: Expecting numeric in D18520 / R18520C4: got 'n.a.'
## Warning: Expecting numeric in D18521 / R18521C4: got 'n.a.'
## Warning: Expecting numeric in D18522 / R18522C4: got 'n.a.'
## Warning: Expecting numeric in D18523 / R18523C4: got 'n.a.'
## Warning: Expecting numeric in D18524 / R18524C4: got 'n.a.'
## Warning: Expecting numeric in D18525 / R18525C4: got 'n.a.'
## Warning: Expecting numeric in D18526 / R18526C4: got 'n.a.'
## Warning: Expecting numeric in D18527 / R18527C4: got 'n.a.'
## Warning: Expecting numeric in D18528 / R18528C4: got 'n.a.'
## Warning: Expecting numeric in D18529 / R18529C4: got 'n.a.'
## Warning: Expecting numeric in D18530 / R18530C4: got 'n.a.'
## Warning: Expecting numeric in D18531 / R18531C4: got 'n.a.'
## Warning: Expecting numeric in D18532 / R18532C4: got 'n.a.'
## Warning: Expecting numeric in D18533 / R18533C4: got 'n.a.'
## Warning: Expecting numeric in D18534 / R18534C4: got 'n.a.'
## Warning: Expecting numeric in D18535 / R18535C4: got 'n.a.'
## Warning: Expecting numeric in D18536 / R18536C4: got 'n.a.'
## Warning: Expecting numeric in D18537 / R18537C4: got 'n.a.'
## Warning: Expecting numeric in D18538 / R18538C4: got 'n.a.'
## Warning: Expecting numeric in D18539 / R18539C4: got 'n.a.'
## Warning: Expecting numeric in D18540 / R18540C4: got 'n.a.'
## Warning: Expecting numeric in D18541 / R18541C4: got 'n.a.'
## Warning: Expecting numeric in D18542 / R18542C4: got 'n.a.'
## Warning: Expecting numeric in D18543 / R18543C4: got 'n.a.'
## Warning: Expecting numeric in D18544 / R18544C4: got 'n.a.'
## Warning: Expecting numeric in D18545 / R18545C4: got 'n.a.'
## Warning: Expecting numeric in D18546 / R18546C4: got 'n.a.'
## Warning: Expecting numeric in D18547 / R18547C4: got 'n.a.'
## Warning: Expecting numeric in D18548 / R18548C4: got 'n.a.'
## Warning: Expecting numeric in D18549 / R18549C4: got 'n.a.'
## Warning: Expecting numeric in D18550 / R18550C4: got 'n.a.'
## Warning: Expecting numeric in D18551 / R18551C4: got 'n.a.'
## Warning: Expecting numeric in D18552 / R18552C4: got 'n.a.'
## Warning: Expecting numeric in D18553 / R18553C4: got 'n.a.'
## Warning: Expecting numeric in D18554 / R18554C4: got 'n.a.'
## Warning: Expecting numeric in D18555 / R18555C4: got 'n.a.'
## Warning: Expecting numeric in D18556 / R18556C4: got 'n.a.'
## Warning: Expecting numeric in D18557 / R18557C4: got 'n.a.'
## Warning: Expecting numeric in D18558 / R18558C4: got 'n.a.'
## Warning: Expecting numeric in D18559 / R18559C4: got 'n.a.'
## Warning: Expecting numeric in D18560 / R18560C4: got 'n.a.'
## Warning: Expecting numeric in D18561 / R18561C4: got 'n.a.'
## Warning: Expecting numeric in D18562 / R18562C4: got 'n.a.'
## Warning: Expecting numeric in D18563 / R18563C4: got 'n.a.'
## Warning: Expecting numeric in D18564 / R18564C4: got 'n.a.'
## Warning: Expecting numeric in D18565 / R18565C4: got 'n.a.'
## Warning: Expecting numeric in D18566 / R18566C4: got 'n.a.'
## Warning: Expecting numeric in D18567 / R18567C4: got 'n.a.'
## Warning: Expecting numeric in D18568 / R18568C4: got 'n.a.'
## Warning: Expecting numeric in D18569 / R18569C4: got 'n.a.'
## Warning: Expecting numeric in D18570 / R18570C4: got 'n.a.'
## Warning: Expecting numeric in D18571 / R18571C4: got 'n.a.'
## Warning: Expecting numeric in D18572 / R18572C4: got 'n.a.'
## Warning: Expecting numeric in D18573 / R18573C4: got 'n.a.'
## Warning: Expecting numeric in D18574 / R18574C4: got 'n.a.'
## Warning: Expecting numeric in D18575 / R18575C4: got 'n.a.'
## Warning: Expecting numeric in D18576 / R18576C4: got 'n.a.'
## Warning: Expecting numeric in D18577 / R18577C4: got 'n.a.'
## Warning: Expecting numeric in D18578 / R18578C4: got 'n.a.'
## Warning: Expecting numeric in D18579 / R18579C4: got 'n.a.'
## Warning: Expecting numeric in D18580 / R18580C4: got 'n.a.'
## Warning: Expecting numeric in D18581 / R18581C4: got 'n.a.'
## Warning: Expecting numeric in D18582 / R18582C4: got 'n.a.'
## Warning: Expecting numeric in D18583 / R18583C4: got 'n.a.'
## Warning: Expecting numeric in D18584 / R18584C4: got 'n.a.'
## Warning: Expecting numeric in D18585 / R18585C4: got 'n.a.'
## Warning: Expecting numeric in D18586 / R18586C4: got 'n.a.'
## Warning: Expecting numeric in D18587 / R18587C4: got 'n.a.'
## Warning: Expecting numeric in D18588 / R18588C4: got 'n.a.'
## Warning: Expecting numeric in D18589 / R18589C4: got 'n.a.'
## Warning: Expecting numeric in D18590 / R18590C4: got 'n.a.'
## Warning: Expecting numeric in D18591 / R18591C4: got 'n.a.'
## Warning: Expecting numeric in D18592 / R18592C4: got 'n.a.'
## Warning: Expecting numeric in D18593 / R18593C4: got 'n.a.'
## Warning: Expecting numeric in D18594 / R18594C4: got 'n.a.'
## Warning: Expecting numeric in D18595 / R18595C4: got 'n.a.'
## Warning: Expecting numeric in D18596 / R18596C4: got 'n.a.'
## Warning: Expecting numeric in D18597 / R18597C4: got 'n.a.'
## Warning: Expecting numeric in D18598 / R18598C4: got 'n.a.'
## Warning: Expecting numeric in D18599 / R18599C4: got 'n.a.'
## Warning: Expecting numeric in D18600 / R18600C4: got 'n.a.'
## Warning: Expecting numeric in D18601 / R18601C4: got 'n.a.'
## Warning: Expecting numeric in D18602 / R18602C4: got 'n.a.'
## Warning: Expecting numeric in D18603 / R18603C4: got 'n.a.'
## Warning: Expecting numeric in D18604 / R18604C4: got 'n.a.'
## Warning: Expecting numeric in D18605 / R18605C4: got 'n.a.'
## Warning: Expecting numeric in D18606 / R18606C4: got 'n.a.'
## Warning: Expecting numeric in D18607 / R18607C4: got 'n.a.'
## Warning: Expecting numeric in D18608 / R18608C4: got 'n.a.'
## Warning: Expecting numeric in D18609 / R18609C4: got 'n.a.'
## Warning: Expecting numeric in D18610 / R18610C4: got 'n.a.'
## Warning: Expecting numeric in D18611 / R18611C4: got 'n.a.'
## Warning: Expecting numeric in D18612 / R18612C4: got 'n.a.'
## Warning: Expecting numeric in D18613 / R18613C4: got 'n.a.'
## Warning: Expecting numeric in D18614 / R18614C4: got 'n.a.'
## Warning: Expecting numeric in D18615 / R18615C4: got 'n.a.'
## Warning: Expecting numeric in D18616 / R18616C4: got 'n.a.'
## Warning: Expecting numeric in D18617 / R18617C4: got 'n.a.'
## Warning: Expecting numeric in D18618 / R18618C4: got 'n.a.'
## Warning: Expecting numeric in D18619 / R18619C4: got 'n.a.'
## Warning: Expecting numeric in D18620 / R18620C4: got 'n.a.'
## Warning: Expecting numeric in D18621 / R18621C4: got 'n.a.'
## Warning: Expecting numeric in D18622 / R18622C4: got 'n.a.'
## Warning: Expecting numeric in D18623 / R18623C4: got 'n.a.'
## Warning: Expecting numeric in D18624 / R18624C4: got 'n.a.'
## Warning: Expecting numeric in D18625 / R18625C4: got 'n.a.'
## Warning: Expecting numeric in D18626 / R18626C4: got 'n.a.'
## Warning: Expecting numeric in D18627 / R18627C4: got 'n.a.'
## Warning: Expecting numeric in D18628 / R18628C4: got 'n.a.'
## Warning: Expecting numeric in D18629 / R18629C4: got 'n.a.'
## Warning: Expecting numeric in D18630 / R18630C4: got 'n.a.'
## Warning: Expecting numeric in D18631 / R18631C4: got 'n.a.'
## Warning: Expecting numeric in D18632 / R18632C4: got 'n.a.'
## Warning: Expecting numeric in D18633 / R18633C4: got 'n.a.'
## Warning: Expecting numeric in D18634 / R18634C4: got 'n.a.'
## Warning: Expecting numeric in D18635 / R18635C4: got 'n.a.'
## Warning: Expecting numeric in D18636 / R18636C4: got 'n.a.'
## Warning: Expecting numeric in D18637 / R18637C4: got 'n.a.'
## Warning: Expecting numeric in D18638 / R18638C4: got 'n.a.'
## Warning: Expecting numeric in D18639 / R18639C4: got 'n.a.'
## Warning: Expecting numeric in D18640 / R18640C4: got 'n.a.'
## Warning: Expecting numeric in D18641 / R18641C4: got 'n.a.'
## Warning: Expecting numeric in D18642 / R18642C4: got 'n.a.'
## Warning: Expecting numeric in D18643 / R18643C4: got 'n.a.'
## Warning: Expecting numeric in D18644 / R18644C4: got 'n.a.'
## Warning: Expecting numeric in D18645 / R18645C4: got 'n.a.'
## Warning: Expecting numeric in D18646 / R18646C4: got 'n.a.'
## Warning: Expecting numeric in D18647 / R18647C4: got 'n.a.'
## Warning: Expecting numeric in D18648 / R18648C4: got 'n.a.'
## Warning: Expecting numeric in D18649 / R18649C4: got 'n.a.'
## Warning: Expecting numeric in D18650 / R18650C4: got 'n.a.'
## Warning: Expecting numeric in D18651 / R18651C4: got 'n.a.'
## Warning: Expecting numeric in D18652 / R18652C4: got 'n.a.'
## Warning: Expecting numeric in D18653 / R18653C4: got 'n.a.'
## Warning: Expecting numeric in D18654 / R18654C4: got 'n.a.'
## Warning: Expecting numeric in D18655 / R18655C4: got 'n.a.'
## Warning: Expecting numeric in D18656 / R18656C4: got 'n.a.'
## Warning: Expecting numeric in D18657 / R18657C4: got 'n.a.'
## Warning: Expecting numeric in D18658 / R18658C4: got 'n.a.'
## Warning: Expecting numeric in D18659 / R18659C4: got 'n.a.'
## Warning: Expecting numeric in D18660 / R18660C4: got 'n.a.'
## Warning: Expecting numeric in D18661 / R18661C4: got 'n.a.'
## Warning: Expecting numeric in D18662 / R18662C4: got 'n.a.'
## Warning: Expecting numeric in D18663 / R18663C4: got 'n.a.'
## Warning: Expecting numeric in D18664 / R18664C4: got 'n.a.'
## Warning: Expecting numeric in D18665 / R18665C4: got 'n.a.'
## Warning: Expecting numeric in D18666 / R18666C4: got 'n.a.'
## Warning: Expecting numeric in D18667 / R18667C4: got 'n.a.'
## Warning: Expecting numeric in D18668 / R18668C4: got 'n.a.'
## Warning: Expecting numeric in D18669 / R18669C4: got 'n.a.'
## Warning: Expecting numeric in D18670 / R18670C4: got 'n.a.'
## Warning: Expecting numeric in D18671 / R18671C4: got 'n.a.'
## Warning: Expecting numeric in D18672 / R18672C4: got 'n.a.'
## Warning: Expecting numeric in D18673 / R18673C4: got 'n.a.'
## Warning: Expecting numeric in D18674 / R18674C4: got 'n.a.'
## Warning: Expecting numeric in D18675 / R18675C4: got 'n.a.'
## Warning: Expecting numeric in D18676 / R18676C4: got 'n.a.'
## Warning: Expecting numeric in D18677 / R18677C4: got 'n.a.'
## Warning: Expecting numeric in D18678 / R18678C4: got 'n.a.'
## Warning: Expecting numeric in D18679 / R18679C4: got 'n.a.'
## Warning: Expecting numeric in D18680 / R18680C4: got 'n.a.'
## Warning: Expecting numeric in D18681 / R18681C4: got 'n.a.'
## Warning: Expecting numeric in D18682 / R18682C4: got 'n.a.'
## Warning: Expecting numeric in D18683 / R18683C4: got 'n.a.'
## Warning: Expecting numeric in D18684 / R18684C4: got 'n.a.'
## Warning: Expecting numeric in D18685 / R18685C4: got 'n.a.'
## Warning: Expecting numeric in D18686 / R18686C4: got 'n.a.'
## Warning: Expecting numeric in D18687 / R18687C4: got 'n.a.'
## Warning: Expecting numeric in D18688 / R18688C4: got 'n.a.'
## Warning: Expecting numeric in D18689 / R18689C4: got 'n.a.'
## Warning: Expecting numeric in D18690 / R18690C4: got 'n.a.'
## Warning: Expecting numeric in D18691 / R18691C4: got 'n.a.'
## Warning: Expecting numeric in D18692 / R18692C4: got 'n.a.'
## Warning: Expecting numeric in D18693 / R18693C4: got 'n.a.'
## Warning: Expecting numeric in D18694 / R18694C4: got 'n.a.'
## Warning: Expecting numeric in D18695 / R18695C4: got 'n.a.'
## Warning: Expecting numeric in D18696 / R18696C4: got 'n.a.'
## Warning: Expecting numeric in D18697 / R18697C4: got 'n.a.'
## Warning: Expecting numeric in D18698 / R18698C4: got 'n.a.'
## Warning: Expecting numeric in D18699 / R18699C4: got 'n.a.'
## Warning: Expecting numeric in D18700 / R18700C4: got 'n.a.'
## Warning: Expecting numeric in D18701 / R18701C4: got 'n.a.'
## Warning: Expecting numeric in D18702 / R18702C4: got 'n.a.'
## Warning: Expecting numeric in D18703 / R18703C4: got 'n.a.'
## Warning: Expecting numeric in D18704 / R18704C4: got 'n.a.'
## Warning: Expecting numeric in D18705 / R18705C4: got 'n.a.'
## Warning: Expecting numeric in D18706 / R18706C4: got 'n.a.'
## Warning: Expecting numeric in D18707 / R18707C4: got 'n.a.'
## Warning: Expecting numeric in D18708 / R18708C4: got 'n.a.'
## Warning: Expecting numeric in D18709 / R18709C4: got 'n.a.'
## Warning: Expecting numeric in D18710 / R18710C4: got 'n.a.'
## Warning: Expecting numeric in D18711 / R18711C4: got 'n.a.'
## Warning: Expecting numeric in D18712 / R18712C4: got 'n.a.'
## Warning: Expecting numeric in D18713 / R18713C4: got 'n.a.'
## Warning: Expecting numeric in D18714 / R18714C4: got 'n.a.'
## Warning: Expecting numeric in D18715 / R18715C4: got 'n.a.'
## Warning: Expecting numeric in D18716 / R18716C4: got 'n.a.'
## Warning: Expecting numeric in D18717 / R18717C4: got 'n.a.'
## Warning: Expecting numeric in D18718 / R18718C4: got 'n.a.'
## Warning: Expecting numeric in D18719 / R18719C4: got 'n.a.'
## Warning: Expecting numeric in D18720 / R18720C4: got 'n.a.'
## Warning: Expecting numeric in D18721 / R18721C4: got 'n.a.'
## Warning: Expecting numeric in D18722 / R18722C4: got 'n.a.'
## Warning: Expecting numeric in D18723 / R18723C4: got 'n.a.'
## Warning: Expecting numeric in D18724 / R18724C4: got 'n.a.'
## Warning: Expecting numeric in D18725 / R18725C4: got 'n.a.'
## Warning: Expecting numeric in D18726 / R18726C4: got 'n.a.'
## Warning: Expecting numeric in D18727 / R18727C4: got 'n.a.'
## Warning: Expecting numeric in D18728 / R18728C4: got 'n.a.'
## Warning: Expecting numeric in D18729 / R18729C4: got 'n.a.'
## Warning: Expecting numeric in D18730 / R18730C4: got 'n.a.'
## Warning: Expecting numeric in D18731 / R18731C4: got 'n.a.'
## Warning: Expecting numeric in D18732 / R18732C4: got 'n.a.'
## Warning: Expecting numeric in D18733 / R18733C4: got 'n.a.'
## Warning: Expecting numeric in D18734 / R18734C4: got 'n.a.'
## Warning: Expecting numeric in D18735 / R18735C4: got 'n.a.'
## Warning: Expecting numeric in D18736 / R18736C4: got 'n.a.'
## Warning: Expecting numeric in D18737 / R18737C4: got 'n.a.'
## Warning: Expecting numeric in D18738 / R18738C4: got 'n.a.'
## Warning: Expecting numeric in D18739 / R18739C4: got 'n.a.'
## Warning: Expecting numeric in D18740 / R18740C4: got 'n.a.'
## Warning: Expecting numeric in D18741 / R18741C4: got 'n.a.'
## Warning: Expecting numeric in D18742 / R18742C4: got 'n.a.'
## Warning: Expecting numeric in D18743 / R18743C4: got 'n.a.'
## Warning: Expecting numeric in D18744 / R18744C4: got 'n.a.'
## Warning: Expecting numeric in D18745 / R18745C4: got 'n.a.'
## Warning: Expecting numeric in D18746 / R18746C4: got 'n.a.'
## Warning: Expecting numeric in D18747 / R18747C4: got 'n.a.'
## Warning: Expecting numeric in D18748 / R18748C4: got 'n.a.'
## Warning: Expecting numeric in D18749 / R18749C4: got 'n.a.'
## Warning: Expecting numeric in D18750 / R18750C4: got 'n.a.'
## Warning: Expecting numeric in D18751 / R18751C4: got 'n.a.'
## Warning: Expecting numeric in D18752 / R18752C4: got 'n.a.'
## Warning: Expecting numeric in D18753 / R18753C4: got 'n.a.'
## Warning: Expecting numeric in D18754 / R18754C4: got 'n.a.'
## Warning: Expecting numeric in D18755 / R18755C4: got 'n.a.'
## Warning: Expecting numeric in D18756 / R18756C4: got 'n.a.'
## Warning: Expecting numeric in D18757 / R18757C4: got 'n.a.'
## Warning: Expecting numeric in D18758 / R18758C4: got 'n.a.'
## Warning: Expecting numeric in D18759 / R18759C4: got 'n.a.'
## Warning: Expecting numeric in D18760 / R18760C4: got 'n.a.'
## Warning: Expecting numeric in D18761 / R18761C4: got 'n.a.'
## Warning: Expecting numeric in D18762 / R18762C4: got 'n.a.'
## Warning: Expecting numeric in D18763 / R18763C4: got 'n.a.'
## Warning: Expecting numeric in D18764 / R18764C4: got 'n.a.'
## Warning: Expecting numeric in D18765 / R18765C4: got 'n.a.'
## Warning: Expecting numeric in D18766 / R18766C4: got 'n.a.'
## Warning: Expecting numeric in D18767 / R18767C4: got 'n.a.'
## Warning: Expecting numeric in D18768 / R18768C4: got 'n.a.'
## Warning: Expecting numeric in D18769 / R18769C4: got 'n.a.'
## Warning: Expecting numeric in D18770 / R18770C4: got 'n.a.'
## Warning: Expecting numeric in D18771 / R18771C4: got 'n.a.'
## Warning: Expecting numeric in D18772 / R18772C4: got 'n.a.'
## Warning: Expecting numeric in D18773 / R18773C4: got 'n.a.'
## Warning: Expecting numeric in D18774 / R18774C4: got 'n.a.'
## Warning: Expecting numeric in D18775 / R18775C4: got 'n.a.'
## Warning: Expecting numeric in D18776 / R18776C4: got 'n.a.'
## Warning: Expecting numeric in D18777 / R18777C4: got 'n.a.'
## Warning: Expecting numeric in D18778 / R18778C4: got 'n.a.'
## Warning: Expecting numeric in D18779 / R18779C4: got 'n.a.'
## Warning: Expecting numeric in D18780 / R18780C4: got 'n.a.'
## Warning: Expecting numeric in D18781 / R18781C4: got 'n.a.'
## Warning: Expecting numeric in D18782 / R18782C4: got 'n.a.'
## Warning: Expecting numeric in D18783 / R18783C4: got 'n.a.'
## Warning: Expecting numeric in D18784 / R18784C4: got 'n.a.'
## Warning: Expecting numeric in D18785 / R18785C4: got 'n.a.'
## Warning: Expecting numeric in D18786 / R18786C4: got 'n.a.'
## Warning: Expecting numeric in D18787 / R18787C4: got 'n.a.'
## Warning: Expecting numeric in D18788 / R18788C4: got 'n.a.'
## Warning: Expecting numeric in D18789 / R18789C4: got 'n.a.'
## Warning: Expecting numeric in D18790 / R18790C4: got 'n.a.'
## Warning: Expecting numeric in D18791 / R18791C4: got 'n.a.'
## Warning: Expecting numeric in D18792 / R18792C4: got 'n.a.'
## Warning: Expecting numeric in D18793 / R18793C4: got 'n.a.'
## Warning: Expecting numeric in D18794 / R18794C4: got 'n.a.'
## Warning: Expecting numeric in D18795 / R18795C4: got 'n.a.'
## Warning: Expecting numeric in D18796 / R18796C4: got 'n.a.'
## Warning: Expecting numeric in D18797 / R18797C4: got 'n.a.'
## Warning: Expecting numeric in D18798 / R18798C4: got 'n.a.'
## Warning: Expecting numeric in D18799 / R18799C4: got 'n.a.'
## Warning: Expecting numeric in D18800 / R18800C4: got 'n.a.'
## Warning: Expecting numeric in D18801 / R18801C4: got 'n.a.'
## Warning: Expecting numeric in D18802 / R18802C4: got 'n.a.'
## Warning: Expecting numeric in D18803 / R18803C4: got 'n.a.'
## Warning: Expecting numeric in D18804 / R18804C4: got 'n.a.'
## Warning: Expecting numeric in D18805 / R18805C4: got 'n.a.'
## Warning: Expecting numeric in D18806 / R18806C4: got 'n.a.'
## Warning: Expecting numeric in D18807 / R18807C4: got 'n.a.'
## Warning: Expecting numeric in D18808 / R18808C4: got 'n.a.'
## Warning: Expecting numeric in D18809 / R18809C4: got 'n.a.'
## Warning: Expecting numeric in D18810 / R18810C4: got 'n.a.'
## Warning: Expecting numeric in D18811 / R18811C4: got 'n.a.'
## Warning: Expecting numeric in D18812 / R18812C4: got 'n.a.'
## Warning: Expecting numeric in D18813 / R18813C4: got 'n.a.'
## Warning: Expecting numeric in D18814 / R18814C4: got 'n.a.'
## Warning: Expecting numeric in D18815 / R18815C4: got 'n.a.'
## Warning: Expecting numeric in D18816 / R18816C4: got 'n.a.'
## Warning: Expecting numeric in D18817 / R18817C4: got 'n.a.'
## Warning: Expecting numeric in D18818 / R18818C4: got 'n.a.'
## Warning: Expecting numeric in D18819 / R18819C4: got 'n.a.'
## Warning: Expecting numeric in D18820 / R18820C4: got 'n.a.'
## Warning: Expecting numeric in D18821 / R18821C4: got 'n.a.'
## Warning: Expecting numeric in D18822 / R18822C4: got 'n.a.'
## Warning: Expecting numeric in D18823 / R18823C4: got 'n.a.'
## Warning: Expecting numeric in D18824 / R18824C4: got 'n.a.'
## Warning: Expecting numeric in D18825 / R18825C4: got 'n.a.'
## Warning: Expecting numeric in D18826 / R18826C4: got 'n.a.'
## Warning: Expecting numeric in D18827 / R18827C4: got 'n.a.'
## Warning: Expecting numeric in D18828 / R18828C4: got 'n.a.'
## Warning: Expecting numeric in D18829 / R18829C4: got 'n.a.'
## Warning: Expecting numeric in D18830 / R18830C4: got 'n.a.'
## Warning: Expecting numeric in D18831 / R18831C4: got 'n.a.'
## Warning: Expecting numeric in D18832 / R18832C4: got 'n.a.'
## Warning: Expecting numeric in D18833 / R18833C4: got 'n.a.'
## Warning: Expecting numeric in D18834 / R18834C4: got 'n.a.'
## Warning: Expecting numeric in D18835 / R18835C4: got 'n.a.'
## Warning: Expecting numeric in D18836 / R18836C4: got 'n.a.'
## Warning: Expecting numeric in D18837 / R18837C4: got 'n.a.'
## Warning: Expecting numeric in D18838 / R18838C4: got 'n.a.'
## Warning: Expecting numeric in D18839 / R18839C4: got 'n.a.'
## Warning: Expecting numeric in D18840 / R18840C4: got 'n.a.'
## Warning: Expecting numeric in D18841 / R18841C4: got 'n.a.'
## Warning: Expecting numeric in D18842 / R18842C4: got 'n.a.'
## Warning: Expecting numeric in D18843 / R18843C4: got 'n.a.'
## Warning: Expecting numeric in D18844 / R18844C4: got 'n.a.'
## Warning: Expecting numeric in D18845 / R18845C4: got 'n.a.'
## Warning: Expecting numeric in D18846 / R18846C4: got 'n.a.'
## Warning: Expecting numeric in D18847 / R18847C4: got 'n.a.'
## Warning: Expecting numeric in D18848 / R18848C4: got 'n.a.'
## Warning: Expecting numeric in D18849 / R18849C4: got 'n.a.'
## Warning: Expecting numeric in D18850 / R18850C4: got 'n.a.'
## Warning: Expecting numeric in D18851 / R18851C4: got 'n.a.'
## Warning: Expecting numeric in D18852 / R18852C4: got 'n.a.'
## Warning: Expecting numeric in D18853 / R18853C4: got 'n.a.'
## Warning: Expecting numeric in D18854 / R18854C4: got 'n.a.'
## Warning: Expecting numeric in D18855 / R18855C4: got 'n.a.'
## Warning: Expecting numeric in D18856 / R18856C4: got 'n.a.'
## Warning: Expecting numeric in D18857 / R18857C4: got 'n.a.'
## Warning: Expecting numeric in D18858 / R18858C4: got 'n.a.'
## Warning: Expecting numeric in D18859 / R18859C4: got 'n.a.'
## Warning: Expecting numeric in D18860 / R18860C4: got 'n.a.'
## Warning: Expecting numeric in D18861 / R18861C4: got 'n.a.'
## Warning: Expecting numeric in D18862 / R18862C4: got 'n.a.'
## Warning: Expecting numeric in D18863 / R18863C4: got 'n.a.'
## Warning: Expecting numeric in D18864 / R18864C4: got 'n.a.'
## Warning: Expecting numeric in D18865 / R18865C4: got 'n.a.'
## Warning: Expecting numeric in D18866 / R18866C4: got 'n.a.'
## Warning: Expecting numeric in D18867 / R18867C4: got 'n.a.'
## Warning: Expecting numeric in D18868 / R18868C4: got 'n.a.'
## Warning: Expecting numeric in D18869 / R18869C4: got 'n.a.'
## Warning: Expecting numeric in D18870 / R18870C4: got 'n.a.'
## Warning: Expecting numeric in D18871 / R18871C4: got 'n.a.'
## Warning: Expecting numeric in D18872 / R18872C4: got 'n.a.'
## Warning: Expecting numeric in D18873 / R18873C4: got 'n.a.'
## Warning: Expecting numeric in D18874 / R18874C4: got 'n.a.'
## Warning: Expecting numeric in D18875 / R18875C4: got 'n.a.'
## Warning: Expecting numeric in D18876 / R18876C4: got 'n.a.'
## Warning: Expecting numeric in D18877 / R18877C4: got 'n.a.'
## Warning: Expecting numeric in D18878 / R18878C4: got 'n.a.'
## Warning: Expecting numeric in D18879 / R18879C4: got 'n.a.'
## Warning: Expecting numeric in D18880 / R18880C4: got 'n.a.'
## Warning: Expecting numeric in D18881 / R18881C4: got 'n.a.'
## Warning: Expecting numeric in D18882 / R18882C4: got 'n.a.'
## Warning: Expecting numeric in D18883 / R18883C4: got 'n.a.'
## Warning: Expecting numeric in D18884 / R18884C4: got 'n.a.'
## Warning: Expecting numeric in D18885 / R18885C4: got 'n.a.'
## Warning: Expecting numeric in D18886 / R18886C4: got 'n.a.'
## Warning: Expecting numeric in D18887 / R18887C4: got 'n.a.'
## Warning: Expecting numeric in D18888 / R18888C4: got 'n.a.'
## Warning: Expecting numeric in D18889 / R18889C4: got 'n.a.'
## Warning: Expecting numeric in D18890 / R18890C4: got 'n.a.'
## Warning: Expecting numeric in D18891 / R18891C4: got 'n.a.'
## Warning: Expecting numeric in D18892 / R18892C4: got 'n.a.'
## Warning: Expecting numeric in D18893 / R18893C4: got 'n.a.'
## Warning: Expecting numeric in D18894 / R18894C4: got 'n.a.'
## Warning: Expecting numeric in D18895 / R18895C4: got 'n.a.'
## Warning: Expecting numeric in D18896 / R18896C4: got 'n.a.'
## Warning: Expecting numeric in D18897 / R18897C4: got 'n.a.'
## Warning: Expecting numeric in D18898 / R18898C4: got 'n.a.'
## Warning: Expecting numeric in D18899 / R18899C4: got 'n.a.'
## Warning: Expecting numeric in D18900 / R18900C4: got 'n.a.'
## Warning: Expecting numeric in D18901 / R18901C4: got 'n.a.'
## Warning: Expecting numeric in D18902 / R18902C4: got 'n.a.'
## Warning: Expecting numeric in D18903 / R18903C4: got 'n.a.'
## Warning: Expecting numeric in D18904 / R18904C4: got 'n.a.'
## Warning: Expecting numeric in D18905 / R18905C4: got 'n.a.'
## Warning: Expecting numeric in D18906 / R18906C4: got 'n.a.'
## Warning: Expecting numeric in D18907 / R18907C4: got 'n.a.'
## Warning: Expecting numeric in D18908 / R18908C4: got 'n.a.'
## Warning: Expecting numeric in D18909 / R18909C4: got 'n.a.'
## Warning: Expecting numeric in D18910 / R18910C4: got 'n.a.'
## Warning: Expecting numeric in D18911 / R18911C4: got 'n.a.'
## Warning: Expecting numeric in D18912 / R18912C4: got 'n.a.'
## Warning: Expecting numeric in D18913 / R18913C4: got 'n.a.'
## Warning: Expecting numeric in D18914 / R18914C4: got 'n.a.'
## Warning: Expecting numeric in D18915 / R18915C4: got 'n.a.'
## Warning: Expecting numeric in D18916 / R18916C4: got 'n.a.'
## Warning: Expecting numeric in D18917 / R18917C4: got 'n.a.'
## Warning: Expecting numeric in D18918 / R18918C4: got 'n.a.'
## Warning: Expecting numeric in D18919 / R18919C4: got 'n.a.'
## Warning: Expecting numeric in D18920 / R18920C4: got 'n.a.'
## Warning: Expecting numeric in D18921 / R18921C4: got 'n.a.'
## Warning: Expecting numeric in D18922 / R18922C4: got 'n.a.'
## Warning: Expecting numeric in D18923 / R18923C4: got 'n.a.'
## Warning: Expecting numeric in D18924 / R18924C4: got 'n.a.'
## Warning: Expecting numeric in D18925 / R18925C4: got 'n.a.'
## Warning: Expecting numeric in D18926 / R18926C4: got 'n.a.'
## Warning: Expecting numeric in D18927 / R18927C4: got 'n.a.'
## Warning: Expecting numeric in D18928 / R18928C4: got 'n.a.'
## Warning: Expecting numeric in D18929 / R18929C4: got 'n.a.'
## Warning: Expecting numeric in D18930 / R18930C4: got 'n.a.'
## Warning: Expecting numeric in D18931 / R18931C4: got 'n.a.'
## Warning: Expecting numeric in D18932 / R18932C4: got 'n.a.'
## Warning: Expecting numeric in D18933 / R18933C4: got 'n.a.'
## Warning: Expecting numeric in D18934 / R18934C4: got 'n.a.'
## Warning: Expecting numeric in D18935 / R18935C4: got 'n.a.'
## Warning: Expecting numeric in D18936 / R18936C4: got 'n.a.'
## Warning: Expecting numeric in D18937 / R18937C4: got 'n.a.'
## Warning: Expecting numeric in D18938 / R18938C4: got 'n.a.'
## Warning: Expecting numeric in D18939 / R18939C4: got 'n.a.'
## Warning: Expecting numeric in D18940 / R18940C4: got 'n.a.'
## Warning: Expecting numeric in D18941 / R18941C4: got 'n.a.'
## Warning: Expecting numeric in D18942 / R18942C4: got 'n.a.'
## Warning: Expecting numeric in D18943 / R18943C4: got 'n.a.'
## Warning: Expecting numeric in D18944 / R18944C4: got 'n.a.'
## Warning: Expecting numeric in D18945 / R18945C4: got 'n.a.'
## Warning: Expecting numeric in D18946 / R18946C4: got 'n.a.'
## Warning: Expecting numeric in D18947 / R18947C4: got 'n.a.'
## Warning: Expecting numeric in D18948 / R18948C4: got 'n.a.'
## Warning: Expecting numeric in D18949 / R18949C4: got 'n.a.'
## Warning: Expecting numeric in D18950 / R18950C4: got 'n.a.'
## Warning: Expecting numeric in D18951 / R18951C4: got 'n.a.'
## Warning: Expecting numeric in D18952 / R18952C4: got 'n.a.'
## Warning: Expecting numeric in D18953 / R18953C4: got 'n.a.'
## Warning: Expecting numeric in D18954 / R18954C4: got 'n.a.'
## Warning: Expecting numeric in D18955 / R18955C4: got 'n.a.'
## Warning: Expecting numeric in D18956 / R18956C4: got 'n.a.'
## Warning: Expecting numeric in D18957 / R18957C4: got 'n.a.'
## Warning: Expecting numeric in D18958 / R18958C4: got 'n.a.'
## Warning: Expecting numeric in D18959 / R18959C4: got 'n.a.'
## Warning: Expecting numeric in D18960 / R18960C4: got 'n.a.'
## Warning: Expecting numeric in D18961 / R18961C4: got 'n.a.'
## Warning: Expecting numeric in D18962 / R18962C4: got 'n.a.'
## Warning: Expecting numeric in D18963 / R18963C4: got 'n.a.'
## Warning: Expecting numeric in D18964 / R18964C4: got 'n.a.'
## Warning: Expecting numeric in D18965 / R18965C4: got 'n.a.'
## Warning: Expecting numeric in D18966 / R18966C4: got 'n.a.'
## Warning: Expecting numeric in D18967 / R18967C4: got 'n.a.'
## Warning: Expecting numeric in D18968 / R18968C4: got 'n.a.'
## Warning: Expecting numeric in D18969 / R18969C4: got 'n.a.'
## Warning: Expecting numeric in D18970 / R18970C4: got 'n.a.'
## Warning: Expecting numeric in D18971 / R18971C4: got 'n.a.'
## Warning: Expecting numeric in D18972 / R18972C4: got 'n.a.'
## Warning: Expecting numeric in D18973 / R18973C4: got 'n.a.'
## Warning: Expecting numeric in D18974 / R18974C4: got 'n.a.'
## Warning: Expecting numeric in D18975 / R18975C4: got 'n.a.'
## Warning: Expecting numeric in D18976 / R18976C4: got 'n.a.'
## Warning: Expecting numeric in D18977 / R18977C4: got 'n.a.'
## Warning: Expecting numeric in D18978 / R18978C4: got 'n.a.'
## Warning: Expecting numeric in D18979 / R18979C4: got 'n.a.'
## Warning: Expecting numeric in D18980 / R18980C4: got 'n.a.'
## Warning: Expecting numeric in D18981 / R18981C4: got 'n.a.'
## Warning: Expecting numeric in D18982 / R18982C4: got 'n.a.'
## Warning: Expecting numeric in D18983 / R18983C4: got 'n.a.'
## Warning: Expecting numeric in D18984 / R18984C4: got 'n.a.'
## Warning: Expecting numeric in D18985 / R18985C4: got 'n.a.'
## Warning: Expecting numeric in D18986 / R18986C4: got 'n.a.'
## Warning: Expecting numeric in D18987 / R18987C4: got 'n.a.'
## Warning: Expecting numeric in D18988 / R18988C4: got 'n.a.'
## Warning: Expecting numeric in D18989 / R18989C4: got 'n.a.'
## Warning: Expecting numeric in D18990 / R18990C4: got 'n.a.'
## Warning: Expecting numeric in D18991 / R18991C4: got 'n.a.'
## Warning: Expecting numeric in D18992 / R18992C4: got 'n.a.'
## Warning: Expecting numeric in D18993 / R18993C4: got 'n.a.'
## Warning: Expecting numeric in D18994 / R18994C4: got 'n.a.'
## Warning: Expecting numeric in D18995 / R18995C4: got 'n.a.'
## Warning: Expecting numeric in D18996 / R18996C4: got 'n.a.'
## Warning: Expecting numeric in D18997 / R18997C4: got 'n.a.'
## Warning: Expecting numeric in D18998 / R18998C4: got 'n.a.'
## Warning: Expecting numeric in D18999 / R18999C4: got 'n.a.'
## Warning: Expecting numeric in D19000 / R19000C4: got 'n.a.'
## Warning: Expecting numeric in D19001 / R19001C4: got 'n.a.'
## Warning: Expecting numeric in D19002 / R19002C4: got 'n.a.'
## Warning: Expecting numeric in D19003 / R19003C4: got 'n.a.'
## Warning: Expecting numeric in D19004 / R19004C4: got 'n.a.'
## Warning: Expecting numeric in D19005 / R19005C4: got 'n.a.'
## Warning: Expecting numeric in D19006 / R19006C4: got 'n.a.'
## Warning: Expecting numeric in D19007 / R19007C4: got 'n.a.'
## Warning: Expecting numeric in D19008 / R19008C4: got 'n.a.'
## Warning: Expecting numeric in D19009 / R19009C4: got 'n.a.'
## Warning: Expecting numeric in D19010 / R19010C4: got 'n.a.'
## Warning: Expecting numeric in D19011 / R19011C4: got 'n.a.'
## Warning: Expecting numeric in D19012 / R19012C4: got 'n.a.'
## Warning: Expecting numeric in D19013 / R19013C4: got 'n.a.'
## Warning: Expecting numeric in D19014 / R19014C4: got 'n.a.'
## Warning: Expecting numeric in D19015 / R19015C4: got 'n.a.'
## Warning: Expecting numeric in D19016 / R19016C4: got 'n.a.'
## Warning: Expecting numeric in D19017 / R19017C4: got 'n.a.'
## Warning: Expecting numeric in D19018 / R19018C4: got 'n.a.'
## Warning: Expecting numeric in D19019 / R19019C4: got 'n.a.'
## Warning: Expecting numeric in D19020 / R19020C4: got 'n.a.'
## Warning: Expecting numeric in D19021 / R19021C4: got 'n.a.'
## Warning: Expecting numeric in D19022 / R19022C4: got 'n.a.'
## Warning: Expecting numeric in D19023 / R19023C4: got 'n.a.'
## Warning: Expecting numeric in D19024 / R19024C4: got 'n.a.'
## Warning: Expecting numeric in D19025 / R19025C4: got 'n.a.'
## Warning: Expecting numeric in D19026 / R19026C4: got 'n.a.'
## Warning: Expecting numeric in D19027 / R19027C4: got 'n.a.'
## Warning: Expecting numeric in D19028 / R19028C4: got 'n.a.'
## Warning: Expecting numeric in D19029 / R19029C4: got 'n.a.'
## Warning: Expecting numeric in D19030 / R19030C4: got 'n.a.'
## Warning: Expecting numeric in D19031 / R19031C4: got 'n.a.'
## Warning: Expecting numeric in D19032 / R19032C4: got 'n.a.'
## Warning: Expecting numeric in D19033 / R19033C4: got 'n.a.'
## Warning: Expecting numeric in D19034 / R19034C4: got 'n.a.'
## Warning: Expecting numeric in D19035 / R19035C4: got 'n.a.'
## Warning: Expecting numeric in D19036 / R19036C4: got 'n.a.'
## Warning: Expecting numeric in D19037 / R19037C4: got 'n.a.'
## Warning: Expecting numeric in D19038 / R19038C4: got 'n.a.'
## Warning: Expecting numeric in D19039 / R19039C4: got 'n.a.'
## Warning: Expecting numeric in D19040 / R19040C4: got 'n.a.'
## Warning: Expecting numeric in D19041 / R19041C4: got 'n.a.'
## Warning: Expecting numeric in D19042 / R19042C4: got 'n.a.'
## Warning: Expecting numeric in D19043 / R19043C4: got 'n.a.'
## Warning: Expecting numeric in D19044 / R19044C4: got 'n.a.'
## Warning: Expecting numeric in D19045 / R19045C4: got 'n.a.'
## Warning: Expecting numeric in D19046 / R19046C4: got 'n.a.'
## Warning: Expecting numeric in D19047 / R19047C4: got 'n.a.'
## Warning: Expecting numeric in D19048 / R19048C4: got 'n.a.'
## Warning: Expecting numeric in D19049 / R19049C4: got 'n.a.'
## Warning: Expecting numeric in D19050 / R19050C4: got 'n.a.'
## Warning: Expecting numeric in D19051 / R19051C4: got 'n.a.'
## Warning: Expecting numeric in D19052 / R19052C4: got 'n.a.'
## Warning: Expecting numeric in D19053 / R19053C4: got 'n.a.'
## Warning: Expecting numeric in D19054 / R19054C4: got 'n.a.'
## Warning: Expecting numeric in D19055 / R19055C4: got 'n.a.'
## Warning: Expecting numeric in D19056 / R19056C4: got 'n.a.'
## Warning: Expecting numeric in D19057 / R19057C4: got 'n.a.'
## Warning: Expecting numeric in D19058 / R19058C4: got 'n.a.'
## Warning: Expecting numeric in D19059 / R19059C4: got 'n.a.'
## Warning: Expecting numeric in D19060 / R19060C4: got 'n.a.'
## Warning: Expecting numeric in D19061 / R19061C4: got 'n.a.'
## Warning: Expecting numeric in D19062 / R19062C4: got 'n.a.'
## Warning: Expecting numeric in D19063 / R19063C4: got 'n.a.'
## Warning: Expecting numeric in D19064 / R19064C4: got 'n.a.'
## Warning: Expecting numeric in D19065 / R19065C4: got 'n.a.'
## Warning: Expecting numeric in D19066 / R19066C4: got 'n.a.'
## Warning: Expecting numeric in D19067 / R19067C4: got 'n.a.'
## Warning: Expecting numeric in D19068 / R19068C4: got 'n.a.'
## Warning: Expecting numeric in D19069 / R19069C4: got 'n.a.'
## Warning: Expecting numeric in D19070 / R19070C4: got 'n.a.'
## Warning: Expecting numeric in D19071 / R19071C4: got 'n.a.'
## Warning: Expecting numeric in D19072 / R19072C4: got 'n.a.'
## Warning: Expecting numeric in D19073 / R19073C4: got 'n.a.'
## Warning: Expecting numeric in D19074 / R19074C4: got 'n.a.'
## Warning: Expecting numeric in D19075 / R19075C4: got 'n.a.'
## Warning: Expecting numeric in D19076 / R19076C4: got 'n.a.'
## Warning: Expecting numeric in D19077 / R19077C4: got 'n.a.'
## Warning: Expecting numeric in D19078 / R19078C4: got 'n.a.'
## Warning: Expecting numeric in D19079 / R19079C4: got 'n.a.'
## Warning: Expecting numeric in D19080 / R19080C4: got 'n.a.'
## Warning: Expecting numeric in D19081 / R19081C4: got 'n.a.'
## Warning: Expecting numeric in D19082 / R19082C4: got 'n.a.'
## Warning: Expecting numeric in D19083 / R19083C4: got 'n.a.'
## Warning: Expecting numeric in D19084 / R19084C4: got 'n.a.'
## Warning: Expecting numeric in D19085 / R19085C4: got 'n.a.'
## Warning: Expecting numeric in D19086 / R19086C4: got 'n.a.'
## Warning: Expecting numeric in D19087 / R19087C4: got 'n.a.'
## Warning: Expecting numeric in D19088 / R19088C4: got 'n.a.'
## Warning: Expecting numeric in D19089 / R19089C4: got 'n.a.'
## Warning: Expecting numeric in D19090 / R19090C4: got 'n.a.'
## Warning: Expecting numeric in D19091 / R19091C4: got 'n.a.'
## Warning: Expecting numeric in D19092 / R19092C4: got 'n.a.'
## Warning: Expecting numeric in D19093 / R19093C4: got 'n.a.'
## Warning: Expecting numeric in D19094 / R19094C4: got 'n.a.'
## Warning: Expecting numeric in D19095 / R19095C4: got 'n.a.'
## Warning: Expecting numeric in D19096 / R19096C4: got 'n.a.'
## Warning: Expecting numeric in D19097 / R19097C4: got 'n.a.'
## Warning: Expecting numeric in D19098 / R19098C4: got 'n.a.'
## Warning: Expecting numeric in D19099 / R19099C4: got 'n.a.'
## Warning: Expecting numeric in D19100 / R19100C4: got 'n.a.'
## Warning: Expecting numeric in D19101 / R19101C4: got 'n.a.'
## Warning: Expecting numeric in D19102 / R19102C4: got 'n.a.'
## Warning: Expecting numeric in D19103 / R19103C4: got 'n.a.'
## Warning: Expecting numeric in D19104 / R19104C4: got 'n.a.'
## Warning: Expecting numeric in D19105 / R19105C4: got 'n.a.'
## Warning: Expecting numeric in D19106 / R19106C4: got 'n.a.'
## Warning: Expecting numeric in D19107 / R19107C4: got 'n.a.'
## Warning: Expecting numeric in D19108 / R19108C4: got 'n.a.'
## Warning: Expecting numeric in D19109 / R19109C4: got 'n.a.'
## Warning: Expecting numeric in D19110 / R19110C4: got 'n.a.'
## Warning: Expecting numeric in D19111 / R19111C4: got 'n.a.'
## Warning: Expecting numeric in D19112 / R19112C4: got 'n.a.'
## Warning: Expecting numeric in D19113 / R19113C4: got 'n.a.'
## Warning: Expecting numeric in D19114 / R19114C4: got 'n.a.'
## Warning: Expecting numeric in D19115 / R19115C4: got 'n.a.'
## Warning: Expecting numeric in D19116 / R19116C4: got 'n.a.'
## Warning: Expecting numeric in D19117 / R19117C4: got 'n.a.'
## Warning: Expecting numeric in D19118 / R19118C4: got 'n.a.'
## Warning: Expecting numeric in D19119 / R19119C4: got 'n.a.'
## Warning: Expecting numeric in D19120 / R19120C4: got 'n.a.'
## Warning: Expecting numeric in D19121 / R19121C4: got 'n.a.'
## Warning: Expecting numeric in D19122 / R19122C4: got 'n.a.'
## Warning: Expecting numeric in D19123 / R19123C4: got 'n.a.'
## Warning: Expecting numeric in D19124 / R19124C4: got 'n.a.'
## Warning: Expecting numeric in D19125 / R19125C4: got 'n.a.'
## Warning: Expecting numeric in D19126 / R19126C4: got 'n.a.'
## Warning: Expecting numeric in D19127 / R19127C4: got 'n.a.'
## Warning: Expecting numeric in D19128 / R19128C4: got 'n.a.'
## Warning: Expecting numeric in D19129 / R19129C4: got 'n.a.'
## Warning: Expecting numeric in D19130 / R19130C4: got 'n.a.'
## Warning: Expecting numeric in D19131 / R19131C4: got 'n.a.'
## Warning: Expecting numeric in D19132 / R19132C4: got 'n.a.'
## Warning: Expecting numeric in D19133 / R19133C4: got 'n.a.'
## Warning: Expecting numeric in D19134 / R19134C4: got 'n.a.'
## Warning: Expecting numeric in D19135 / R19135C4: got 'n.a.'
## Warning: Expecting numeric in D19136 / R19136C4: got 'n.a.'
## Warning: Expecting numeric in D19137 / R19137C4: got 'n.a.'
## Warning: Expecting numeric in D19138 / R19138C4: got 'n.a.'
## Warning: Expecting numeric in D19139 / R19139C4: got 'n.a.'
## Warning: Expecting numeric in D19140 / R19140C4: got 'n.a.'
## Warning: Expecting numeric in D19141 / R19141C4: got 'n.a.'
## Warning: Expecting numeric in D19142 / R19142C4: got 'n.a.'
## Warning: Expecting numeric in D19143 / R19143C4: got 'n.a.'
## Warning: Expecting numeric in D19144 / R19144C4: got 'n.a.'
## Warning: Expecting numeric in D19145 / R19145C4: got 'n.a.'
## Warning: Expecting numeric in D19146 / R19146C4: got 'n.a.'
## Warning: Expecting numeric in D19147 / R19147C4: got 'n.a.'
## Warning: Expecting numeric in D19148 / R19148C4: got 'n.a.'
## Warning: Expecting numeric in D19149 / R19149C4: got 'n.a.'
## Warning: Expecting numeric in D19150 / R19150C4: got 'n.a.'
## Warning: Expecting numeric in D19151 / R19151C4: got 'n.a.'
## Warning: Expecting numeric in D19152 / R19152C4: got 'n.a.'
## Warning: Expecting numeric in D19153 / R19153C4: got 'n.a.'
## Warning: Expecting numeric in D19154 / R19154C4: got 'n.a.'
## Warning: Expecting numeric in D19155 / R19155C4: got 'n.a.'
## Warning: Expecting numeric in D19156 / R19156C4: got 'n.a.'
## Warning: Expecting numeric in D19157 / R19157C4: got 'n.a.'
## Warning: Expecting numeric in D19158 / R19158C4: got 'n.a.'
## Warning: Expecting numeric in D19159 / R19159C4: got 'n.a.'
## Warning: Expecting numeric in D19160 / R19160C4: got 'n.a.'
## Warning: Expecting numeric in D19161 / R19161C4: got 'n.a.'
## Warning: Expecting numeric in D19162 / R19162C4: got 'n.a.'
## Warning: Expecting numeric in D19163 / R19163C4: got 'n.a.'
## Warning: Expecting numeric in D19164 / R19164C4: got 'n.a.'
## Warning: Expecting numeric in D19165 / R19165C4: got 'n.a.'
## Warning: Expecting numeric in D19166 / R19166C4: got 'n.a.'
## Warning: Expecting numeric in D19167 / R19167C4: got 'n.a.'
## Warning: Expecting numeric in D19168 / R19168C4: got 'n.a.'
## Warning: Expecting numeric in D19169 / R19169C4: got 'n.a.'
## Warning: Expecting numeric in D19170 / R19170C4: got 'n.a.'
## Warning: Expecting numeric in D19171 / R19171C4: got 'n.a.'
## Warning: Expecting numeric in D19172 / R19172C4: got 'n.a.'
## Warning: Expecting numeric in D19173 / R19173C4: got 'n.a.'
## Warning: Expecting numeric in D19174 / R19174C4: got 'n.a.'
## Warning: Expecting numeric in D19175 / R19175C4: got 'n.a.'
## Warning: Expecting numeric in D19176 / R19176C4: got 'n.a.'
## Warning: Expecting numeric in D19177 / R19177C4: got 'n.a.'
## Warning: Expecting numeric in D19178 / R19178C4: got 'n.a.'
## Warning: Expecting numeric in D19179 / R19179C4: got 'n.a.'
## Warning: Expecting numeric in D19180 / R19180C4: got 'n.a.'
## Warning: Expecting numeric in D19181 / R19181C4: got 'n.a.'
## Warning: Expecting numeric in D19182 / R19182C4: got 'n.a.'
## Warning: Expecting numeric in D19183 / R19183C4: got 'n.a.'
## Warning: Expecting numeric in D19184 / R19184C4: got 'n.a.'
## Warning: Expecting numeric in D19185 / R19185C4: got 'n.a.'
## Warning: Expecting numeric in D19186 / R19186C4: got 'n.a.'
## Warning: Expecting numeric in D19187 / R19187C4: got 'n.a.'
## Warning: Expecting numeric in D19188 / R19188C4: got 'n.a.'
## Warning: Expecting numeric in D19189 / R19189C4: got 'n.a.'
## Warning: Expecting numeric in D19190 / R19190C4: got 'n.a.'
## Warning: Expecting numeric in D19191 / R19191C4: got 'n.a.'
## Warning: Expecting numeric in D19192 / R19192C4: got 'n.a.'
## Warning: Expecting numeric in D19193 / R19193C4: got 'n.a.'
## Warning: Expecting numeric in D19194 / R19194C4: got 'n.a.'
## Warning: Expecting numeric in D19195 / R19195C4: got 'n.a.'
## Warning: Expecting numeric in D19196 / R19196C4: got 'n.a.'
## Warning: Expecting numeric in D19197 / R19197C4: got 'n.a.'
## Warning: Expecting numeric in D19198 / R19198C4: got 'n.a.'
## Warning: Expecting numeric in D19199 / R19199C4: got 'n.a.'
## Warning: Expecting numeric in D19200 / R19200C4: got 'n.a.'
## Warning: Expecting numeric in D19201 / R19201C4: got 'n.a.'
## Warning: Expecting numeric in D19202 / R19202C4: got 'n.a.'
## Warning: Expecting numeric in D19203 / R19203C4: got 'n.a.'
## Warning: Expecting numeric in D19204 / R19204C4: got 'n.a.'
## Warning: Expecting numeric in D19205 / R19205C4: got 'n.a.'
## Warning: Expecting numeric in D19206 / R19206C4: got 'n.a.'
## Warning: Expecting numeric in D19207 / R19207C4: got 'n.a.'
## Warning: Expecting numeric in D19208 / R19208C4: got 'n.a.'
## Warning: Expecting numeric in D19209 / R19209C4: got 'n.a.'
## Warning: Expecting numeric in D19210 / R19210C4: got 'n.a.'
## Warning: Expecting numeric in D19211 / R19211C4: got 'n.a.'
## Warning: Expecting numeric in D19212 / R19212C4: got 'n.a.'
## Warning: Expecting numeric in D19213 / R19213C4: got 'n.a.'
## Warning: Expecting numeric in D19214 / R19214C4: got 'n.a.'
## Warning: Expecting numeric in D19215 / R19215C4: got 'n.a.'
## Warning: Expecting numeric in D19216 / R19216C4: got 'n.a.'
## Warning: Expecting numeric in D19217 / R19217C4: got 'n.a.'
## Warning: Expecting numeric in D19218 / R19218C4: got 'n.a.'
## Warning: Expecting numeric in D19219 / R19219C4: got 'n.a.'
## Warning: Expecting numeric in D19220 / R19220C4: got 'n.a.'
## Warning: Expecting numeric in D19221 / R19221C4: got 'n.a.'
## Warning: Expecting numeric in D19222 / R19222C4: got 'n.a.'
## Warning: Expecting numeric in D19223 / R19223C4: got 'n.a.'
## Warning: Expecting numeric in D19224 / R19224C4: got 'n.a.'
## Warning: Expecting numeric in D19225 / R19225C4: got 'n.a.'
## Warning: Expecting numeric in D19226 / R19226C4: got 'n.a.'
## Warning: Expecting numeric in D19227 / R19227C4: got 'n.a.'
## Warning: Expecting numeric in D19228 / R19228C4: got 'n.a.'
## Warning: Expecting numeric in D19229 / R19229C4: got 'n.a.'
## Warning: Expecting numeric in D19230 / R19230C4: got 'n.a.'
## Warning: Expecting numeric in D19231 / R19231C4: got 'n.a.'
## Warning: Expecting numeric in D19232 / R19232C4: got 'n.a.'
## Warning: Expecting numeric in D19233 / R19233C4: got 'n.a.'
## Warning: Expecting numeric in D19234 / R19234C4: got 'n.a.'
## Warning: Expecting numeric in D19235 / R19235C4: got 'n.a.'
## Warning: Expecting numeric in D19236 / R19236C4: got 'n.a.'
## Warning: Expecting numeric in D19237 / R19237C4: got 'n.a.'
## Warning: Expecting numeric in D19238 / R19238C4: got 'n.a.'
## Warning: Expecting numeric in D19239 / R19239C4: got 'n.a.'
## Warning: Expecting numeric in D19240 / R19240C4: got 'n.a.'
## Warning: Expecting numeric in D19241 / R19241C4: got 'n.a.'
## Warning: Expecting numeric in D19242 / R19242C4: got 'n.a.'
## Warning: Expecting numeric in D19243 / R19243C4: got 'n.a.'
## Warning: Expecting numeric in D19244 / R19244C4: got 'n.a.'
## Warning: Expecting numeric in D19245 / R19245C4: got 'n.a.'
## Warning: Expecting numeric in D19246 / R19246C4: got 'n.a.'
## Warning: Expecting numeric in D19247 / R19247C4: got 'n.a.'
## Warning: Expecting numeric in D19248 / R19248C4: got 'n.a.'
## Warning: Expecting numeric in D19249 / R19249C4: got 'n.a.'
## Warning: Expecting numeric in D19250 / R19250C4: got 'n.a.'
## Warning: Expecting numeric in D19251 / R19251C4: got 'n.a.'
## Warning: Expecting numeric in D19252 / R19252C4: got 'n.a.'
## Warning: Expecting numeric in D19253 / R19253C4: got 'n.a.'
## Warning: Expecting numeric in D19254 / R19254C4: got 'n.a.'
## Warning: Expecting numeric in D19255 / R19255C4: got 'n.a.'
## Warning: Expecting numeric in D19256 / R19256C4: got 'n.a.'
## Warning: Expecting numeric in D19257 / R19257C4: got 'n.a.'
## Warning: Expecting numeric in D19258 / R19258C4: got 'n.a.'
## Warning: Expecting numeric in D19259 / R19259C4: got 'n.a.'
## Warning: Expecting numeric in D19260 / R19260C4: got 'n.a.'
## Warning: Expecting numeric in D19261 / R19261C4: got 'n.a.'
## Warning: Expecting numeric in D19262 / R19262C4: got 'n.a.'
## Warning: Expecting numeric in D19263 / R19263C4: got 'n.a.'
## Warning: Expecting numeric in D19264 / R19264C4: got 'n.a.'
## Warning: Expecting numeric in D19265 / R19265C4: got 'n.a.'
## Warning: Expecting numeric in D19266 / R19266C4: got 'n.a.'
## Warning: Expecting numeric in D19267 / R19267C4: got 'n.a.'
## Warning: Expecting numeric in D19268 / R19268C4: got 'n.a.'
## Warning: Expecting numeric in D19269 / R19269C4: got 'n.a.'
## Warning: Expecting numeric in D19270 / R19270C4: got 'n.a.'
## Warning: Expecting numeric in D19271 / R19271C4: got 'n.a.'
## Warning: Expecting numeric in D19272 / R19272C4: got 'n.a.'
## Warning: Expecting numeric in D19273 / R19273C4: got 'n.a.'
## Warning: Expecting numeric in D19274 / R19274C4: got 'n.a.'
## Warning: Expecting numeric in D19275 / R19275C4: got 'n.a.'
## Warning: Expecting numeric in D19276 / R19276C4: got 'n.a.'
## Warning: Expecting numeric in D19277 / R19277C4: got 'n.a.'
## Warning: Expecting numeric in D19278 / R19278C4: got 'n.a.'
## Warning: Expecting numeric in D19279 / R19279C4: got 'n.a.'
## Warning: Expecting numeric in D19280 / R19280C4: got 'n.a.'
## Warning: Expecting numeric in D19281 / R19281C4: got 'n.a.'
## Warning: Expecting numeric in D19282 / R19282C4: got 'n.a.'
## Warning: Expecting numeric in D19283 / R19283C4: got 'n.a.'
## Warning: Expecting numeric in D19284 / R19284C4: got 'n.a.'
## Warning: Expecting numeric in D19285 / R19285C4: got 'n.a.'
## Warning: Expecting numeric in D19286 / R19286C4: got 'n.a.'
## Warning: Expecting numeric in D19287 / R19287C4: got 'n.a.'
## Warning: Expecting numeric in D19288 / R19288C4: got 'n.a.'
## Warning: Expecting numeric in D19289 / R19289C4: got 'n.a.'
## Warning: Expecting numeric in D19290 / R19290C4: got 'n.a.'
## Warning: Expecting numeric in D19291 / R19291C4: got 'n.a.'
## Warning: Expecting numeric in D19292 / R19292C4: got 'n.a.'
## Warning: Expecting numeric in D19293 / R19293C4: got 'n.a.'
## Warning: Expecting numeric in D19294 / R19294C4: got 'n.a.'
## Warning: Expecting numeric in D19295 / R19295C4: got 'n.a.'
## Warning: Expecting numeric in D19296 / R19296C4: got 'n.a.'
## Warning: Expecting numeric in D19297 / R19297C4: got 'n.a.'
## Warning: Expecting numeric in D19298 / R19298C4: got 'n.a.'
## Warning: Expecting numeric in D19299 / R19299C4: got 'n.a.'
## Warning: Expecting numeric in D19300 / R19300C4: got 'n.a.'
## Warning: Expecting numeric in D19301 / R19301C4: got 'n.a.'
## Warning: Expecting numeric in D19302 / R19302C4: got 'n.a.'
## Warning: Expecting numeric in D19303 / R19303C4: got 'n.a.'
## Warning: Expecting numeric in D19304 / R19304C4: got 'n.a.'
## Warning: Expecting numeric in D19305 / R19305C4: got 'n.a.'
## Warning: Expecting numeric in D19306 / R19306C4: got 'n.a.'
## Warning: Expecting numeric in D19307 / R19307C4: got 'n.a.'
## Warning: Expecting numeric in D19308 / R19308C4: got 'n.a.'
## Warning: Expecting numeric in D19309 / R19309C4: got 'n.a.'
## Warning: Expecting numeric in D19310 / R19310C4: got 'n.a.'
## Warning: Expecting numeric in D19311 / R19311C4: got 'n.a.'
## Warning: Expecting numeric in D19312 / R19312C4: got 'n.a.'
## Warning: Expecting numeric in D19313 / R19313C4: got 'n.a.'
## Warning: Expecting numeric in D19314 / R19314C4: got 'n.a.'
## Warning: Expecting numeric in D19315 / R19315C4: got 'n.a.'
## Warning: Expecting numeric in D19316 / R19316C4: got 'n.a.'
## Warning: Expecting numeric in D19317 / R19317C4: got 'n.a.'
## Warning: Expecting numeric in D19318 / R19318C4: got 'n.a.'
## Warning: Expecting numeric in D19319 / R19319C4: got 'n.a.'
## Warning: Expecting numeric in D19320 / R19320C4: got 'n.a.'
## Warning: Expecting numeric in D19321 / R19321C4: got 'n.a.'
## Warning: Expecting numeric in D19322 / R19322C4: got 'n.a.'
## Warning: Expecting numeric in D19323 / R19323C4: got 'n.a.'
## Warning: Expecting numeric in D19324 / R19324C4: got 'n.a.'
## Warning: Expecting numeric in D19325 / R19325C4: got 'n.a.'
## Warning: Expecting numeric in D19326 / R19326C4: got 'n.a.'
## Warning: Expecting numeric in D19327 / R19327C4: got 'n.a.'
## Warning: Expecting numeric in D19328 / R19328C4: got 'n.a.'
## Warning: Expecting numeric in D19329 / R19329C4: got 'n.a.'
## Warning: Expecting numeric in D19330 / R19330C4: got 'n.a.'
## Warning: Expecting numeric in D19331 / R19331C4: got 'n.a.'
## Warning: Expecting numeric in D19332 / R19332C4: got 'n.a.'
## Warning: Expecting numeric in D19333 / R19333C4: got 'n.a.'
## Warning: Expecting numeric in D19334 / R19334C4: got 'n.a.'
## Warning: Expecting numeric in D19335 / R19335C4: got 'n.a.'
## Warning: Expecting numeric in D19336 / R19336C4: got 'n.a.'
## Warning: Expecting numeric in D19337 / R19337C4: got 'n.a.'
## Warning: Expecting numeric in D19338 / R19338C4: got 'n.a.'
## Warning: Expecting numeric in D19339 / R19339C4: got 'n.a.'
## Warning: Expecting numeric in D19340 / R19340C4: got 'n.a.'
## Warning: Expecting numeric in D19341 / R19341C4: got 'n.a.'
## Warning: Expecting numeric in D19342 / R19342C4: got 'n.a.'
## Warning: Expecting numeric in D19343 / R19343C4: got 'n.a.'
## Warning: Expecting numeric in D19344 / R19344C4: got 'n.a.'
## Warning: Expecting numeric in D19345 / R19345C4: got 'n.a.'
## Warning: Expecting numeric in D19346 / R19346C4: got 'n.a.'
## Warning: Expecting numeric in D19347 / R19347C4: got 'n.a.'
## Warning: Expecting numeric in D19348 / R19348C4: got 'n.a.'
## Warning: Expecting numeric in D19349 / R19349C4: got 'n.a.'
## Warning: Expecting numeric in D19350 / R19350C4: got 'n.a.'
## Warning: Expecting numeric in D19351 / R19351C4: got 'n.a.'
## Warning: Expecting numeric in D19352 / R19352C4: got 'n.a.'
## Warning: Expecting numeric in D19353 / R19353C4: got 'n.a.'
## Warning: Expecting numeric in D19354 / R19354C4: got 'n.a.'
## Warning: Expecting numeric in D19355 / R19355C4: got 'n.a.'
## Warning: Expecting numeric in D19356 / R19356C4: got 'n.a.'
## Warning: Expecting numeric in D19357 / R19357C4: got 'n.a.'
## Warning: Expecting numeric in D19358 / R19358C4: got 'n.a.'
## Warning: Expecting numeric in D19359 / R19359C4: got 'n.a.'
## Warning: Expecting numeric in D19360 / R19360C4: got 'n.a.'
## Warning: Expecting numeric in D19361 / R19361C4: got 'n.a.'
## Warning: Expecting numeric in D19362 / R19362C4: got 'n.a.'
## Warning: Expecting numeric in D19363 / R19363C4: got 'n.a.'
## Warning: Expecting numeric in D19364 / R19364C4: got 'n.a.'
## Warning: Expecting numeric in D19365 / R19365C4: got 'n.a.'
## Warning: Expecting numeric in D19366 / R19366C4: got 'n.a.'
## Warning: Expecting numeric in D19367 / R19367C4: got 'n.a.'
## Warning: Expecting numeric in D19368 / R19368C4: got 'n.a.'
## Warning: Expecting numeric in D19369 / R19369C4: got 'n.a.'
## Warning: Expecting numeric in D19370 / R19370C4: got 'n.a.'
## Warning: Expecting numeric in D19371 / R19371C4: got 'n.a.'
## Warning: Expecting numeric in D19372 / R19372C4: got 'n.a.'
## Warning: Expecting numeric in D19373 / R19373C4: got 'n.a.'
## Warning: Expecting numeric in D19374 / R19374C4: got 'n.a.'
## Warning: Expecting numeric in D19375 / R19375C4: got 'n.a.'
## Warning: Expecting numeric in D19376 / R19376C4: got 'n.a.'
## Warning: Expecting numeric in D19377 / R19377C4: got 'n.a.'
## Warning: Expecting numeric in D19378 / R19378C4: got 'n.a.'
## Warning: Expecting numeric in D19379 / R19379C4: got 'n.a.'
## Warning: Expecting numeric in D19380 / R19380C4: got 'n.a.'
## Warning: Expecting numeric in D19381 / R19381C4: got 'n.a.'
## Warning: Expecting numeric in D19382 / R19382C4: got 'n.a.'
## Warning: Expecting numeric in D19383 / R19383C4: got 'n.a.'
## Warning: Expecting numeric in D19384 / R19384C4: got 'n.a.'
## Warning: Expecting numeric in D19385 / R19385C4: got 'n.a.'
## Warning: Expecting numeric in D19386 / R19386C4: got 'n.a.'
## Warning: Expecting numeric in D19387 / R19387C4: got 'n.a.'
## Warning: Expecting numeric in D19388 / R19388C4: got 'n.a.'
## Warning: Expecting numeric in D19389 / R19389C4: got 'n.a.'
## Warning: Expecting numeric in D19390 / R19390C4: got 'n.a.'
## Warning: Expecting numeric in D19391 / R19391C4: got 'n.a.'
## Warning: Expecting numeric in D19392 / R19392C4: got 'n.a.'
## Warning: Expecting numeric in D19393 / R19393C4: got 'n.a.'
## Warning: Expecting numeric in D19394 / R19394C4: got 'n.a.'
## Warning: Expecting numeric in D19395 / R19395C4: got 'n.a.'
## Warning: Expecting numeric in D19396 / R19396C4: got 'n.a.'
## Warning: Expecting numeric in D19397 / R19397C4: got 'n.a.'
## Warning: Expecting numeric in D19398 / R19398C4: got 'n.a.'
## Warning: Expecting numeric in D19399 / R19399C4: got 'n.a.'
## Warning: Expecting numeric in D19400 / R19400C4: got 'n.a.'
## Warning: Expecting numeric in D19401 / R19401C4: got 'n.a.'
## Warning: Expecting numeric in D19402 / R19402C4: got 'n.a.'
## Warning: Expecting numeric in D19403 / R19403C4: got 'n.a.'
## Warning: Expecting numeric in D19404 / R19404C4: got 'n.a.'
## Warning: Expecting numeric in D19405 / R19405C4: got 'n.a.'
## Warning: Expecting numeric in D19406 / R19406C4: got 'n.a.'
## Warning: Expecting numeric in D19407 / R19407C4: got 'n.a.'
## Warning: Expecting numeric in D19408 / R19408C4: got 'n.a.'
## Warning: Expecting numeric in D19409 / R19409C4: got 'n.a.'
## Warning: Expecting numeric in D19410 / R19410C4: got 'n.a.'
## Warning: Expecting numeric in D19411 / R19411C4: got 'n.a.'
## Warning: Expecting numeric in D19412 / R19412C4: got 'n.a.'
## Warning: Expecting numeric in D19413 / R19413C4: got 'n.a.'
## Warning: Expecting numeric in D19414 / R19414C4: got 'n.a.'
## Warning: Expecting numeric in D19415 / R19415C4: got 'n.a.'
## Warning: Expecting numeric in D19416 / R19416C4: got 'n.a.'
## Warning: Expecting numeric in D19417 / R19417C4: got 'n.a.'
## Warning: Expecting numeric in D19418 / R19418C4: got 'n.a.'
## Warning: Expecting numeric in D19419 / R19419C4: got 'n.a.'
## Warning: Expecting numeric in D19420 / R19420C4: got 'n.a.'
## Warning: Expecting numeric in D19421 / R19421C4: got 'n.a.'
## Warning: Expecting numeric in D19422 / R19422C4: got 'n.a.'
## Warning: Expecting numeric in D19423 / R19423C4: got 'n.a.'
## Warning: Expecting numeric in D19424 / R19424C4: got 'n.a.'
## Warning: Expecting numeric in D19425 / R19425C4: got 'n.a.'
## Warning: Expecting numeric in D19426 / R19426C4: got 'n.a.'
## Warning: Expecting numeric in D19427 / R19427C4: got 'n.a.'
## Warning: Expecting numeric in D19428 / R19428C4: got 'n.a.'
## Warning: Expecting numeric in D19429 / R19429C4: got 'n.a.'
## Warning: Expecting numeric in D19430 / R19430C4: got 'n.a.'
## Warning: Expecting numeric in D19431 / R19431C4: got 'n.a.'
## Warning: Expecting numeric in D19432 / R19432C4: got 'n.a.'
## Warning: Expecting numeric in D19433 / R19433C4: got 'n.a.'
## Warning: Expecting numeric in D19434 / R19434C4: got 'n.a.'
## Warning: Expecting numeric in D19435 / R19435C4: got 'n.a.'
## Warning: Expecting numeric in D19436 / R19436C4: got 'n.a.'
## Warning: Expecting numeric in D19437 / R19437C4: got 'n.a.'
## Warning: Expecting numeric in D19438 / R19438C4: got 'n.a.'
## Warning: Expecting numeric in D19439 / R19439C4: got 'n.a.'
## Warning: Expecting numeric in D19440 / R19440C4: got 'n.a.'
## Warning: Expecting numeric in D19441 / R19441C4: got 'n.a.'
## Warning: Expecting numeric in D19442 / R19442C4: got 'n.a.'
## Warning: Expecting numeric in D19443 / R19443C4: got 'n.a.'
## Warning: Expecting numeric in D19444 / R19444C4: got 'n.a.'
## Warning: Expecting numeric in D19445 / R19445C4: got 'n.a.'
## Warning: Expecting numeric in D19446 / R19446C4: got 'n.a.'
## Warning: Expecting numeric in D19447 / R19447C4: got 'n.a.'
## Warning: Expecting numeric in D19448 / R19448C4: got 'n.a.'
## Warning: Expecting numeric in D19449 / R19449C4: got 'n.a.'
## Warning: Expecting numeric in D19450 / R19450C4: got 'n.a.'
## Warning: Expecting numeric in D19451 / R19451C4: got 'n.a.'
## Warning: Expecting numeric in D19452 / R19452C4: got 'n.a.'
## Warning: Expecting numeric in D19453 / R19453C4: got 'n.a.'
## Warning: Expecting numeric in D19454 / R19454C4: got 'n.a.'
## Warning: Expecting numeric in D19455 / R19455C4: got 'n.a.'
## Warning: Expecting numeric in D19456 / R19456C4: got 'n.a.'
## Warning: Expecting numeric in D19457 / R19457C4: got 'n.a.'
## Warning: Expecting numeric in D19458 / R19458C4: got 'n.a.'
## Warning: Expecting numeric in D19459 / R19459C4: got 'n.a.'
## Warning: Expecting numeric in D19460 / R19460C4: got 'n.a.'
## Warning: Expecting numeric in D19461 / R19461C4: got 'n.a.'
## Warning: Expecting numeric in D19462 / R19462C4: got 'n.a.'
## Warning: Expecting numeric in D19463 / R19463C4: got 'n.a.'
## Warning: Expecting numeric in D19464 / R19464C4: got 'n.a.'
## Warning: Expecting numeric in D19465 / R19465C4: got 'n.a.'
## Warning: Expecting numeric in D19466 / R19466C4: got 'n.a.'
## Warning: Expecting numeric in D19467 / R19467C4: got 'n.a.'
## Warning: Expecting numeric in D19468 / R19468C4: got 'n.a.'
## Warning: Expecting numeric in D19469 / R19469C4: got 'n.a.'
## Warning: Expecting numeric in D19470 / R19470C4: got 'n.a.'
## Warning: Expecting numeric in D19471 / R19471C4: got 'n.a.'
## Warning: Expecting numeric in D19472 / R19472C4: got 'n.a.'
## Warning: Expecting numeric in D19473 / R19473C4: got 'n.a.'
## Warning: Expecting numeric in D19474 / R19474C4: got 'n.a.'
## Warning: Expecting numeric in D19475 / R19475C4: got 'n.a.'
## Warning: Expecting numeric in D19476 / R19476C4: got 'n.a.'
## Warning: Expecting numeric in D19477 / R19477C4: got 'n.a.'
## Warning: Expecting numeric in D19478 / R19478C4: got 'n.a.'
## Warning: Expecting numeric in D19479 / R19479C4: got 'n.a.'
## Warning: Expecting numeric in D19480 / R19480C4: got 'n.a.'
## Warning: Expecting numeric in D19481 / R19481C4: got 'n.a.'
## Warning: Expecting numeric in D19482 / R19482C4: got 'n.a.'
## Warning: Expecting numeric in D19483 / R19483C4: got 'n.a.'
## Warning: Expecting numeric in D19484 / R19484C4: got 'n.a.'
## Warning: Expecting numeric in D19485 / R19485C4: got 'n.a.'
## Warning: Expecting numeric in D19486 / R19486C4: got 'n.a.'
## Warning: Expecting numeric in D19487 / R19487C4: got 'n.a.'
## Warning: Expecting numeric in D19488 / R19488C4: got 'n.a.'
## Warning: Expecting numeric in D19489 / R19489C4: got 'n.a.'
## Warning: Expecting numeric in D19490 / R19490C4: got 'n.a.'
## Warning: Expecting numeric in D19491 / R19491C4: got 'n.a.'
## Warning: Expecting numeric in D19492 / R19492C4: got 'n.a.'
## Warning: Expecting numeric in D19493 / R19493C4: got 'n.a.'
## Warning: Expecting numeric in D19494 / R19494C4: got 'n.a.'
## Warning: Expecting numeric in D19495 / R19495C4: got 'n.a.'
## Warning: Expecting numeric in D19496 / R19496C4: got 'n.a.'
## Warning: Expecting numeric in D19497 / R19497C4: got 'n.a.'
## Warning: Expecting numeric in D19498 / R19498C4: got 'n.a.'
## Warning: Expecting numeric in D19499 / R19499C4: got 'n.a.'
## Warning: Expecting numeric in D19500 / R19500C4: got 'n.a.'
## Warning: Expecting numeric in D19501 / R19501C4: got 'n.a.'
## Warning: Expecting numeric in D19502 / R19502C4: got 'n.a.'
## Warning: Expecting numeric in D19503 / R19503C4: got 'n.a.'
## Warning: Expecting numeric in D19504 / R19504C4: got 'n.a.'
## Warning: Expecting numeric in D19505 / R19505C4: got 'n.a.'
## Warning: Expecting numeric in D19506 / R19506C4: got 'n.a.'
## Warning: Expecting numeric in D19507 / R19507C4: got 'n.a.'
## Warning: Expecting numeric in D19508 / R19508C4: got 'n.a.'
## Warning: Expecting numeric in D19509 / R19509C4: got 'n.a.'
## Warning: Expecting numeric in D19510 / R19510C4: got 'n.a.'
## Warning: Expecting numeric in D19511 / R19511C4: got 'n.a.'
## Warning: Expecting numeric in D19512 / R19512C4: got 'n.a.'
## Warning: Expecting numeric in D19513 / R19513C4: got 'n.a.'
## Warning: Expecting numeric in D19514 / R19514C4: got 'n.a.'
## Warning: Expecting numeric in D19515 / R19515C4: got 'n.a.'
## Warning: Expecting numeric in D19516 / R19516C4: got 'n.a.'
## Warning: Expecting numeric in D19517 / R19517C4: got 'n.a.'
## Warning: Expecting numeric in D19518 / R19518C4: got 'n.a.'
## Warning: Expecting numeric in D19519 / R19519C4: got 'n.a.'
## Warning: Expecting numeric in D19520 / R19520C4: got 'n.a.'
## Warning: Expecting numeric in D19521 / R19521C4: got 'n.a.'
## Warning: Expecting numeric in D19522 / R19522C4: got 'n.a.'
## Warning: Expecting numeric in D19523 / R19523C4: got 'n.a.'
## Warning: Expecting numeric in D19524 / R19524C4: got 'n.a.'
## Warning: Expecting numeric in D19525 / R19525C4: got 'n.a.'
## Warning: Expecting numeric in D19526 / R19526C4: got 'n.a.'
## Warning: Expecting numeric in D19527 / R19527C4: got 'n.a.'
## Warning: Expecting numeric in D19528 / R19528C4: got 'n.a.'
## Warning: Expecting numeric in D19529 / R19529C4: got 'n.a.'
## Warning: Expecting numeric in D19530 / R19530C4: got 'n.a.'
## Warning: Expecting numeric in D19531 / R19531C4: got 'n.a.'
## Warning: Expecting numeric in D19532 / R19532C4: got 'n.a.'
## Warning: Expecting numeric in D19533 / R19533C4: got 'n.a.'
## Warning: Expecting numeric in D19534 / R19534C4: got 'n.a.'
## Warning: Expecting numeric in D19535 / R19535C4: got 'n.a.'
## Warning: Expecting numeric in D19536 / R19536C4: got 'n.a.'
## Warning: Expecting numeric in D19537 / R19537C4: got 'n.a.'
## Warning: Expecting numeric in D19538 / R19538C4: got 'n.a.'
## Warning: Expecting numeric in D19539 / R19539C4: got 'n.a.'
## Warning: Expecting numeric in D19540 / R19540C4: got 'n.a.'
## Warning: Expecting numeric in D19541 / R19541C4: got 'n.a.'
## Warning: Expecting numeric in D19542 / R19542C4: got 'n.a.'
## Warning: Expecting numeric in D19543 / R19543C4: got 'n.a.'
## Warning: Expecting numeric in D19544 / R19544C4: got 'n.a.'
## Warning: Expecting numeric in D19545 / R19545C4: got 'n.a.'
## Warning: Expecting numeric in D19546 / R19546C4: got 'n.a.'
## Warning: Expecting numeric in D19547 / R19547C4: got 'n.a.'
## Warning: Expecting numeric in D19548 / R19548C4: got 'n.a.'
## Warning: Expecting numeric in D19549 / R19549C4: got 'n.a.'
## Warning: Expecting numeric in D19550 / R19550C4: got 'n.a.'
## Warning: Expecting numeric in D19551 / R19551C4: got 'n.a.'
## Warning: Expecting numeric in D19552 / R19552C4: got 'n.a.'
## Warning: Expecting numeric in D19553 / R19553C4: got 'n.a.'
## Warning: Expecting numeric in D19554 / R19554C4: got 'n.a.'
## Warning: Expecting numeric in D19555 / R19555C4: got 'n.a.'
## Warning: Expecting numeric in D19556 / R19556C4: got 'n.a.'
## Warning: Expecting numeric in D19557 / R19557C4: got 'n.a.'
## Warning: Expecting numeric in D19558 / R19558C4: got 'n.a.'
## Warning: Expecting numeric in D19559 / R19559C4: got 'n.a.'
## Warning: Expecting numeric in D19560 / R19560C4: got 'n.a.'
## Warning: Expecting numeric in D19561 / R19561C4: got 'n.a.'
## Warning: Expecting numeric in D19562 / R19562C4: got 'n.a.'
## Warning: Expecting numeric in D19563 / R19563C4: got 'n.a.'
## Warning: Expecting numeric in D19564 / R19564C4: got 'n.a.'
## Warning: Expecting numeric in D19565 / R19565C4: got 'n.a.'
## Warning: Expecting numeric in D19566 / R19566C4: got 'n.a.'
## Warning: Expecting numeric in D19567 / R19567C4: got 'n.a.'
## Warning: Expecting numeric in D19568 / R19568C4: got 'n.a.'
## Warning: Expecting numeric in D19569 / R19569C4: got 'n.a.'
## Warning: Expecting numeric in D19570 / R19570C4: got 'n.a.'
## Warning: Expecting numeric in D19571 / R19571C4: got 'n.a.'
## Warning: Expecting numeric in D19572 / R19572C4: got 'n.a.'
## Warning: Expecting numeric in D19573 / R19573C4: got 'n.a.'
## Warning: Expecting numeric in D19574 / R19574C4: got 'n.a.'
## Warning: Expecting numeric in D19575 / R19575C4: got 'n.a.'
## Warning: Expecting numeric in D19576 / R19576C4: got 'n.a.'
## Warning: Expecting numeric in D19577 / R19577C4: got 'n.a.'
## Warning: Expecting numeric in D19578 / R19578C4: got 'n.a.'
## Warning: Expecting numeric in D19579 / R19579C4: got 'n.a.'
## Warning: Expecting numeric in D19580 / R19580C4: got 'n.a.'
## Warning: Expecting numeric in D19581 / R19581C4: got 'n.a.'
## Warning: Expecting numeric in D19582 / R19582C4: got 'n.a.'
## Warning: Expecting numeric in D19583 / R19583C4: got 'n.a.'
## Warning: Expecting numeric in D19584 / R19584C4: got 'n.a.'
## Warning: Expecting numeric in D19585 / R19585C4: got 'n.a.'
## Warning: Expecting numeric in D19586 / R19586C4: got 'n.a.'
## Warning: Expecting numeric in D19587 / R19587C4: got 'n.a.'
## Warning: Expecting numeric in D19588 / R19588C4: got 'n.a.'
## Warning: Expecting numeric in D19589 / R19589C4: got 'n.a.'
## Warning: Expecting numeric in D19590 / R19590C4: got 'n.a.'
## Warning: Expecting numeric in D19591 / R19591C4: got 'n.a.'
## Warning: Expecting numeric in D19592 / R19592C4: got 'n.a.'
## Warning: Expecting numeric in D19593 / R19593C4: got 'n.a.'
## Warning: Expecting numeric in D19594 / R19594C4: got 'n.a.'
## Warning: Expecting numeric in D19595 / R19595C4: got 'n.a.'
## Warning: Expecting numeric in D19596 / R19596C4: got 'n.a.'
## Warning: Expecting numeric in D19597 / R19597C4: got 'n.a.'
## Warning: Expecting numeric in D19598 / R19598C4: got 'n.a.'
## Warning: Expecting numeric in D19599 / R19599C4: got 'n.a.'
## Warning: Expecting numeric in D19600 / R19600C4: got 'n.a.'
## Warning: Expecting numeric in D19601 / R19601C4: got 'n.a.'
## Warning: Expecting numeric in D19602 / R19602C4: got 'n.a.'
## Warning: Expecting numeric in D19603 / R19603C4: got 'n.a.'
## Warning: Expecting numeric in D19604 / R19604C4: got 'n.a.'
## Warning: Expecting numeric in D19605 / R19605C4: got 'n.a.'
## Warning: Expecting numeric in D19606 / R19606C4: got 'n.a.'
## Warning: Expecting numeric in D19607 / R19607C4: got 'n.a.'
## Warning: Expecting numeric in D19608 / R19608C4: got 'n.a.'
## Warning: Expecting numeric in D19609 / R19609C4: got 'n.a.'
## Warning: Expecting numeric in D19610 / R19610C4: got 'n.a.'
## Warning: Expecting numeric in D19611 / R19611C4: got 'n.a.'
## Warning: Expecting numeric in D19612 / R19612C4: got 'n.a.'
## Warning: Expecting numeric in D19613 / R19613C4: got 'n.a.'
## Warning: Expecting numeric in D19614 / R19614C4: got 'n.a.'
## Warning: Expecting numeric in D19615 / R19615C4: got 'n.a.'
## Warning: Expecting numeric in D19616 / R19616C4: got 'n.a.'
## Warning: Expecting numeric in D19617 / R19617C4: got 'n.a.'
## Warning: Expecting numeric in D19618 / R19618C4: got 'n.a.'
## Warning: Expecting numeric in D19619 / R19619C4: got 'n.a.'
## Warning: Expecting numeric in D19620 / R19620C4: got 'n.a.'
## Warning: Expecting numeric in D19621 / R19621C4: got 'n.a.'
## Warning: Expecting numeric in D19622 / R19622C4: got 'n.a.'
## Warning: Expecting numeric in D19623 / R19623C4: got 'n.a.'
## Warning: Expecting numeric in D19624 / R19624C4: got 'n.a.'
## Warning: Expecting numeric in D19625 / R19625C4: got 'n.a.'
## Warning: Expecting numeric in D19626 / R19626C4: got 'n.a.'
## Warning: Expecting numeric in D19627 / R19627C4: got 'n.a.'
## Warning: Expecting numeric in D19628 / R19628C4: got 'n.a.'
## Warning: Expecting numeric in D19629 / R19629C4: got 'n.a.'
## Warning: Expecting numeric in D19630 / R19630C4: got 'n.a.'
## Warning: Expecting numeric in D19631 / R19631C4: got 'n.a.'
## Warning: Expecting numeric in D19632 / R19632C4: got 'n.a.'
## Warning: Expecting numeric in D19633 / R19633C4: got 'n.a.'
## Warning: Expecting numeric in D19634 / R19634C4: got 'n.a.'
## Warning: Expecting numeric in D19635 / R19635C4: got 'n.a.'
## Warning: Expecting numeric in D19636 / R19636C4: got 'n.a.'
## Warning: Expecting numeric in D19637 / R19637C4: got 'n.a.'
## Warning: Expecting numeric in D19638 / R19638C4: got 'n.a.'
## Warning: Expecting numeric in D19639 / R19639C4: got 'n.a.'
## Warning: Expecting numeric in D19640 / R19640C4: got 'n.a.'
## Warning: Expecting numeric in D19641 / R19641C4: got 'n.a.'
## Warning: Expecting numeric in D19642 / R19642C4: got 'n.a.'
## Warning: Expecting numeric in D19643 / R19643C4: got 'n.a.'
## Warning: Expecting numeric in D19644 / R19644C4: got 'n.a.'
## Warning: Expecting numeric in D19645 / R19645C4: got 'n.a.'
## Warning: Expecting numeric in D19646 / R19646C4: got 'n.a.'
## Warning: Expecting numeric in D19647 / R19647C4: got 'n.a.'
## Warning: Expecting numeric in D19648 / R19648C4: got 'n.a.'
## Warning: Expecting numeric in D19649 / R19649C4: got 'n.a.'
## Warning: Expecting numeric in D19650 / R19650C4: got 'n.a.'
## Warning: Expecting numeric in D19651 / R19651C4: got 'n.a.'
## Warning: Expecting numeric in D19652 / R19652C4: got 'n.a.'
## Warning: Expecting numeric in D19653 / R19653C4: got 'n.a.'
## Warning: Expecting numeric in D19654 / R19654C4: got 'n.a.'
## Warning: Expecting numeric in D19655 / R19655C4: got 'n.a.'
## Warning: Expecting numeric in D19656 / R19656C4: got 'n.a.'
## Warning: Expecting numeric in D19657 / R19657C4: got 'n.a.'
## Warning: Expecting numeric in D19658 / R19658C4: got 'n.a.'
## Warning: Expecting numeric in D19659 / R19659C4: got 'n.a.'
## Warning: Expecting numeric in D19660 / R19660C4: got 'n.a.'
## Warning: Expecting numeric in D19661 / R19661C4: got 'n.a.'
## Warning: Expecting numeric in D19662 / R19662C4: got 'n.a.'
## Warning: Expecting numeric in D19663 / R19663C4: got 'n.a.'
## Warning: Expecting numeric in D19664 / R19664C4: got 'n.a.'
## Warning: Expecting numeric in D19665 / R19665C4: got 'n.a.'
## Warning: Expecting numeric in D19666 / R19666C4: got 'n.a.'
## Warning: Expecting numeric in D19667 / R19667C4: got 'n.a.'
## Warning: Expecting numeric in D19668 / R19668C4: got 'n.a.'
## Warning: Expecting numeric in D19669 / R19669C4: got 'n.a.'
## Warning: Expecting numeric in D19670 / R19670C4: got 'n.a.'
## Warning: Expecting numeric in D19671 / R19671C4: got 'n.a.'
## Warning: Expecting numeric in D19672 / R19672C4: got 'n.a.'
## Warning: Expecting numeric in D19673 / R19673C4: got 'n.a.'
## Warning: Expecting numeric in D19674 / R19674C4: got 'n.a.'
## Warning: Expecting numeric in D19675 / R19675C4: got 'n.a.'
## Warning: Expecting numeric in D19676 / R19676C4: got 'n.a.'
## Warning: Expecting numeric in D19677 / R19677C4: got 'n.a.'
## Warning: Expecting numeric in D19678 / R19678C4: got 'n.a.'
## Warning: Expecting numeric in D19679 / R19679C4: got 'n.a.'
## Warning: Expecting numeric in D19680 / R19680C4: got 'n.a.'
## Warning: Expecting numeric in D19681 / R19681C4: got 'n.a.'
## Warning: Expecting numeric in D19682 / R19682C4: got 'n.a.'
## Warning: Expecting numeric in D19683 / R19683C4: got 'n.a.'
## Warning: Expecting numeric in D19684 / R19684C4: got 'n.a.'
## Warning: Expecting numeric in D19685 / R19685C4: got 'n.a.'
## Warning: Expecting numeric in D19686 / R19686C4: got 'n.a.'
## Warning: Expecting numeric in D19687 / R19687C4: got 'n.a.'
## Warning: Expecting numeric in D19688 / R19688C4: got 'n.a.'
## Warning: Expecting numeric in D19689 / R19689C4: got 'n.a.'
## Warning: Expecting numeric in D19690 / R19690C4: got 'n.a.'
## Warning: Expecting numeric in D19691 / R19691C4: got 'n.a.'
## Warning: Expecting numeric in D19692 / R19692C4: got 'n.a.'
## Warning: Expecting numeric in D19693 / R19693C4: got 'n.a.'
## Warning: Expecting numeric in D19694 / R19694C4: got 'n.a.'
## Warning: Expecting numeric in D19695 / R19695C4: got 'n.a.'
## Warning: Expecting numeric in D19696 / R19696C4: got 'n.a.'
## Warning: Expecting numeric in D19697 / R19697C4: got 'n.a.'
## Warning: Expecting numeric in D19698 / R19698C4: got 'n.a.'
## Warning: Expecting numeric in D19699 / R19699C4: got 'n.a.'
## Warning: Expecting numeric in D19700 / R19700C4: got 'n.a.'
## Warning: Expecting numeric in D19701 / R19701C4: got 'n.a.'
## Warning: Expecting numeric in D19702 / R19702C4: got 'n.a.'
## Warning: Expecting numeric in D19703 / R19703C4: got 'n.a.'
## Warning: Expecting numeric in D19704 / R19704C4: got 'n.a.'
## Warning: Expecting numeric in D19705 / R19705C4: got 'n.a.'
## Warning: Expecting numeric in D19706 / R19706C4: got 'n.a.'
## Warning: Expecting numeric in D19707 / R19707C4: got 'n.a.'
## Warning: Expecting numeric in D19708 / R19708C4: got 'n.a.'
## Warning: Expecting numeric in D19709 / R19709C4: got 'n.a.'
## Warning: Expecting numeric in D19710 / R19710C4: got 'n.a.'
## Warning: Expecting numeric in D19711 / R19711C4: got 'n.a.'
## Warning: Expecting numeric in D19712 / R19712C4: got 'n.a.'
## Warning: Expecting numeric in D19713 / R19713C4: got 'n.a.'
## Warning: Expecting numeric in D19714 / R19714C4: got 'n.a.'
## Warning: Expecting numeric in D19715 / R19715C4: got 'n.a.'
## Warning: Expecting numeric in D19716 / R19716C4: got 'n.a.'
## Warning: Expecting numeric in D19717 / R19717C4: got 'n.a.'
## Warning: Expecting numeric in D19718 / R19718C4: got 'n.a.'
## Warning: Expecting numeric in D19719 / R19719C4: got 'n.a.'
## Warning: Expecting numeric in D19720 / R19720C4: got 'n.a.'
## Warning: Expecting numeric in D19721 / R19721C4: got 'n.a.'
## Warning: Expecting numeric in D19722 / R19722C4: got 'n.a.'
## Warning: Expecting numeric in D19723 / R19723C4: got 'n.a.'
## Warning: Expecting numeric in D19724 / R19724C4: got 'n.a.'
## Warning: Expecting numeric in D19725 / R19725C4: got 'n.a.'
## Warning: Expecting numeric in D19726 / R19726C4: got 'n.a.'
## Warning: Expecting numeric in D19727 / R19727C4: got 'n.a.'
## Warning: Expecting numeric in D19728 / R19728C4: got 'n.a.'
## Warning: Expecting numeric in D19729 / R19729C4: got 'n.a.'
## Warning: Expecting numeric in D19730 / R19730C4: got 'n.a.'
## Warning: Expecting numeric in D19731 / R19731C4: got 'n.a.'
## Warning: Expecting numeric in D19732 / R19732C4: got 'n.a.'
## Warning: Expecting numeric in D19733 / R19733C4: got 'n.a.'
## Warning: Expecting numeric in D19734 / R19734C4: got 'n.a.'
## Warning: Expecting numeric in D19735 / R19735C4: got 'n.a.'
## Warning: Expecting numeric in D19736 / R19736C4: got 'n.a.'
## Warning: Expecting numeric in D19737 / R19737C4: got 'n.a.'
## Warning: Expecting numeric in D19738 / R19738C4: got 'n.a.'
## Warning: Expecting numeric in D19739 / R19739C4: got 'n.a.'
## Warning: Expecting numeric in D19740 / R19740C4: got 'n.a.'
## Warning: Expecting numeric in D19741 / R19741C4: got 'n.a.'
## Warning: Expecting numeric in D19742 / R19742C4: got 'n.a.'
## Warning: Expecting numeric in D19743 / R19743C4: got 'n.a.'
## Warning: Expecting numeric in D19744 / R19744C4: got 'n.a.'
## Warning: Expecting numeric in D19745 / R19745C4: got 'n.a.'
## Warning: Expecting numeric in D19746 / R19746C4: got 'n.a.'
## Warning: Expecting numeric in D19747 / R19747C4: got 'n.a.'
## Warning: Expecting numeric in D19748 / R19748C4: got 'n.a.'
## Warning: Expecting numeric in D19749 / R19749C4: got 'n.a.'
## Warning: Expecting numeric in D19750 / R19750C4: got 'n.a.'
## Warning: Expecting numeric in D19751 / R19751C4: got 'n.a.'
## Warning: Expecting numeric in D19752 / R19752C4: got 'n.a.'
## Warning: Expecting numeric in D19753 / R19753C4: got 'n.a.'
## Warning: Expecting numeric in D19754 / R19754C4: got 'n.a.'
## Warning: Expecting numeric in D19755 / R19755C4: got 'n.a.'
## Warning: Expecting numeric in D19756 / R19756C4: got 'n.a.'
## Warning: Expecting numeric in D19757 / R19757C4: got 'n.a.'
## Warning: Expecting numeric in D19758 / R19758C4: got 'n.a.'
## Warning: Expecting numeric in D19759 / R19759C4: got 'n.a.'
## Warning: Expecting numeric in D19760 / R19760C4: got 'n.a.'
## Warning: Expecting numeric in D19761 / R19761C4: got 'n.a.'
## Warning: Expecting numeric in D19762 / R19762C4: got 'n.a.'
## Warning: Expecting numeric in D19763 / R19763C4: got 'n.a.'
## Warning: Expecting numeric in D19764 / R19764C4: got 'n.a.'
## Warning: Expecting numeric in D19765 / R19765C4: got 'n.a.'
## Warning: Expecting numeric in D19766 / R19766C4: got 'n.a.'
## Warning: Expecting numeric in D19767 / R19767C4: got 'n.a.'
## Warning: Expecting numeric in D19768 / R19768C4: got 'n.a.'
## Warning: Expecting numeric in D19769 / R19769C4: got 'n.a.'
## Warning: Expecting numeric in D19770 / R19770C4: got 'n.a.'
## Warning: Expecting numeric in D19771 / R19771C4: got 'n.a.'
## Warning: Expecting numeric in D19772 / R19772C4: got 'n.a.'
## Warning: Expecting numeric in D19773 / R19773C4: got 'n.a.'
## Warning: Expecting numeric in D19774 / R19774C4: got 'n.a.'
## Warning: Expecting numeric in D19775 / R19775C4: got 'n.a.'
## Warning: Expecting numeric in D19776 / R19776C4: got 'n.a.'
## Warning: Expecting numeric in D19777 / R19777C4: got 'n.a.'
## Warning: Expecting numeric in D19778 / R19778C4: got 'n.a.'
## Warning: Expecting numeric in D19779 / R19779C4: got 'n.a.'
## Warning: Expecting numeric in D19780 / R19780C4: got 'n.a.'
## Warning: Expecting numeric in D19781 / R19781C4: got 'n.a.'
## Warning: Expecting numeric in D19782 / R19782C4: got 'n.a.'
## Warning: Expecting numeric in D19783 / R19783C4: got 'n.a.'
## Warning: Expecting numeric in D19784 / R19784C4: got 'n.a.'
## Warning: Expecting numeric in D19785 / R19785C4: got 'n.a.'
## Warning: Expecting numeric in D19786 / R19786C4: got 'n.a.'
## Warning: Expecting numeric in D19787 / R19787C4: got 'n.a.'
## Warning: Expecting numeric in D19788 / R19788C4: got 'n.a.'
## Warning: Expecting numeric in D19789 / R19789C4: got 'n.a.'
## Warning: Expecting numeric in D19790 / R19790C4: got 'n.a.'
## Warning: Expecting numeric in D19791 / R19791C4: got 'n.a.'
## Warning: Expecting numeric in D19792 / R19792C4: got 'n.a.'
## Warning: Expecting numeric in D19793 / R19793C4: got 'n.a.'
## Warning: Expecting numeric in D19794 / R19794C4: got 'n.a.'
## Warning: Expecting numeric in D19795 / R19795C4: got 'n.a.'
## Warning: Expecting numeric in D19796 / R19796C4: got 'n.a.'
## Warning: Expecting numeric in D19797 / R19797C4: got 'n.a.'
## Warning: Expecting numeric in D19798 / R19798C4: got 'n.a.'
## Warning: Expecting numeric in D19799 / R19799C4: got 'n.a.'
## Warning: Expecting numeric in D19800 / R19800C4: got 'n.a.'
## Warning: Expecting numeric in D19801 / R19801C4: got 'n.a.'
## Warning: Expecting numeric in D19802 / R19802C4: got 'n.a.'
## Warning: Expecting numeric in D19803 / R19803C4: got 'n.a.'
## Warning: Expecting numeric in D19804 / R19804C4: got 'n.a.'
## Warning: Expecting numeric in D19805 / R19805C4: got 'n.a.'
## Warning: Expecting numeric in D19806 / R19806C4: got 'n.a.'
## Warning: Expecting numeric in D19807 / R19807C4: got 'n.a.'
## Warning: Expecting numeric in D19808 / R19808C4: got 'n.a.'
## Warning: Expecting numeric in D19809 / R19809C4: got 'n.a.'
## Warning: Expecting numeric in D19810 / R19810C4: got 'n.a.'
## Warning: Expecting numeric in D19811 / R19811C4: got 'n.a.'
## Warning: Expecting numeric in D19812 / R19812C4: got 'n.a.'
## Warning: Expecting numeric in D19813 / R19813C4: got 'n.a.'
## Warning: Expecting numeric in D19814 / R19814C4: got 'n.a.'
## Warning: Expecting numeric in D19815 / R19815C4: got 'n.a.'
## Warning: Expecting numeric in D19816 / R19816C4: got 'n.a.'
## Warning: Expecting numeric in D19817 / R19817C4: got 'n.a.'
## Warning: Expecting numeric in D19818 / R19818C4: got 'n.a.'
## Warning: Expecting numeric in D19819 / R19819C4: got 'n.a.'
## Warning: Expecting numeric in D19820 / R19820C4: got 'n.a.'
## Warning: Expecting numeric in D19821 / R19821C4: got 'n.a.'
## Warning: Expecting numeric in D19822 / R19822C4: got 'n.a.'
## Warning: Expecting numeric in D19823 / R19823C4: got 'n.a.'
## Warning: Expecting numeric in D19824 / R19824C4: got 'n.a.'
## Warning: Expecting numeric in D19825 / R19825C4: got 'n.a.'
## Warning: Expecting numeric in D19826 / R19826C4: got 'n.a.'
## Warning: Expecting numeric in D19827 / R19827C4: got 'n.a.'
## Warning: Expecting numeric in D19828 / R19828C4: got 'n.a.'
## Warning: Expecting numeric in D19829 / R19829C4: got 'n.a.'
## Warning: Expecting numeric in D19830 / R19830C4: got 'n.a.'
## Warning: Expecting numeric in D19831 / R19831C4: got 'n.a.'
## Warning: Expecting numeric in D19832 / R19832C4: got 'n.a.'
## Warning: Expecting numeric in D19833 / R19833C4: got 'n.a.'
## Warning: Expecting numeric in D19834 / R19834C4: got 'n.a.'
## Warning: Expecting numeric in D19835 / R19835C4: got 'n.a.'
## Warning: Expecting numeric in D19836 / R19836C4: got 'n.a.'
## Warning: Expecting numeric in D19837 / R19837C4: got 'n.a.'
## Warning: Expecting numeric in D19838 / R19838C4: got 'n.a.'
## Warning: Expecting numeric in D19839 / R19839C4: got 'n.a.'
## Warning: Expecting numeric in D19840 / R19840C4: got 'n.a.'
## Warning: Expecting numeric in D19841 / R19841C4: got 'n.a.'
## Warning: Expecting numeric in D19842 / R19842C4: got 'n.a.'
## Warning: Expecting numeric in D19843 / R19843C4: got 'n.a.'
## Warning: Expecting numeric in D19844 / R19844C4: got 'n.a.'
## Warning: Expecting numeric in D19845 / R19845C4: got 'n.a.'
## Warning: Expecting numeric in D19846 / R19846C4: got 'n.a.'
## Warning: Expecting numeric in D19847 / R19847C4: got 'n.a.'
## Warning: Expecting numeric in D19848 / R19848C4: got 'n.a.'
## Warning: Expecting numeric in D19849 / R19849C4: got 'n.a.'
## Warning: Expecting numeric in D19850 / R19850C4: got 'n.a.'
## Warning: Expecting numeric in D19851 / R19851C4: got 'n.a.'
## Warning: Expecting numeric in D19852 / R19852C4: got 'n.a.'
## Warning: Expecting numeric in D19853 / R19853C4: got 'n.a.'
## Warning: Expecting numeric in D19854 / R19854C4: got 'n.a.'
## Warning: Expecting numeric in D19855 / R19855C4: got 'n.a.'
## Warning: Expecting numeric in D19856 / R19856C4: got 'n.a.'
## Warning: Expecting numeric in D19857 / R19857C4: got 'n.a.'
## Warning: Expecting numeric in D19858 / R19858C4: got 'n.a.'
## Warning: Expecting numeric in D19859 / R19859C4: got 'n.a.'
## Warning: Expecting numeric in D19860 / R19860C4: got 'n.a.'
## Warning: Expecting numeric in D19861 / R19861C4: got 'n.a.'
## Warning: Expecting numeric in D19862 / R19862C4: got 'n.a.'
## Warning: Expecting numeric in D19863 / R19863C4: got 'n.a.'
## Warning: Expecting numeric in D19864 / R19864C4: got 'n.a.'
## Warning: Expecting numeric in D19865 / R19865C4: got 'n.a.'
## Warning: Expecting numeric in D19866 / R19866C4: got 'n.a.'
## Warning: Expecting numeric in D19867 / R19867C4: got 'n.a.'
## Warning: Expecting numeric in D19868 / R19868C4: got 'n.a.'
## Warning: Expecting numeric in D19869 / R19869C4: got 'n.a.'
## Warning: Expecting numeric in D19870 / R19870C4: got 'n.a.'
## Warning: Expecting numeric in D19871 / R19871C4: got 'n.a.'
## Warning: Expecting numeric in D19872 / R19872C4: got 'n.a.'
## Warning: Expecting numeric in D19873 / R19873C4: got 'n.a.'
## Warning: Expecting numeric in D19874 / R19874C4: got 'n.a.'
## Warning: Expecting numeric in D19875 / R19875C4: got 'n.a.'
## Warning: Expecting numeric in D19876 / R19876C4: got 'n.a.'
## Warning: Expecting numeric in D19877 / R19877C4: got 'n.a.'
## Warning: Expecting numeric in D19878 / R19878C4: got 'n.a.'
## Warning: Expecting numeric in D19879 / R19879C4: got 'n.a.'
## Warning: Expecting numeric in D19880 / R19880C4: got 'n.a.'
## Warning: Expecting numeric in D19881 / R19881C4: got 'n.a.'
## Warning: Expecting numeric in D19882 / R19882C4: got 'n.a.'
## Warning: Expecting numeric in D19883 / R19883C4: got 'n.a.'
## Warning: Expecting numeric in D19884 / R19884C4: got 'n.a.'
## Warning: Expecting numeric in D19885 / R19885C4: got 'n.a.'
## Warning: Expecting numeric in D19886 / R19886C4: got 'n.a.'
## Warning: Expecting numeric in D19887 / R19887C4: got 'n.a.'
## Warning: Expecting numeric in D19888 / R19888C4: got 'n.a.'
## Warning: Expecting numeric in D19889 / R19889C4: got 'n.a.'
## Warning: Expecting numeric in D19890 / R19890C4: got 'n.a.'
## Warning: Expecting numeric in D19891 / R19891C4: got 'n.a.'
## Warning: Expecting numeric in D19892 / R19892C4: got 'n.a.'
## Warning: Expecting numeric in D19893 / R19893C4: got 'n.a.'
## Warning: Expecting numeric in D19894 / R19894C4: got 'n.a.'
## Warning: Expecting numeric in D19895 / R19895C4: got 'n.a.'
## Warning: Expecting numeric in D19896 / R19896C4: got 'n.a.'
## Warning: Expecting numeric in D19897 / R19897C4: got 'n.a.'
## Warning: Expecting numeric in D19898 / R19898C4: got 'n.a.'
## Warning: Expecting numeric in D19899 / R19899C4: got 'n.a.'
## Warning: Expecting numeric in D19900 / R19900C4: got 'n.a.'
## Warning: Expecting numeric in D19901 / R19901C4: got 'n.a.'
## Warning: Expecting numeric in D19902 / R19902C4: got 'n.a.'
## Warning: Expecting numeric in D19903 / R19903C4: got 'n.a.'
## Warning: Expecting numeric in D19904 / R19904C4: got 'n.a.'
## Warning: Expecting numeric in D19905 / R19905C4: got 'n.a.'
## Warning: Expecting numeric in D19906 / R19906C4: got 'n.a.'
## Warning: Expecting numeric in D19907 / R19907C4: got 'n.a.'
## Warning: Expecting numeric in D19908 / R19908C4: got 'n.a.'
## Warning: Expecting numeric in D19909 / R19909C4: got 'n.a.'
## Warning: Expecting numeric in D19910 / R19910C4: got 'n.a.'
## Warning: Expecting numeric in D19911 / R19911C4: got 'n.a.'
## Warning: Expecting numeric in D19912 / R19912C4: got 'n.a.'
## Warning: Expecting numeric in D19913 / R19913C4: got 'n.a.'
## Warning: Expecting numeric in D19914 / R19914C4: got 'n.a.'
## Warning: Expecting numeric in D19915 / R19915C4: got 'n.a.'
## Warning: Expecting numeric in D19916 / R19916C4: got 'n.a.'
## Warning: Expecting numeric in D19917 / R19917C4: got 'n.a.'
## Warning: Expecting numeric in D19918 / R19918C4: got 'n.a.'
## Warning: Expecting numeric in D19919 / R19919C4: got 'n.a.'
## Warning: Expecting numeric in D19920 / R19920C4: got 'n.a.'
## Warning: Expecting numeric in D19921 / R19921C4: got 'n.a.'
## Warning: Expecting numeric in D19922 / R19922C4: got 'n.a.'
## Warning: Expecting numeric in D19923 / R19923C4: got 'n.a.'
## Warning: Expecting numeric in D19924 / R19924C4: got 'n.a.'
## Warning: Expecting numeric in D19925 / R19925C4: got 'n.a.'
## Warning: Expecting numeric in D19926 / R19926C4: got 'n.a.'
## Warning: Expecting numeric in D19927 / R19927C4: got 'n.a.'
## Warning: Expecting numeric in D19928 / R19928C4: got 'n.a.'
## Warning: Expecting numeric in D19929 / R19929C4: got 'n.a.'
## Warning: Expecting numeric in D19930 / R19930C4: got 'n.a.'
## Warning: Expecting numeric in D19931 / R19931C4: got 'n.a.'
## Warning: Expecting numeric in D19932 / R19932C4: got 'n.a.'
## Warning: Expecting numeric in D19933 / R19933C4: got 'n.a.'
## Warning: Expecting numeric in D19934 / R19934C4: got 'n.a.'
## Warning: Expecting numeric in D19935 / R19935C4: got 'n.a.'
## Warning: Expecting numeric in D19936 / R19936C4: got 'n.a.'
## Warning: Expecting numeric in D19937 / R19937C4: got 'n.a.'
## Warning: Expecting numeric in D19938 / R19938C4: got 'n.a.'
## Warning: Expecting numeric in D19939 / R19939C4: got 'n.a.'
## Warning: Expecting numeric in D19940 / R19940C4: got 'n.a.'
## Warning: Expecting numeric in D19941 / R19941C4: got 'n.a.'
## Warning: Expecting numeric in D19942 / R19942C4: got 'n.a.'
## Warning: Expecting numeric in D19943 / R19943C4: got 'n.a.'
## Warning: Expecting numeric in D19944 / R19944C4: got 'n.a.'
## Warning: Expecting numeric in D19945 / R19945C4: got 'n.a.'
## Warning: Expecting numeric in D19946 / R19946C4: got 'n.a.'
## Warning: Expecting numeric in D19947 / R19947C4: got 'n.a.'
## Warning: Expecting numeric in D19948 / R19948C4: got 'n.a.'
## Warning: Expecting numeric in D19949 / R19949C4: got 'n.a.'
## Warning: Expecting numeric in D19950 / R19950C4: got 'n.a.'
## Warning: Expecting numeric in D19951 / R19951C4: got 'n.a.'
## Warning: Expecting numeric in D19952 / R19952C4: got 'n.a.'
## Warning: Expecting numeric in D19953 / R19953C4: got 'n.a.'
## Warning: Expecting numeric in D19954 / R19954C4: got 'n.a.'
## Warning: Expecting numeric in D19955 / R19955C4: got 'n.a.'
## Warning: Expecting numeric in D19956 / R19956C4: got 'n.a.'
## Warning: Expecting numeric in D19957 / R19957C4: got 'n.a.'
## Warning: Expecting numeric in D19958 / R19958C4: got 'n.a.'
## Warning: Expecting numeric in D19959 / R19959C4: got 'n.a.'
## Warning: Expecting numeric in D19960 / R19960C4: got 'n.a.'
## Warning: Expecting numeric in D19961 / R19961C4: got 'n.a.'
## Warning: Expecting numeric in D19962 / R19962C4: got 'n.a.'
## Warning: Expecting numeric in D19963 / R19963C4: got 'n.a.'
## Warning: Expecting numeric in D19964 / R19964C4: got 'n.a.'
## Warning: Expecting numeric in D19965 / R19965C4: got 'n.a.'
## Warning: Expecting numeric in D19966 / R19966C4: got 'n.a.'
## Warning: Expecting numeric in D19967 / R19967C4: got 'n.a.'
## Warning: Expecting numeric in D19968 / R19968C4: got 'n.a.'
## Warning: Expecting numeric in D19969 / R19969C4: got 'n.a.'
## Warning: Expecting numeric in D19970 / R19970C4: got 'n.a.'
## Warning: Expecting numeric in D19971 / R19971C4: got 'n.a.'
## Warning: Expecting numeric in D19972 / R19972C4: got 'n.a.'
## Warning: Expecting numeric in D19973 / R19973C4: got 'n.a.'
## Warning: Expecting numeric in D19974 / R19974C4: got 'n.a.'
## Warning: Expecting numeric in D19975 / R19975C4: got 'n.a.'
## Warning: Expecting numeric in D19976 / R19976C4: got 'n.a.'
## Warning: Expecting numeric in D19977 / R19977C4: got 'n.a.'
## Warning: Expecting numeric in D19978 / R19978C4: got 'n.a.'
## Warning: Expecting numeric in D19979 / R19979C4: got 'n.a.'
## Warning: Expecting numeric in D19980 / R19980C4: got 'n.a.'
## Warning: Expecting numeric in D19981 / R19981C4: got 'n.a.'
## Warning: Expecting numeric in D19982 / R19982C4: got 'n.a.'
## Warning: Expecting numeric in D19983 / R19983C4: got 'n.a.'
## Warning: Expecting numeric in D19984 / R19984C4: got 'n.a.'
## Warning: Expecting numeric in D19985 / R19985C4: got 'n.a.'
## Warning: Expecting numeric in D19986 / R19986C4: got 'n.a.'
## Warning: Expecting numeric in D19987 / R19987C4: got 'n.a.'
## Warning: Expecting numeric in D19988 / R19988C4: got 'n.a.'
## Warning: Expecting numeric in D19989 / R19989C4: got 'n.a.'
## Warning: Expecting numeric in D19990 / R19990C4: got 'n.a.'
## Warning: Expecting numeric in D19991 / R19991C4: got 'n.a.'
## Warning: Expecting numeric in D19992 / R19992C4: got 'n.a.'
## Warning: Expecting numeric in D19993 / R19993C4: got 'n.a.'
## Warning: Expecting numeric in D19994 / R19994C4: got 'n.a.'
## Warning: Expecting numeric in D19995 / R19995C4: got 'n.a.'
## Warning: Expecting numeric in D19996 / R19996C4: got 'n.a.'
## Warning: Expecting numeric in D19997 / R19997C4: got 'n.a.'
## Warning: Expecting numeric in D19998 / R19998C4: got 'n.a.'
## Warning: Expecting numeric in D19999 / R19999C4: got 'n.a.'
## Warning: Expecting numeric in D20000 / R20000C4: got 'n.a.'
## Warning: Expecting numeric in D20001 / R20001C4: got 'n.a.'
## Warning: Expecting numeric in D20002 / R20002C4: got 'n.a.'
## Warning: Expecting numeric in D20003 / R20003C4: got 'n.a.'
## Warning: Expecting numeric in D20004 / R20004C4: got 'n.a.'
## Warning: Expecting numeric in D20005 / R20005C4: got 'n.a.'
## Warning: Expecting numeric in D20006 / R20006C4: got 'n.a.'
## Warning: Expecting numeric in D20007 / R20007C4: got 'n.a.'
## Warning: Expecting numeric in D20008 / R20008C4: got 'n.a.'
## Warning: Expecting numeric in D20009 / R20009C4: got 'n.a.'
## Warning: Expecting numeric in D20010 / R20010C4: got 'n.a.'
## Warning: Expecting numeric in D20011 / R20011C4: got 'n.a.'
## Warning: Expecting numeric in D20012 / R20012C4: got 'n.a.'
## Warning: Expecting numeric in D20013 / R20013C4: got 'n.a.'
## Warning: Expecting numeric in D20014 / R20014C4: got 'n.a.'
## Warning: Expecting numeric in D20015 / R20015C4: got 'n.a.'
## Warning: Expecting numeric in D20016 / R20016C4: got 'n.a.'
## Warning: Expecting numeric in D20017 / R20017C4: got 'n.a.'
## Warning: Expecting numeric in D20018 / R20018C4: got 'n.a.'
## Warning: Expecting numeric in D20019 / R20019C4: got 'n.a.'
## Warning: Expecting numeric in D20020 / R20020C4: got 'n.a.'
## Warning: Expecting numeric in D20021 / R20021C4: got 'n.a.'
## Warning: Expecting numeric in D20022 / R20022C4: got 'n.a.'
## Warning: Expecting numeric in D20023 / R20023C4: got 'n.a.'
## Warning: Expecting numeric in D20024 / R20024C4: got 'n.a.'
## Warning: Expecting numeric in D20025 / R20025C4: got 'n.a.'
## Warning: Expecting numeric in D20026 / R20026C4: got 'n.a.'
## Warning: Expecting numeric in D20027 / R20027C4: got 'n.a.'
## Warning: Expecting numeric in D20028 / R20028C4: got 'n.a.'
## Warning: Expecting numeric in D20029 / R20029C4: got 'n.a.'
## Warning: Expecting numeric in D20030 / R20030C4: got 'n.a.'
## Warning: Expecting numeric in D20031 / R20031C4: got 'n.a.'
## Warning: Expecting numeric in D20032 / R20032C4: got 'n.a.'
## Warning: Expecting numeric in D20033 / R20033C4: got 'n.a.'
## Warning: Expecting numeric in D20034 / R20034C4: got 'n.a.'
## Warning: Expecting numeric in D20035 / R20035C4: got 'n.a.'
## Warning: Expecting numeric in D20036 / R20036C4: got 'n.a.'
## Warning: Expecting numeric in D20037 / R20037C4: got 'n.a.'
## Warning: Expecting numeric in D20038 / R20038C4: got 'n.a.'
## Warning: Expecting numeric in D20039 / R20039C4: got 'n.a.'
## Warning: Expecting numeric in D20040 / R20040C4: got 'n.a.'
## Warning: Expecting numeric in D20041 / R20041C4: got 'n.a.'
## Warning: Expecting numeric in D20042 / R20042C4: got 'n.a.'
## Warning: Expecting numeric in D20043 / R20043C4: got 'n.a.'
## Warning: Expecting numeric in D20044 / R20044C4: got 'n.a.'
## Warning: Expecting numeric in D20045 / R20045C4: got 'n.a.'
## Warning: Expecting numeric in D20046 / R20046C4: got 'n.a.'
## Warning: Expecting numeric in D20047 / R20047C4: got 'n.a.'
## Warning: Expecting numeric in D20048 / R20048C4: got 'n.a.'
## Warning: Expecting numeric in D20049 / R20049C4: got 'n.a.'
## Warning: Expecting numeric in D20050 / R20050C4: got 'n.a.'
## Warning: Expecting numeric in D20051 / R20051C4: got 'n.a.'
## Warning: Expecting numeric in D20052 / R20052C4: got 'n.a.'
## Warning: Expecting numeric in D20053 / R20053C4: got 'n.a.'
## Warning: Expecting numeric in D20054 / R20054C4: got 'n.a.'
## Warning: Expecting numeric in D20055 / R20055C4: got 'n.a.'
## Warning: Expecting numeric in D20056 / R20056C4: got 'n.a.'
## Warning: Expecting numeric in D20057 / R20057C4: got 'n.a.'
## Warning: Expecting numeric in D20058 / R20058C4: got 'n.a.'
## Warning: Expecting numeric in D20059 / R20059C4: got 'n.a.'
## Warning: Expecting numeric in D20060 / R20060C4: got 'n.a.'
## Warning: Expecting numeric in D20061 / R20061C4: got 'n.a.'
## Warning: Expecting numeric in D20062 / R20062C4: got 'n.a.'
## Warning: Expecting numeric in D20063 / R20063C4: got 'n.a.'
## Warning: Expecting numeric in D20064 / R20064C4: got 'n.a.'
## Warning: Expecting numeric in D20065 / R20065C4: got 'n.a.'
## Warning: Expecting numeric in D20066 / R20066C4: got 'n.a.'
## Warning: Expecting numeric in D20067 / R20067C4: got 'n.a.'
## Warning: Expecting numeric in D20068 / R20068C4: got 'n.a.'
## Warning: Expecting numeric in D20069 / R20069C4: got 'n.a.'
## Warning: Expecting numeric in D20070 / R20070C4: got 'n.a.'
## Warning: Expecting numeric in D20071 / R20071C4: got 'n.a.'
## Warning: Expecting numeric in D20072 / R20072C4: got 'n.a.'
## Warning: Expecting numeric in D20073 / R20073C4: got 'n.a.'
## Warning: Expecting numeric in D20074 / R20074C4: got 'n.a.'
## Warning: Expecting numeric in D20075 / R20075C4: got 'n.a.'
## Warning: Expecting numeric in D20076 / R20076C4: got 'n.a.'
## Warning: Expecting numeric in D20077 / R20077C4: got 'n.a.'
## Warning: Expecting numeric in D20078 / R20078C4: got 'n.a.'
## Warning: Expecting numeric in D20079 / R20079C4: got 'n.a.'
## Warning: Expecting numeric in D20080 / R20080C4: got 'n.a.'
## Warning: Expecting numeric in D20081 / R20081C4: got 'n.a.'
## Warning: Expecting numeric in D20082 / R20082C4: got 'n.a.'
## Warning: Expecting numeric in D20083 / R20083C4: got 'n.a.'
## Warning: Expecting numeric in D20084 / R20084C4: got 'n.a.'
## Warning: Expecting numeric in D20085 / R20085C4: got 'n.a.'
## Warning: Expecting numeric in D20086 / R20086C4: got 'n.a.'
## Warning: Expecting numeric in D20087 / R20087C4: got 'n.a.'
## Warning: Expecting numeric in D20088 / R20088C4: got 'n.a.'
## Warning: Expecting numeric in D20089 / R20089C4: got 'n.a.'
## Warning: Expecting numeric in D20090 / R20090C4: got 'n.a.'
## Warning: Expecting numeric in D20091 / R20091C4: got 'n.a.'
## Warning: Expecting numeric in D20092 / R20092C4: got 'n.a.'
## Warning: Expecting numeric in D20093 / R20093C4: got 'n.a.'
## Warning: Expecting numeric in D20094 / R20094C4: got 'n.a.'
## Warning: Expecting numeric in D20095 / R20095C4: got 'n.a.'
## Warning: Expecting numeric in D20096 / R20096C4: got 'n.a.'
## Warning: Expecting numeric in D20097 / R20097C4: got 'n.a.'
## Warning: Expecting numeric in D20098 / R20098C4: got 'n.a.'
## Warning: Expecting numeric in D20099 / R20099C4: got 'n.a.'
## Warning: Expecting numeric in D20100 / R20100C4: got 'n.a.'
## Warning: Expecting numeric in D20101 / R20101C4: got 'n.a.'
## Warning: Expecting numeric in D20102 / R20102C4: got 'n.a.'
## Warning: Expecting numeric in D20103 / R20103C4: got 'n.a.'
## Warning: Expecting numeric in D20104 / R20104C4: got 'n.a.'
## Warning: Expecting numeric in D20105 / R20105C4: got 'n.a.'
## Warning: Expecting numeric in D20106 / R20106C4: got 'n.a.'
## Warning: Expecting numeric in D20107 / R20107C4: got 'n.a.'
## Warning: Expecting numeric in D20108 / R20108C4: got 'n.a.'
## Warning: Expecting numeric in D20109 / R20109C4: got 'n.a.'
## Warning: Expecting numeric in D20110 / R20110C4: got 'n.a.'
## Warning: Expecting numeric in D20111 / R20111C4: got 'n.a.'
## Warning: Expecting numeric in D20112 / R20112C4: got 'n.a.'
## Warning: Expecting numeric in D20113 / R20113C4: got 'n.a.'
## Warning: Expecting numeric in D20114 / R20114C4: got 'n.a.'
## Warning: Expecting numeric in D20115 / R20115C4: got 'n.a.'
## Warning: Expecting numeric in D20116 / R20116C4: got 'n.a.'
## Warning: Expecting numeric in D20117 / R20117C4: got 'n.a.'
## Warning: Expecting numeric in D20118 / R20118C4: got 'n.a.'
## Warning: Expecting numeric in D20119 / R20119C4: got 'n.a.'
## Warning: Expecting numeric in D20120 / R20120C4: got 'n.a.'
## Warning: Expecting numeric in D20121 / R20121C4: got 'n.a.'
## Warning: Expecting numeric in D20122 / R20122C4: got 'n.a.'
## Warning: Expecting numeric in D20123 / R20123C4: got 'n.a.'
## Warning: Expecting numeric in D20124 / R20124C4: got 'n.a.'
## Warning: Expecting numeric in D20125 / R20125C4: got 'n.a.'
## Warning: Expecting numeric in D20126 / R20126C4: got 'n.a.'
## Warning: Expecting numeric in D20127 / R20127C4: got 'n.a.'
## Warning: Expecting numeric in D20128 / R20128C4: got 'n.a.'
## Warning: Expecting numeric in D20129 / R20129C4: got 'n.a.'
## Warning: Expecting numeric in D20130 / R20130C4: got 'n.a.'
## Warning: Expecting numeric in D20131 / R20131C4: got 'n.a.'
## Warning: Expecting numeric in D20132 / R20132C4: got 'n.a.'
## Warning: Expecting numeric in D20133 / R20133C4: got 'n.a.'
## Warning: Expecting numeric in D20134 / R20134C4: got 'n.a.'
## Warning: Expecting numeric in D20135 / R20135C4: got 'n.a.'
## Warning: Expecting numeric in D20136 / R20136C4: got 'n.a.'
## Warning: Expecting numeric in D20137 / R20137C4: got 'n.a.'
## Warning: Expecting numeric in D20138 / R20138C4: got 'n.a.'
## Warning: Expecting numeric in D20139 / R20139C4: got 'n.a.'
## Warning: Expecting numeric in D20140 / R20140C4: got 'n.a.'
## Warning: Expecting numeric in D20141 / R20141C4: got 'n.a.'
## Warning: Expecting numeric in D20142 / R20142C4: got 'n.a.'
## Warning: Expecting numeric in D20143 / R20143C4: got 'n.a.'
## Warning: Expecting numeric in D20144 / R20144C4: got 'n.a.'
## Warning: Expecting numeric in D20145 / R20145C4: got 'n.a.'
## Warning: Expecting numeric in D20146 / R20146C4: got 'n.a.'
## Warning: Expecting numeric in D20147 / R20147C4: got 'n.a.'
## Warning: Expecting numeric in D20148 / R20148C4: got 'n.a.'
## Warning: Expecting numeric in D20149 / R20149C4: got 'n.a.'
## Warning: Expecting numeric in D20150 / R20150C4: got 'n.a.'
## Warning: Expecting numeric in D20151 / R20151C4: got 'n.a.'
## Warning: Expecting numeric in D20152 / R20152C4: got 'n.a.'
## Warning: Expecting numeric in D20153 / R20153C4: got 'n.a.'
## Warning: Expecting numeric in D20154 / R20154C4: got 'n.a.'
## Warning: Expecting numeric in D20155 / R20155C4: got 'n.a.'
## Warning: Expecting numeric in D20156 / R20156C4: got 'n.a.'
## Warning: Expecting numeric in D20157 / R20157C4: got 'n.a.'
## Warning: Expecting numeric in D20158 / R20158C4: got 'n.a.'
## Warning: Expecting numeric in D20159 / R20159C4: got 'n.a.'
## Warning: Expecting numeric in D20160 / R20160C4: got 'n.a.'
## Warning: Expecting numeric in D20161 / R20161C4: got 'n.a.'
## Warning: Expecting numeric in D20162 / R20162C4: got 'n.a.'
## Warning: Expecting numeric in D20163 / R20163C4: got 'n.a.'
## Warning: Expecting numeric in D20164 / R20164C4: got 'n.a.'
## Warning: Expecting numeric in D20165 / R20165C4: got 'n.a.'
## Warning: Expecting numeric in D20166 / R20166C4: got 'n.a.'
## Warning: Expecting numeric in D20167 / R20167C4: got 'n.a.'
## Warning: Expecting numeric in D20168 / R20168C4: got 'n.a.'
## Warning: Expecting numeric in D20169 / R20169C4: got 'n.a.'
## Warning: Expecting numeric in D20170 / R20170C4: got 'n.a.'
## Warning: Expecting numeric in D20171 / R20171C4: got 'n.a.'
## Warning: Expecting numeric in D20172 / R20172C4: got 'n.a.'
## Warning: Expecting numeric in D20173 / R20173C4: got 'n.a.'
## Warning: Expecting numeric in D20174 / R20174C4: got 'n.a.'
## Warning: Expecting numeric in D20175 / R20175C4: got 'n.a.'
## Warning: Expecting numeric in D20176 / R20176C4: got 'n.a.'
## Warning: Expecting numeric in D20177 / R20177C4: got 'n.a.'
## Warning: Expecting numeric in D20178 / R20178C4: got 'n.a.'
## Warning: Expecting numeric in D20179 / R20179C4: got 'n.a.'
## Warning: Expecting numeric in D20180 / R20180C4: got 'n.a.'
## Warning: Expecting numeric in D20181 / R20181C4: got 'n.a.'
## Warning: Expecting numeric in D20182 / R20182C4: got 'n.a.'
## Warning: Expecting numeric in D20183 / R20183C4: got 'n.a.'
## Warning: Expecting numeric in D20184 / R20184C4: got 'n.a.'
## Warning: Expecting numeric in D20185 / R20185C4: got 'n.a.'
## Warning: Expecting numeric in D20186 / R20186C4: got 'n.a.'
## Warning: Expecting numeric in D20187 / R20187C4: got 'n.a.'
## Warning: Expecting numeric in D20188 / R20188C4: got 'n.a.'
## Warning: Expecting numeric in D20189 / R20189C4: got 'n.a.'
## Warning: Expecting numeric in D20190 / R20190C4: got 'n.a.'
## Warning: Expecting numeric in D20191 / R20191C4: got 'n.a.'
## Warning: Expecting numeric in D20192 / R20192C4: got 'n.a.'
## Warning: Expecting numeric in D20193 / R20193C4: got 'n.a.'
## Warning: Expecting numeric in D20194 / R20194C4: got 'n.a.'
## Warning: Expecting numeric in D20195 / R20195C4: got 'n.a.'
## Warning: Expecting numeric in D20196 / R20196C4: got 'n.a.'
## Warning: Expecting numeric in D20197 / R20197C4: got 'n.a.'
## Warning: Expecting numeric in D20198 / R20198C4: got 'n.a.'
## Warning: Expecting numeric in D20199 / R20199C4: got 'n.a.'
## Warning: Expecting numeric in D20200 / R20200C4: got 'n.a.'
## Warning: Expecting numeric in D20201 / R20201C4: got 'n.a.'
## Warning: Expecting numeric in D20202 / R20202C4: got 'n.a.'
## Warning: Expecting numeric in D20203 / R20203C4: got 'n.a.'
## Warning: Expecting numeric in D20204 / R20204C4: got 'n.a.'
## Warning: Expecting numeric in D20205 / R20205C4: got 'n.a.'
## Warning: Expecting numeric in D20206 / R20206C4: got 'n.a.'
## Warning: Expecting numeric in D20207 / R20207C4: got 'n.a.'
## Warning: Expecting numeric in D20208 / R20208C4: got 'n.a.'
## Warning: Expecting numeric in D20209 / R20209C4: got 'n.a.'
## Warning: Expecting numeric in D20210 / R20210C4: got 'n.a.'
## Warning: Expecting numeric in D20211 / R20211C4: got 'n.a.'
## Warning: Expecting numeric in D20212 / R20212C4: got 'n.a.'
## Warning: Expecting numeric in D20213 / R20213C4: got 'n.a.'
## Warning: Expecting numeric in D20214 / R20214C4: got 'n.a.'
## Warning: Expecting numeric in D20215 / R20215C4: got 'n.a.'
## Warning: Expecting numeric in D20216 / R20216C4: got 'n.a.'
## Warning: Expecting numeric in D20217 / R20217C4: got 'n.a.'
## Warning: Expecting numeric in D20218 / R20218C4: got 'n.a.'
## Warning: Expecting numeric in D20219 / R20219C4: got 'n.a.'
## Warning: Expecting numeric in D20220 / R20220C4: got 'n.a.'
## Warning: Expecting numeric in D20221 / R20221C4: got 'n.a.'
## Warning: Expecting numeric in D20222 / R20222C4: got 'n.a.'
## Warning: Expecting numeric in D20223 / R20223C4: got 'n.a.'
## Warning: Expecting numeric in D20224 / R20224C4: got 'n.a.'
## Warning: Expecting numeric in D20225 / R20225C4: got 'n.a.'
## Warning: Expecting numeric in D20226 / R20226C4: got 'n.a.'
## Warning: Expecting numeric in D20227 / R20227C4: got 'n.a.'
## Warning: Expecting numeric in D20228 / R20228C4: got 'n.a.'
## Warning: Expecting numeric in D20229 / R20229C4: got 'n.a.'
## Warning: Expecting numeric in D20230 / R20230C4: got 'n.a.'
## Warning: Expecting numeric in D20231 / R20231C4: got 'n.a.'
## Warning: Expecting numeric in D20232 / R20232C4: got 'n.a.'
## Warning: Expecting numeric in D20233 / R20233C4: got 'n.a.'
## Warning: Expecting numeric in D20234 / R20234C4: got 'n.a.'
## Warning: Expecting numeric in D20235 / R20235C4: got 'n.a.'
## Warning: Expecting numeric in D20236 / R20236C4: got 'n.a.'
## Warning: Expecting numeric in D20237 / R20237C4: got 'n.a.'
## Warning: Expecting numeric in D20238 / R20238C4: got 'n.a.'
## Warning: Expecting numeric in D20239 / R20239C4: got 'n.a.'
## Warning: Expecting numeric in D20240 / R20240C4: got 'n.a.'
## Warning: Expecting numeric in D20241 / R20241C4: got 'n.a.'
## Warning: Expecting numeric in D20242 / R20242C4: got 'n.a.'
## Warning: Expecting numeric in D20243 / R20243C4: got 'n.a.'
## Warning: Expecting numeric in D20244 / R20244C4: got 'n.a.'
## Warning: Expecting numeric in D20245 / R20245C4: got 'n.a.'
## Warning: Expecting numeric in D20246 / R20246C4: got 'n.a.'
## Warning: Expecting numeric in D20247 / R20247C4: got 'n.a.'
## Warning: Expecting numeric in D20248 / R20248C4: got 'n.a.'
## Warning: Expecting numeric in D20249 / R20249C4: got 'n.a.'
## Warning: Expecting numeric in D20250 / R20250C4: got 'n.a.'
## Warning: Expecting numeric in D20251 / R20251C4: got 'n.a.'
## Warning: Expecting numeric in D20252 / R20252C4: got 'n.a.'
## Warning: Expecting numeric in D20253 / R20253C4: got 'n.a.'
## Warning: Expecting numeric in D20254 / R20254C4: got 'n.a.'
## Warning: Expecting numeric in D20255 / R20255C4: got 'n.a.'
## Warning: Expecting numeric in D20256 / R20256C4: got 'n.a.'
## Warning: Expecting numeric in D20257 / R20257C4: got 'n.a.'
## Warning: Expecting numeric in D20258 / R20258C4: got 'n.a.'
## Warning: Expecting numeric in D20259 / R20259C4: got 'n.a.'
## Warning: Expecting numeric in D20260 / R20260C4: got 'n.a.'
## Warning: Expecting numeric in D20261 / R20261C4: got 'n.a.'
## Warning: Expecting numeric in D20262 / R20262C4: got 'n.a.'
## Warning: Expecting numeric in D20263 / R20263C4: got 'n.a.'
## Warning: Expecting numeric in D20264 / R20264C4: got 'n.a.'
## Warning: Expecting numeric in D20265 / R20265C4: got 'n.a.'
## Warning: Expecting numeric in D20266 / R20266C4: got 'n.a.'
## Warning: Expecting numeric in D20267 / R20267C4: got 'n.a.'
## Warning: Expecting numeric in D20268 / R20268C4: got 'n.a.'
## Warning: Expecting numeric in D20269 / R20269C4: got 'n.a.'
## Warning: Expecting numeric in D20270 / R20270C4: got 'n.a.'
## Warning: Expecting numeric in D20271 / R20271C4: got 'n.a.'
## Warning: Expecting numeric in D20272 / R20272C4: got 'n.a.'
## Warning: Expecting numeric in D20273 / R20273C4: got 'n.a.'
## Warning: Expecting numeric in D20274 / R20274C4: got 'n.a.'
## Warning: Expecting numeric in D20275 / R20275C4: got 'n.a.'
## Warning: Expecting numeric in D20276 / R20276C4: got 'n.a.'
## Warning: Expecting numeric in D20277 / R20277C4: got 'n.a.'
## Warning: Expecting numeric in D20278 / R20278C4: got 'n.a.'
## Warning: Expecting numeric in D20279 / R20279C4: got 'n.a.'
## Warning: Expecting numeric in D20280 / R20280C4: got 'n.a.'
## Warning: Expecting numeric in D20281 / R20281C4: got 'n.a.'
## Warning: Expecting numeric in D20282 / R20282C4: got 'n.a.'
## Warning: Expecting numeric in D20283 / R20283C4: got 'n.a.'
## Warning: Expecting numeric in D20284 / R20284C4: got 'n.a.'
## Warning: Expecting numeric in D20285 / R20285C4: got 'n.a.'
## Warning: Expecting numeric in D20286 / R20286C4: got 'n.a.'
## Warning: Expecting numeric in D20287 / R20287C4: got 'n.a.'
## Warning: Expecting numeric in D20288 / R20288C4: got 'n.a.'
## Warning: Expecting numeric in D20289 / R20289C4: got 'n.a.'
## Warning: Expecting numeric in D20290 / R20290C4: got 'n.a.'
## Warning: Expecting numeric in D20291 / R20291C4: got 'n.a.'
## Warning: Expecting numeric in D20292 / R20292C4: got 'n.a.'
## Warning: Expecting numeric in D20293 / R20293C4: got 'n.a.'
## Warning: Expecting numeric in D20294 / R20294C4: got 'n.a.'
## Warning: Expecting numeric in D20295 / R20295C4: got 'n.a.'
## Warning: Expecting numeric in D20296 / R20296C4: got 'n.a.'
## Warning: Expecting numeric in D20297 / R20297C4: got 'n.a.'
## Warning: Expecting numeric in D20298 / R20298C4: got 'n.a.'
## Warning: Expecting numeric in D20299 / R20299C4: got 'n.a.'
## Warning: Expecting numeric in D20300 / R20300C4: got 'n.a.'
## Warning: Expecting numeric in D20301 / R20301C4: got 'n.a.'
## Warning: Expecting numeric in D20302 / R20302C4: got 'n.a.'
## Warning: Expecting numeric in D20303 / R20303C4: got 'n.a.'
## Warning: Expecting numeric in D20304 / R20304C4: got 'n.a.'
## Warning: Expecting numeric in D20305 / R20305C4: got 'n.a.'
## Warning: Expecting numeric in D20306 / R20306C4: got 'n.a.'
## Warning: Expecting numeric in D20307 / R20307C4: got 'n.a.'
## Warning: Expecting numeric in D20308 / R20308C4: got 'n.a.'
## Warning: Expecting numeric in D20309 / R20309C4: got 'n.a.'
## Warning: Expecting numeric in D20310 / R20310C4: got 'n.a.'
## Warning: Expecting numeric in D20311 / R20311C4: got 'n.a.'
## Warning: Expecting numeric in D20312 / R20312C4: got 'n.a.'
## Warning: Expecting numeric in D20313 / R20313C4: got 'n.a.'
## Warning: Expecting numeric in D20314 / R20314C4: got 'n.a.'
## Warning: Expecting numeric in D20315 / R20315C4: got 'n.a.'
## Warning: Expecting numeric in D20316 / R20316C4: got 'n.a.'
## Warning: Expecting numeric in D20317 / R20317C4: got 'n.a.'
## Warning: Expecting numeric in D20318 / R20318C4: got 'n.a.'
## Warning: Expecting numeric in D20319 / R20319C4: got 'n.a.'
## Warning: Expecting numeric in D20320 / R20320C4: got 'n.a.'
## Warning: Expecting numeric in D20321 / R20321C4: got 'n.a.'
## Warning: Expecting numeric in D20322 / R20322C4: got 'n.a.'
## Warning: Expecting numeric in D20323 / R20323C4: got 'n.a.'
## Warning: Expecting numeric in D20324 / R20324C4: got 'n.a.'
## Warning: Expecting numeric in D20325 / R20325C4: got 'n.a.'
## Warning: Expecting numeric in D20326 / R20326C4: got 'n.a.'
## Warning: Expecting numeric in D20327 / R20327C4: got 'n.a.'
## Warning: Expecting numeric in D20328 / R20328C4: got 'n.a.'
## Warning: Expecting numeric in D20329 / R20329C4: got 'n.a.'
## Warning: Expecting numeric in D20330 / R20330C4: got 'n.a.'
## Warning: Expecting numeric in D20331 / R20331C4: got 'n.a.'
## Warning: Expecting numeric in D20332 / R20332C4: got 'n.a.'
## Warning: Expecting numeric in D20333 / R20333C4: got 'n.a.'
## Warning: Expecting numeric in D20334 / R20334C4: got 'n.a.'
## Warning: Expecting numeric in D20335 / R20335C4: got 'n.a.'
## Warning: Expecting numeric in D20336 / R20336C4: got 'n.a.'
## Warning: Expecting numeric in D20337 / R20337C4: got 'n.a.'
## Warning: Expecting numeric in D20338 / R20338C4: got 'n.a.'
## Warning: Expecting numeric in D20339 / R20339C4: got 'n.a.'
## Warning: Expecting numeric in D20340 / R20340C4: got 'n.a.'
## Warning: Expecting numeric in D20341 / R20341C4: got 'n.a.'
## Warning: Expecting numeric in D20342 / R20342C4: got 'n.a.'
## Warning: Expecting numeric in D20343 / R20343C4: got 'n.a.'
## Warning: Expecting numeric in D20344 / R20344C4: got 'n.a.'
## Warning: Expecting numeric in D20345 / R20345C4: got 'n.a.'
## Warning: Expecting numeric in D20346 / R20346C4: got 'n.a.'
## Warning: Expecting numeric in D20347 / R20347C4: got 'n.a.'
## Warning: Expecting numeric in D20348 / R20348C4: got 'n.a.'
## Warning: Expecting numeric in D20349 / R20349C4: got 'n.a.'
## Warning: Expecting numeric in D20350 / R20350C4: got 'n.a.'
## Warning: Expecting numeric in D20351 / R20351C4: got 'n.a.'
## Warning: Expecting numeric in D20352 / R20352C4: got 'n.a.'
## Warning: Expecting numeric in D20353 / R20353C4: got 'n.a.'
## Warning: Expecting numeric in D20354 / R20354C4: got 'n.a.'
## Warning: Expecting numeric in D20355 / R20355C4: got 'n.a.'
## Warning: Expecting numeric in D20356 / R20356C4: got 'n.a.'
## Warning: Expecting numeric in D20357 / R20357C4: got 'n.a.'
## Warning: Expecting numeric in D20358 / R20358C4: got 'n.a.'
## Warning: Expecting numeric in D20359 / R20359C4: got 'n.a.'
## Warning: Expecting numeric in D20360 / R20360C4: got 'n.a.'
## Warning: Expecting numeric in D20361 / R20361C4: got 'n.a.'
## Warning: Expecting numeric in D20362 / R20362C4: got 'n.a.'
## Warning: Expecting numeric in D20363 / R20363C4: got 'n.a.'
## Warning: Expecting numeric in D20364 / R20364C4: got 'n.a.'
## Warning: Expecting numeric in D20365 / R20365C4: got 'n.a.'
## Warning: Expecting numeric in D20366 / R20366C4: got 'n.a.'
## Warning: Expecting numeric in D20367 / R20367C4: got 'n.a.'
## Warning: Expecting numeric in D20368 / R20368C4: got 'n.a.'
## Warning: Expecting numeric in D20369 / R20369C4: got 'n.a.'
## Warning: Expecting numeric in D20370 / R20370C4: got 'n.a.'
## Warning: Expecting numeric in D20371 / R20371C4: got 'n.a.'
## Warning: Expecting numeric in D20372 / R20372C4: got 'n.a.'
## Warning: Expecting numeric in D20373 / R20373C4: got 'n.a.'
## Warning: Expecting numeric in D20374 / R20374C4: got 'n.a.'
## Warning: Expecting numeric in D20375 / R20375C4: got 'n.a.'
## Warning: Expecting numeric in D20376 / R20376C4: got 'n.a.'
## Warning: Expecting numeric in D20377 / R20377C4: got 'n.a.'
## Warning: Expecting numeric in D20378 / R20378C4: got 'n.a.'
## Warning: Expecting numeric in D20379 / R20379C4: got 'n.a.'
## Warning: Expecting numeric in D20380 / R20380C4: got 'n.a.'
## Warning: Expecting numeric in D20381 / R20381C4: got 'n.a.'
## Warning: Expecting numeric in D20382 / R20382C4: got 'n.a.'
## Warning: Expecting numeric in D20383 / R20383C4: got 'n.a.'
## Warning: Expecting numeric in D20384 / R20384C4: got 'n.a.'
## Warning: Expecting numeric in D20385 / R20385C4: got 'n.a.'
## Warning: Expecting numeric in D20386 / R20386C4: got 'n.a.'
## Warning: Expecting numeric in D20387 / R20387C4: got 'n.a.'
## Warning: Expecting numeric in D20388 / R20388C4: got 'n.a.'
## Warning: Expecting numeric in D20389 / R20389C4: got 'n.a.'
## Warning: Expecting numeric in D20390 / R20390C4: got 'n.a.'
## Warning: Expecting numeric in D20391 / R20391C4: got 'n.a.'
## Warning: Expecting numeric in D20392 / R20392C4: got 'n.a.'
## Warning: Expecting numeric in D20393 / R20393C4: got 'n.a.'
## Warning: Expecting numeric in D20394 / R20394C4: got 'n.a.'
## Warning: Expecting numeric in D20395 / R20395C4: got 'n.a.'
## Warning: Expecting numeric in D20396 / R20396C4: got 'n.a.'
## Warning: Expecting numeric in D20397 / R20397C4: got 'n.a.'
## Warning: Expecting numeric in D20398 / R20398C4: got 'n.a.'
## Warning: Expecting numeric in D20399 / R20399C4: got 'n.a.'
## Warning: Expecting numeric in D20400 / R20400C4: got 'n.a.'
## Warning: Expecting numeric in D20401 / R20401C4: got 'n.a.'
## Warning: Expecting numeric in D20402 / R20402C4: got 'n.a.'
## Warning: Expecting numeric in D20403 / R20403C4: got 'n.a.'
## Warning: Expecting numeric in D20404 / R20404C4: got 'n.a.'
## Warning: Expecting numeric in D20405 / R20405C4: got 'n.a.'
## Warning: Expecting numeric in D20406 / R20406C4: got 'n.a.'
## Warning: Expecting numeric in D20407 / R20407C4: got 'n.a.'
## Warning: Expecting numeric in D20408 / R20408C4: got 'n.a.'
## Warning: Expecting numeric in D20409 / R20409C4: got 'n.a.'
## Warning: Expecting numeric in D20410 / R20410C4: got 'n.a.'
## Warning: Expecting numeric in D20411 / R20411C4: got 'n.a.'
## Warning: Expecting numeric in D20412 / R20412C4: got 'n.a.'
## Warning: Expecting numeric in D20413 / R20413C4: got 'n.a.'
## Warning: Expecting numeric in D20414 / R20414C4: got 'n.a.'
## Warning: Expecting numeric in D20415 / R20415C4: got 'n.a.'
## Warning: Expecting numeric in D20416 / R20416C4: got 'n.a.'
## Warning: Expecting numeric in D20417 / R20417C4: got 'n.a.'
## Warning: Expecting numeric in D20418 / R20418C4: got 'n.a.'
## Warning: Expecting numeric in D20419 / R20419C4: got 'n.a.'
## Warning: Expecting numeric in D20420 / R20420C4: got 'n.a.'
## Warning: Expecting numeric in D20421 / R20421C4: got 'n.a.'
## Warning: Expecting numeric in D20422 / R20422C4: got 'n.a.'
## Warning: Expecting numeric in D20423 / R20423C4: got 'n.a.'
## Warning: Expecting numeric in D20424 / R20424C4: got 'n.a.'
## Warning: Expecting numeric in D20425 / R20425C4: got 'n.a.'
## Warning: Expecting numeric in D20426 / R20426C4: got 'n.a.'
## Warning: Expecting numeric in D20427 / R20427C4: got 'n.a.'
## Warning: Expecting numeric in D20428 / R20428C4: got 'n.a.'
## Warning: Expecting numeric in D20429 / R20429C4: got 'n.a.'
## Warning: Expecting numeric in D20430 / R20430C4: got 'n.a.'
## Warning: Expecting numeric in D20431 / R20431C4: got 'n.a.'
## Warning: Expecting numeric in D20432 / R20432C4: got 'n.a.'
## Warning: Expecting numeric in D20433 / R20433C4: got 'n.a.'
## Warning: Expecting numeric in D20434 / R20434C4: got 'n.a.'
## Warning: Expecting numeric in D20435 / R20435C4: got 'n.a.'
## Warning: Expecting numeric in D20436 / R20436C4: got 'n.a.'
## Warning: Expecting numeric in D20437 / R20437C4: got 'n.a.'
## Warning: Expecting numeric in D20438 / R20438C4: got 'n.a.'
## Warning: Expecting numeric in D20439 / R20439C4: got 'n.a.'
## Warning: Expecting numeric in D20440 / R20440C4: got 'n.a.'
## Warning: Expecting numeric in D20441 / R20441C4: got 'n.a.'
## Warning: Expecting numeric in D20442 / R20442C4: got 'n.a.'
## Warning: Expecting numeric in D20443 / R20443C4: got 'n.a.'
## Warning: Expecting numeric in D20444 / R20444C4: got 'n.a.'
## Warning: Expecting numeric in D20445 / R20445C4: got 'n.a.'
## Warning: Expecting numeric in D20446 / R20446C4: got 'n.a.'
## Warning: Expecting numeric in D20447 / R20447C4: got 'n.a.'
## Warning: Expecting numeric in D20448 / R20448C4: got 'n.a.'
## Warning: Expecting numeric in D20449 / R20449C4: got 'n.a.'
## Warning: Expecting numeric in D20450 / R20450C4: got 'n.a.'
## Warning: Expecting numeric in D20451 / R20451C4: got 'n.a.'
## Warning: Expecting numeric in D20452 / R20452C4: got 'n.a.'
## Warning: Expecting numeric in D20453 / R20453C4: got 'n.a.'
## Warning: Expecting numeric in D20454 / R20454C4: got 'n.a.'
## Warning: Expecting numeric in D20455 / R20455C4: got 'n.a.'
## Warning: Expecting numeric in D20456 / R20456C4: got 'n.a.'
## Warning: Expecting numeric in D20457 / R20457C4: got 'n.a.'
## Warning: Expecting numeric in D20458 / R20458C4: got 'n.a.'
## Warning: Expecting numeric in D20459 / R20459C4: got 'n.a.'
## Warning: Expecting numeric in D20460 / R20460C4: got 'n.a.'
## Warning: Expecting numeric in D20461 / R20461C4: got 'n.a.'
## Warning: Expecting numeric in D20462 / R20462C4: got 'n.a.'
## Warning: Expecting numeric in D20463 / R20463C4: got 'n.a.'
## Warning: Expecting numeric in D20464 / R20464C4: got 'n.a.'
## Warning: Expecting numeric in D20465 / R20465C4: got 'n.a.'
## Warning: Expecting numeric in D20466 / R20466C4: got 'n.a.'
## Warning: Expecting numeric in D20467 / R20467C4: got 'n.a.'
## Warning: Expecting numeric in D20468 / R20468C4: got 'n.a.'
## Warning: Expecting numeric in D20469 / R20469C4: got 'n.a.'
## Warning: Expecting numeric in D20470 / R20470C4: got 'n.a.'
## Warning: Expecting numeric in D20471 / R20471C4: got 'n.a.'
## Warning: Expecting numeric in D20472 / R20472C4: got 'n.a.'
## Warning: Expecting numeric in D20473 / R20473C4: got 'n.a.'
## Warning: Expecting numeric in D20474 / R20474C4: got 'n.a.'
## Warning: Expecting numeric in D20475 / R20475C4: got 'n.a.'
## Warning: Expecting numeric in D20476 / R20476C4: got 'n.a.'
## Warning: Expecting numeric in D20477 / R20477C4: got 'n.a.'
## Warning: Expecting numeric in D20478 / R20478C4: got 'n.a.'
## Warning: Expecting numeric in D20479 / R20479C4: got 'n.a.'
## Warning: Expecting numeric in D20480 / R20480C4: got 'n.a.'
## Warning: Expecting numeric in D20481 / R20481C4: got 'n.a.'
## Warning: Expecting numeric in D20482 / R20482C4: got 'n.a.'
## Warning: Expecting numeric in D20483 / R20483C4: got 'n.a.'
## Warning: Expecting numeric in D20484 / R20484C4: got 'n.a.'
## Warning: Expecting numeric in D20485 / R20485C4: got 'n.a.'
## Warning: Expecting numeric in D20486 / R20486C4: got 'n.a.'
## Warning: Expecting numeric in D20487 / R20487C4: got 'n.a.'
## Warning: Expecting numeric in D20488 / R20488C4: got 'n.a.'
## Warning: Expecting numeric in D20489 / R20489C4: got 'n.a.'
## Warning: Expecting numeric in D20490 / R20490C4: got 'n.a.'
## Warning: Expecting numeric in D20491 / R20491C4: got 'n.a.'
## Warning: Expecting numeric in D20492 / R20492C4: got 'n.a.'
## Warning: Expecting numeric in D20493 / R20493C4: got 'n.a.'
## Warning: Expecting numeric in D20494 / R20494C4: got 'n.a.'
## Warning: Expecting numeric in D20495 / R20495C4: got 'n.a.'
## Warning: Expecting numeric in D20496 / R20496C4: got 'n.a.'
## Warning: Expecting numeric in D20497 / R20497C4: got 'n.a.'
## Warning: Expecting numeric in D20498 / R20498C4: got 'n.a.'
## Warning: Expecting numeric in D20499 / R20499C4: got 'n.a.'
## Warning: Expecting numeric in D20500 / R20500C4: got 'n.a.'
## Warning: Expecting numeric in D20501 / R20501C4: got 'n.a.'
## Warning: Expecting numeric in D20502 / R20502C4: got 'n.a.'
## Warning: Expecting numeric in D20503 / R20503C4: got 'n.a.'
## Warning: Expecting numeric in D20504 / R20504C4: got 'n.a.'
## Warning: Expecting numeric in D20505 / R20505C4: got 'n.a.'
## Warning: Expecting numeric in D20506 / R20506C4: got 'n.a.'
## Warning: Expecting numeric in D20507 / R20507C4: got 'n.a.'
## Warning: Expecting numeric in D20508 / R20508C4: got 'n.a.'
## Warning: Expecting numeric in D20509 / R20509C4: got 'n.a.'
## Warning: Expecting numeric in D20510 / R20510C4: got 'n.a.'
## Warning: Expecting numeric in D20511 / R20511C4: got 'n.a.'
## Warning: Expecting numeric in D20512 / R20512C4: got 'n.a.'
## Warning: Expecting numeric in D20513 / R20513C4: got 'n.a.'
## Warning: Expecting numeric in D20514 / R20514C4: got 'n.a.'
## Warning: Expecting numeric in D20515 / R20515C4: got 'n.a.'
## Warning: Expecting numeric in D20516 / R20516C4: got 'n.a.'
## Warning: Expecting numeric in D20517 / R20517C4: got 'n.a.'
## Warning: Expecting numeric in D20518 / R20518C4: got 'n.a.'
## Warning: Expecting numeric in D20519 / R20519C4: got 'n.a.'
## Warning: Expecting numeric in D20520 / R20520C4: got 'n.a.'
## Warning: Expecting numeric in D20521 / R20521C4: got 'n.a.'
## Warning: Expecting numeric in D20522 / R20522C4: got 'n.a.'
## Warning: Expecting numeric in D20523 / R20523C4: got 'n.a.'
## Warning: Expecting numeric in D20524 / R20524C4: got 'n.a.'
## Warning: Expecting numeric in D20525 / R20525C4: got 'n.a.'
## Warning: Expecting numeric in D20526 / R20526C4: got 'n.a.'
## Warning: Expecting numeric in D20527 / R20527C4: got 'n.a.'
## Warning: Expecting numeric in D20528 / R20528C4: got 'n.a.'
## Warning: Expecting numeric in D20529 / R20529C4: got 'n.a.'
## Warning: Expecting numeric in D20530 / R20530C4: got 'n.a.'
## Warning: Expecting numeric in D20531 / R20531C4: got 'n.a.'
## Warning: Expecting numeric in D20532 / R20532C4: got 'n.a.'
## Warning: Expecting numeric in D20533 / R20533C4: got 'n.a.'
## Warning: Expecting numeric in D20534 / R20534C4: got 'n.a.'
## Warning: Expecting numeric in D20535 / R20535C4: got 'n.a.'
## Warning: Expecting numeric in D20536 / R20536C4: got 'n.a.'
## Warning: Expecting numeric in D20537 / R20537C4: got 'n.a.'
## Warning: Expecting numeric in D20538 / R20538C4: got 'n.a.'
## Warning: Expecting numeric in D20539 / R20539C4: got 'n.a.'
## Warning: Expecting numeric in D20540 / R20540C4: got 'n.a.'
## Warning: Expecting numeric in D20541 / R20541C4: got 'n.a.'
## Warning: Expecting numeric in D20542 / R20542C4: got 'n.a.'
## Warning: Expecting numeric in D20543 / R20543C4: got 'n.a.'
## Warning: Expecting numeric in D20544 / R20544C4: got 'n.a.'
## Warning: Expecting numeric in D20545 / R20545C4: got 'n.a.'
## Warning: Expecting numeric in D20546 / R20546C4: got 'n.a.'
## Warning: Expecting numeric in D20547 / R20547C4: got 'n.a.'
## Warning: Expecting numeric in D20548 / R20548C4: got 'n.a.'
## Warning: Expecting numeric in D20549 / R20549C4: got 'n.a.'
## Warning: Expecting numeric in D20550 / R20550C4: got 'n.a.'
## Warning: Expecting numeric in D20551 / R20551C4: got 'n.a.'
## Warning: Expecting numeric in D20552 / R20552C4: got 'n.a.'
## Warning: Expecting numeric in D20553 / R20553C4: got 'n.a.'
## Warning: Expecting numeric in D20554 / R20554C4: got 'n.a.'
## Warning: Expecting numeric in D20555 / R20555C4: got 'n.a.'
## Warning: Expecting numeric in D20556 / R20556C4: got 'n.a.'
## Warning: Expecting numeric in D20557 / R20557C4: got 'n.a.'
## Warning: Expecting numeric in D20558 / R20558C4: got 'n.a.'
## Warning: Expecting numeric in D20559 / R20559C4: got 'n.a.'
## Warning: Expecting numeric in D20560 / R20560C4: got 'n.a.'
## Warning: Expecting numeric in D20561 / R20561C4: got 'n.a.'
## Warning: Expecting numeric in D20562 / R20562C4: got 'n.a.'
## Warning: Expecting numeric in D20563 / R20563C4: got 'n.a.'
## Warning: Expecting numeric in D20564 / R20564C4: got 'n.a.'
## Warning: Expecting numeric in D20565 / R20565C4: got 'n.a.'
## Warning: Expecting numeric in D20566 / R20566C4: got 'n.a.'
## Warning: Expecting numeric in D20567 / R20567C4: got 'n.a.'
## Warning: Expecting numeric in D20568 / R20568C4: got 'n.a.'
## Warning: Expecting numeric in D20569 / R20569C4: got 'n.a.'
## Warning: Expecting numeric in D20570 / R20570C4: got 'n.a.'
## Warning: Expecting numeric in D20571 / R20571C4: got 'n.a.'
## Warning: Expecting numeric in D20572 / R20572C4: got 'n.a.'
## Warning: Expecting numeric in D20573 / R20573C4: got 'n.a.'
## Warning: Expecting numeric in D20574 / R20574C4: got 'n.a.'
## Warning: Expecting numeric in D20575 / R20575C4: got 'n.a.'
## Warning: Expecting numeric in D20576 / R20576C4: got 'n.a.'
## Warning: Expecting numeric in D20577 / R20577C4: got 'n.a.'
## Warning: Expecting numeric in D20578 / R20578C4: got 'n.a.'
## Warning: Expecting numeric in D20579 / R20579C4: got 'n.a.'
## Warning: Expecting numeric in D20580 / R20580C4: got 'n.a.'
## Warning: Expecting numeric in D20581 / R20581C4: got 'n.a.'
## Warning: Expecting numeric in D20582 / R20582C4: got 'n.a.'
## Warning: Expecting numeric in D20583 / R20583C4: got 'n.a.'
## Warning: Expecting numeric in D20584 / R20584C4: got 'n.a.'
## Warning: Expecting numeric in D20585 / R20585C4: got 'n.a.'
## Warning: Expecting numeric in D20586 / R20586C4: got 'n.a.'
## Warning: Expecting numeric in D20587 / R20587C4: got 'n.a.'
## Warning: Expecting numeric in D20588 / R20588C4: got 'n.a.'
## Warning: Expecting numeric in D20589 / R20589C4: got 'n.a.'
## Warning: Expecting numeric in D20590 / R20590C4: got 'n.a.'
## Warning: Expecting numeric in D20591 / R20591C4: got 'n.a.'
## Warning: Expecting numeric in D20592 / R20592C4: got 'n.a.'
## Warning: Expecting numeric in D20593 / R20593C4: got 'n.a.'
## Warning: Expecting numeric in D20594 / R20594C4: got 'n.a.'
## Warning: Expecting numeric in D20595 / R20595C4: got 'n.a.'
## Warning: Expecting numeric in D20596 / R20596C4: got 'n.a.'
## Warning: Expecting numeric in D20597 / R20597C4: got 'n.a.'
## Warning: Expecting numeric in D20598 / R20598C4: got 'n.a.'
## Warning: Expecting numeric in D20599 / R20599C4: got 'n.a.'
## Warning: Expecting numeric in D20600 / R20600C4: got 'n.a.'
## Warning: Expecting numeric in D20601 / R20601C4: got 'n.a.'
## Warning: Expecting numeric in D20602 / R20602C4: got 'n.a.'
## Warning: Expecting numeric in D20603 / R20603C4: got 'n.a.'
## Warning: Expecting numeric in D20604 / R20604C4: got 'n.a.'
## Warning: Expecting numeric in D20605 / R20605C4: got 'n.a.'
## Warning: Expecting numeric in D20606 / R20606C4: got 'n.a.'
## Warning: Expecting numeric in D20607 / R20607C4: got 'n.a.'
## Warning: Expecting numeric in D20608 / R20608C4: got 'n.a.'
## Warning: Expecting numeric in D20609 / R20609C4: got 'n.a.'
## Warning: Expecting numeric in D20610 / R20610C4: got 'n.a.'
## Warning: Expecting numeric in D20611 / R20611C4: got 'n.a.'
## Warning: Expecting numeric in D20612 / R20612C4: got 'n.a.'
## Warning: Expecting numeric in D20613 / R20613C4: got 'n.a.'
## Warning: Expecting numeric in D20614 / R20614C4: got 'n.a.'
## Warning: Expecting numeric in D20615 / R20615C4: got 'n.a.'
## Warning: Expecting numeric in D20616 / R20616C4: got 'n.a.'
## Warning: Expecting numeric in D20617 / R20617C4: got 'n.a.'
## Warning: Expecting numeric in D20618 / R20618C4: got 'n.a.'
## Warning: Expecting numeric in D20619 / R20619C4: got 'n.a.'
## Warning: Expecting numeric in D20620 / R20620C4: got 'n.a.'
## Warning: Expecting numeric in D20621 / R20621C4: got 'n.a.'
## Warning: Expecting numeric in D20622 / R20622C4: got 'n.a.'
## Warning: Expecting numeric in D20623 / R20623C4: got 'n.a.'
## Warning: Expecting numeric in D20624 / R20624C4: got 'n.a.'
## Warning: Expecting numeric in D20625 / R20625C4: got 'n.a.'
## Warning: Expecting numeric in D20626 / R20626C4: got 'n.a.'
## Warning: Expecting numeric in D20627 / R20627C4: got 'n.a.'
## Warning: Expecting numeric in D20628 / R20628C4: got 'n.a.'
## Warning: Expecting numeric in D20629 / R20629C4: got 'n.a.'
## Warning: Expecting numeric in D20630 / R20630C4: got 'n.a.'
## Warning: Expecting numeric in D20631 / R20631C4: got 'n.a.'
## Warning: Expecting numeric in D20632 / R20632C4: got 'n.a.'
## Warning: Expecting numeric in D20633 / R20633C4: got 'n.a.'
## Warning: Expecting numeric in D20634 / R20634C4: got 'n.a.'
## Warning: Expecting numeric in D20635 / R20635C4: got 'n.a.'
## Warning: Expecting numeric in D20636 / R20636C4: got 'n.a.'
## Warning: Expecting numeric in D20637 / R20637C4: got 'n.a.'
## Warning: Expecting numeric in D20638 / R20638C4: got 'n.a.'
## Warning: Expecting numeric in D20639 / R20639C4: got 'n.a.'
## Warning: Expecting numeric in D20640 / R20640C4: got 'n.a.'
## Warning: Expecting numeric in D20641 / R20641C4: got 'n.a.'
## Warning: Expecting numeric in D20642 / R20642C4: got 'n.a.'
## Warning: Expecting numeric in D20643 / R20643C4: got 'n.a.'
## Warning: Expecting numeric in D20644 / R20644C4: got 'n.a.'
## Warning: Expecting numeric in D20645 / R20645C4: got 'n.a.'
## Warning: Expecting numeric in D20646 / R20646C4: got 'n.a.'
## Warning: Expecting numeric in D20647 / R20647C4: got 'n.a.'
## Warning: Expecting numeric in D20648 / R20648C4: got 'n.a.'
## Warning: Expecting numeric in D20649 / R20649C4: got 'n.a.'
## Warning: Expecting numeric in D20650 / R20650C4: got 'n.a.'
## Warning: Expecting numeric in D20651 / R20651C4: got 'n.a.'
## Warning: Expecting numeric in D20652 / R20652C4: got 'n.a.'
## Warning: Expecting numeric in D20653 / R20653C4: got 'n.a.'
## Warning: Expecting numeric in D20654 / R20654C4: got 'n.a.'
## Warning: Expecting numeric in D20655 / R20655C4: got 'n.a.'
## Warning: Expecting numeric in D20656 / R20656C4: got 'n.a.'
## Warning: Expecting numeric in D20657 / R20657C4: got 'n.a.'
## Warning: Expecting numeric in D20658 / R20658C4: got 'n.a.'
## Warning: Expecting numeric in D20659 / R20659C4: got 'n.a.'
## Warning: Expecting numeric in D20660 / R20660C4: got 'n.a.'
## Warning: Expecting numeric in D20661 / R20661C4: got 'n.a.'
## Warning: Expecting numeric in D20662 / R20662C4: got 'n.a.'
## Warning: Expecting numeric in D20663 / R20663C4: got 'n.a.'
## Warning: Expecting numeric in D20664 / R20664C4: got 'n.a.'
## Warning: Expecting numeric in D20665 / R20665C4: got 'n.a.'
## Warning: Expecting numeric in D20666 / R20666C4: got 'n.a.'
## Warning: Expecting numeric in D20667 / R20667C4: got 'n.a.'
## Warning: Expecting numeric in D20668 / R20668C4: got 'n.a.'
## Warning: Expecting numeric in D20669 / R20669C4: got 'n.a.'
## Warning: Expecting numeric in D20670 / R20670C4: got 'n.a.'
## Warning: Expecting numeric in D20671 / R20671C4: got 'n.a.'
## Warning: Expecting numeric in D20672 / R20672C4: got 'n.a.'
## Warning: Expecting numeric in D20673 / R20673C4: got 'n.a.'
## Warning: Expecting numeric in D20674 / R20674C4: got 'n.a.'
## Warning: Expecting numeric in D20675 / R20675C4: got 'n.a.'
## Warning: Expecting numeric in D20676 / R20676C4: got 'n.a.'
## Warning: Expecting numeric in D20677 / R20677C4: got 'n.a.'
## Warning: Expecting numeric in D20678 / R20678C4: got 'n.a.'
## Warning: Expecting numeric in D20679 / R20679C4: got 'n.a.'
## Warning: Expecting numeric in D20680 / R20680C4: got 'n.a.'
## Warning: Expecting numeric in D20681 / R20681C4: got 'n.a.'
## Warning: Expecting numeric in D20682 / R20682C4: got 'n.a.'
## Warning: Expecting numeric in D20683 / R20683C4: got 'n.a.'
## Warning: Expecting numeric in D20684 / R20684C4: got 'n.a.'
## Warning: Expecting numeric in D20685 / R20685C4: got 'n.a.'
## Warning: Expecting numeric in D20686 / R20686C4: got 'n.a.'
## Warning: Expecting numeric in D20687 / R20687C4: got 'n.a.'
## Warning: Expecting numeric in D20688 / R20688C4: got 'n.a.'
## Warning: Expecting numeric in D20689 / R20689C4: got 'n.a.'
## Warning: Expecting numeric in D20690 / R20690C4: got 'n.a.'
## Warning: Expecting numeric in D20691 / R20691C4: got 'n.a.'
## Warning: Expecting numeric in D20692 / R20692C4: got 'n.a.'
## Warning: Expecting numeric in D20693 / R20693C4: got 'n.a.'
## Warning: Expecting numeric in D20694 / R20694C4: got 'n.a.'
## Warning: Expecting numeric in D20695 / R20695C4: got 'n.a.'
## Warning: Expecting numeric in D20696 / R20696C4: got 'n.a.'
## Warning: Expecting numeric in D20697 / R20697C4: got 'n.a.'
## Warning: Expecting numeric in D20698 / R20698C4: got 'n.a.'
## Warning: Expecting numeric in D20699 / R20699C4: got 'n.a.'
## Warning: Expecting numeric in D20700 / R20700C4: got 'n.a.'
## Warning: Expecting numeric in D20701 / R20701C4: got 'n.a.'
## Warning: Expecting numeric in D20702 / R20702C4: got 'n.a.'
## Warning: Expecting numeric in D20703 / R20703C4: got 'n.a.'
## Warning: Expecting numeric in D20704 / R20704C4: got 'n.a.'
## Warning: Expecting numeric in D20705 / R20705C4: got 'n.a.'
## Warning: Expecting numeric in D20706 / R20706C4: got 'n.a.'
## Warning: Expecting numeric in D20707 / R20707C4: got 'n.a.'
## Warning: Expecting numeric in D20708 / R20708C4: got 'n.a.'
## Warning: Expecting numeric in D20709 / R20709C4: got 'n.a.'
## Warning: Expecting numeric in D20710 / R20710C4: got 'n.a.'
## Warning: Expecting numeric in D20711 / R20711C4: got 'n.a.'
## Warning: Expecting numeric in D20712 / R20712C4: got 'n.a.'
## Warning: Expecting numeric in D20713 / R20713C4: got 'n.a.'
## Warning: Expecting numeric in D20714 / R20714C4: got 'n.a.'
## Warning: Expecting numeric in D20715 / R20715C4: got 'n.a.'
## Warning: Expecting numeric in D20716 / R20716C4: got 'n.a.'
## Warning: Expecting numeric in D20717 / R20717C4: got 'n.a.'
## Warning: Expecting numeric in D20718 / R20718C4: got 'n.a.'
## Warning: Expecting numeric in D20719 / R20719C4: got 'n.a.'
## Warning: Expecting numeric in D20720 / R20720C4: got 'n.a.'
## Warning: Expecting numeric in D20721 / R20721C4: got 'n.a.'
## Warning: Expecting numeric in D20722 / R20722C4: got 'n.a.'
## Warning: Expecting numeric in D20723 / R20723C4: got 'n.a.'
## Warning: Expecting numeric in D20724 / R20724C4: got 'n.a.'
## Warning: Expecting numeric in D20725 / R20725C4: got 'n.a.'
## Warning: Expecting numeric in D20726 / R20726C4: got 'n.a.'
## Warning: Expecting numeric in D20727 / R20727C4: got 'n.a.'
## Warning: Expecting numeric in D20728 / R20728C4: got 'n.a.'
## Warning: Expecting numeric in D20729 / R20729C4: got 'n.a.'
## Warning: Expecting numeric in D20730 / R20730C4: got 'n.a.'
## Warning: Expecting numeric in D20731 / R20731C4: got 'n.a.'
## Warning: Expecting numeric in D20732 / R20732C4: got 'n.a.'
## Warning: Expecting numeric in D20733 / R20733C4: got 'n.a.'
## Warning: Expecting numeric in D20734 / R20734C4: got 'n.a.'
## Warning: Expecting numeric in D20735 / R20735C4: got 'n.a.'
## Warning: Expecting numeric in D20736 / R20736C4: got 'n.a.'
## Warning: Expecting numeric in D20737 / R20737C4: got 'n.a.'
## Warning: Expecting numeric in D20738 / R20738C4: got 'n.a.'
## Warning: Expecting numeric in D20739 / R20739C4: got 'n.a.'
## Warning: Expecting numeric in D20740 / R20740C4: got 'n.a.'
## Warning: Expecting numeric in D20741 / R20741C4: got 'n.a.'
## Warning: Expecting numeric in D20742 / R20742C4: got 'n.a.'
## Warning: Expecting numeric in D20743 / R20743C4: got 'n.a.'
## Warning: Expecting numeric in D20744 / R20744C4: got 'n.a.'
## Warning: Expecting numeric in D20745 / R20745C4: got 'n.a.'
## Warning: Expecting numeric in D20746 / R20746C4: got 'n.a.'
## Warning: Expecting numeric in D20747 / R20747C4: got 'n.a.'
## Warning: Expecting numeric in D20748 / R20748C4: got 'n.a.'
## Warning: Expecting numeric in D20749 / R20749C4: got 'n.a.'
## Warning: Expecting numeric in D20750 / R20750C4: got 'n.a.'
## Warning: Expecting numeric in D20751 / R20751C4: got 'n.a.'
## Warning: Expecting numeric in D20752 / R20752C4: got 'n.a.'
## Warning: Expecting numeric in D20753 / R20753C4: got 'n.a.'
## Warning: Expecting numeric in D20754 / R20754C4: got 'n.a.'
## Warning: Expecting numeric in D20755 / R20755C4: got 'n.a.'
## Warning: Expecting numeric in D20756 / R20756C4: got 'n.a.'
## Warning: Expecting numeric in D20757 / R20757C4: got 'n.a.'
## Warning: Expecting numeric in D20758 / R20758C4: got 'n.a.'
## Warning: Expecting numeric in D20759 / R20759C4: got 'n.a.'
## Warning: Expecting numeric in D20760 / R20760C4: got 'n.a.'
## Warning: Expecting numeric in D20761 / R20761C4: got 'n.a.'
## Warning: Expecting numeric in D20762 / R20762C4: got 'n.a.'
## Warning: Expecting numeric in D20763 / R20763C4: got 'n.a.'
## Warning: Expecting numeric in D20764 / R20764C4: got 'n.a.'
## Warning: Expecting numeric in D20765 / R20765C4: got 'n.a.'
## Warning: Expecting numeric in D20766 / R20766C4: got 'n.a.'
## Warning: Expecting numeric in D20767 / R20767C4: got 'n.a.'
## Warning: Expecting numeric in D20768 / R20768C4: got 'n.a.'
## Warning: Expecting numeric in D20769 / R20769C4: got 'n.a.'
## Warning: Expecting numeric in D20770 / R20770C4: got 'n.a.'
## Warning: Expecting numeric in D20771 / R20771C4: got 'n.a.'
## Warning: Expecting numeric in D20772 / R20772C4: got 'n.a.'
## Warning: Expecting numeric in D20773 / R20773C4: got 'n.a.'
## Warning: Expecting numeric in D20774 / R20774C4: got 'n.a.'
## Warning: Expecting numeric in D20775 / R20775C4: got 'n.a.'
## Warning: Expecting numeric in D20776 / R20776C4: got 'n.a.'
## Warning: Expecting numeric in D20777 / R20777C4: got 'n.a.'
## Warning: Expecting numeric in D20778 / R20778C4: got 'n.a.'
## Warning: Expecting numeric in D20779 / R20779C4: got 'n.a.'
## Warning: Expecting numeric in D20780 / R20780C4: got 'n.a.'
## Warning: Expecting numeric in D20781 / R20781C4: got 'n.a.'
## Warning: Expecting numeric in D20782 / R20782C4: got 'n.a.'
## Warning: Expecting numeric in D20783 / R20783C4: got 'n.a.'
## Warning: Expecting numeric in D20784 / R20784C4: got 'n.a.'
## Warning: Expecting numeric in D20785 / R20785C4: got 'n.a.'
## Warning: Expecting numeric in D20786 / R20786C4: got 'n.a.'
## Warning: Expecting numeric in D20787 / R20787C4: got 'n.a.'
## Warning: Expecting numeric in D20788 / R20788C4: got 'n.a.'
## Warning: Expecting numeric in D20789 / R20789C4: got 'n.a.'
## Warning: Expecting numeric in D20790 / R20790C4: got 'n.a.'
## Warning: Expecting numeric in D20791 / R20791C4: got 'n.a.'
## Warning: Expecting numeric in D20792 / R20792C4: got 'n.a.'
## Warning: Expecting numeric in D20793 / R20793C4: got 'n.a.'
## Warning: Expecting numeric in D20794 / R20794C4: got 'n.a.'
## Warning: Expecting numeric in D20795 / R20795C4: got 'n.a.'
## Warning: Expecting numeric in D20796 / R20796C4: got 'n.a.'
## Warning: Expecting numeric in D20797 / R20797C4: got 'n.a.'
## Warning: Expecting numeric in D20798 / R20798C4: got 'n.a.'
## Warning: Expecting numeric in D20799 / R20799C4: got 'n.a.'
## Warning: Expecting numeric in D20800 / R20800C4: got 'n.a.'
## Warning: Expecting numeric in D20801 / R20801C4: got 'n.a.'
## Warning: Expecting numeric in D20802 / R20802C4: got 'n.a.'
## Warning: Expecting numeric in D20803 / R20803C4: got 'n.a.'
## Warning: Expecting numeric in D20804 / R20804C4: got 'n.a.'
## Warning: Expecting numeric in D20805 / R20805C4: got 'n.a.'
## Warning: Expecting numeric in D20806 / R20806C4: got 'n.a.'
## Warning: Expecting numeric in D20807 / R20807C4: got 'n.a.'
## Warning: Expecting numeric in D20808 / R20808C4: got 'n.a.'
## Warning: Expecting numeric in D20809 / R20809C4: got 'n.a.'
## Warning: Expecting numeric in D20810 / R20810C4: got 'n.a.'
## Warning: Expecting numeric in D20811 / R20811C4: got 'n.a.'
## Warning: Expecting numeric in D20812 / R20812C4: got 'n.a.'
## Warning: Expecting numeric in D20813 / R20813C4: got 'n.a.'
## Warning: Expecting numeric in D20814 / R20814C4: got 'n.a.'
## Warning: Expecting numeric in D20815 / R20815C4: got 'n.a.'
## Warning: Expecting numeric in D20816 / R20816C4: got 'n.a.'
## Warning: Expecting numeric in D20817 / R20817C4: got 'n.a.'
## Warning: Expecting numeric in D20818 / R20818C4: got 'n.a.'
## Warning: Expecting numeric in D20819 / R20819C4: got 'n.a.'
## Warning: Expecting numeric in D20820 / R20820C4: got 'n.a.'
## Warning: Expecting numeric in D20821 / R20821C4: got 'n.a.'
## Warning: Expecting numeric in D20822 / R20822C4: got 'n.a.'
## Warning: Expecting numeric in D20823 / R20823C4: got 'n.a.'
## Warning: Expecting numeric in D20824 / R20824C4: got 'n.a.'
## Warning: Expecting numeric in D20825 / R20825C4: got 'n.a.'
## Warning: Expecting numeric in D20826 / R20826C4: got 'n.a.'
## Warning: Expecting numeric in D20827 / R20827C4: got 'n.a.'
## Warning: Expecting numeric in D20828 / R20828C4: got 'n.a.'
## Warning: Expecting numeric in D20829 / R20829C4: got 'n.a.'
## Warning: Expecting numeric in D20830 / R20830C4: got 'n.a.'
## Warning: Expecting numeric in D20831 / R20831C4: got 'n.a.'
## Warning: Expecting numeric in D20832 / R20832C4: got 'n.a.'
## Warning: Expecting numeric in D20833 / R20833C4: got 'n.a.'
## Warning: Expecting numeric in D20834 / R20834C4: got 'n.a.'
## Warning: Expecting numeric in D20835 / R20835C4: got 'n.a.'
## Warning: Expecting numeric in D20836 / R20836C4: got 'n.a.'
## Warning: Expecting numeric in D20837 / R20837C4: got 'n.a.'
## Warning: Expecting numeric in D20838 / R20838C4: got 'n.a.'
## Warning: Expecting numeric in D20839 / R20839C4: got 'n.a.'
## Warning: Expecting numeric in D20840 / R20840C4: got 'n.a.'
## Warning: Expecting numeric in D20841 / R20841C4: got 'n.a.'
## Warning: Expecting numeric in D20842 / R20842C4: got 'n.a.'
## Warning: Expecting numeric in D20843 / R20843C4: got 'n.a.'
## Warning: Expecting numeric in D20844 / R20844C4: got 'n.a.'
## Warning: Expecting numeric in D20845 / R20845C4: got 'n.a.'
## Warning: Expecting numeric in D20846 / R20846C4: got 'n.a.'
## Warning: Expecting numeric in D20847 / R20847C4: got 'n.a.'
## Warning: Expecting numeric in D20848 / R20848C4: got 'n.a.'
## Warning: Expecting numeric in D20849 / R20849C4: got 'n.a.'
## Warning: Expecting numeric in D20850 / R20850C4: got 'n.a.'
## Warning: Expecting numeric in D20851 / R20851C4: got 'n.a.'
## Warning: Expecting numeric in D20852 / R20852C4: got 'n.a.'
## Warning: Expecting numeric in D20853 / R20853C4: got 'n.a.'
## Warning: Expecting numeric in D20854 / R20854C4: got 'n.a.'
## Warning: Expecting numeric in D20855 / R20855C4: got 'n.a.'
## Warning: Expecting numeric in D20856 / R20856C4: got 'n.a.'
## Warning: Expecting numeric in D20857 / R20857C4: got 'n.a.'
## Warning: Expecting numeric in D20858 / R20858C4: got 'n.a.'
## Warning: Expecting numeric in D20859 / R20859C4: got 'n.a.'
## Warning: Expecting numeric in D20860 / R20860C4: got 'n.a.'
## Warning: Expecting numeric in D20861 / R20861C4: got 'n.a.'
## Warning: Expecting numeric in D20862 / R20862C4: got 'n.a.'
## Warning: Expecting numeric in D20863 / R20863C4: got 'n.a.'
## Warning: Expecting numeric in D20864 / R20864C4: got 'n.a.'
## Warning: Expecting numeric in D20865 / R20865C4: got 'n.a.'
## Warning: Expecting numeric in D20866 / R20866C4: got 'n.a.'
## Warning: Expecting numeric in D20867 / R20867C4: got 'n.a.'
## Warning: Expecting numeric in D20868 / R20868C4: got 'n.a.'
## Warning: Expecting numeric in D20869 / R20869C4: got 'n.a.'
## Warning: Expecting numeric in D20870 / R20870C4: got 'n.a.'
## Warning: Expecting numeric in D20871 / R20871C4: got 'n.a.'
## Warning: Expecting numeric in D20872 / R20872C4: got 'n.a.'
## Warning: Expecting numeric in D20873 / R20873C4: got 'n.a.'
## Warning: Expecting numeric in D20874 / R20874C4: got 'n.a.'
## Warning: Expecting numeric in D20875 / R20875C4: got 'n.a.'
## Warning: Expecting numeric in D20876 / R20876C4: got 'n.a.'
## Warning: Expecting numeric in D20877 / R20877C4: got 'n.a.'
## Warning: Expecting numeric in D20878 / R20878C4: got 'n.a.'
## Warning: Expecting numeric in D20879 / R20879C4: got 'n.a.'
## Warning: Expecting numeric in D20880 / R20880C4: got 'n.a.'
## Warning: Expecting numeric in D20881 / R20881C4: got 'n.a.'
## Warning: Expecting numeric in D20882 / R20882C4: got 'n.a.'
## Warning: Expecting numeric in D20883 / R20883C4: got 'n.a.'
## Warning: Expecting numeric in D20884 / R20884C4: got 'n.a.'
## Warning: Expecting numeric in D20885 / R20885C4: got 'n.a.'
## Warning: Expecting numeric in D20886 / R20886C4: got 'n.a.'
## Warning: Expecting numeric in D20887 / R20887C4: got 'n.a.'
## Warning: Expecting numeric in D20888 / R20888C4: got 'n.a.'
## Warning: Expecting numeric in D20889 / R20889C4: got 'n.a.'
## Warning: Expecting numeric in D20890 / R20890C4: got 'n.a.'
## Warning: Expecting numeric in D20891 / R20891C4: got 'n.a.'
## Warning: Expecting numeric in D20892 / R20892C4: got 'n.a.'
## Warning: Expecting numeric in D20893 / R20893C4: got 'n.a.'
## Warning: Expecting numeric in D20894 / R20894C4: got 'n.a.'
## Warning: Expecting numeric in D20895 / R20895C4: got 'n.a.'
## Warning: Expecting numeric in D20896 / R20896C4: got 'n.a.'
## Warning: Expecting numeric in D20897 / R20897C4: got 'n.a.'
## Warning: Expecting numeric in D20898 / R20898C4: got 'n.a.'
## Warning: Expecting numeric in D20899 / R20899C4: got 'n.a.'
## Warning: Expecting numeric in D20900 / R20900C4: got 'n.a.'
## Warning: Expecting numeric in D20901 / R20901C4: got 'n.a.'
## Warning: Expecting numeric in D20902 / R20902C4: got 'n.a.'
## Warning: Expecting numeric in D20903 / R20903C4: got 'n.a.'
## Warning: Expecting numeric in D20904 / R20904C4: got 'n.a.'
## Warning: Expecting numeric in D20905 / R20905C4: got 'n.a.'
## Warning: Expecting numeric in D20906 / R20906C4: got 'n.a.'
## Warning: Expecting numeric in D20907 / R20907C4: got 'n.a.'
## Warning: Expecting numeric in D20908 / R20908C4: got 'n.a.'
## Warning: Expecting numeric in D20909 / R20909C4: got 'n.a.'
## Warning: Expecting numeric in D20910 / R20910C4: got 'n.a.'
## Warning: Expecting numeric in D20911 / R20911C4: got 'n.a.'
## Warning: Expecting numeric in D20912 / R20912C4: got 'n.a.'
## Warning: Expecting numeric in D20913 / R20913C4: got 'n.a.'
## Warning: Expecting numeric in D20914 / R20914C4: got 'n.a.'
## Warning: Expecting numeric in D20915 / R20915C4: got 'n.a.'
## Warning: Expecting numeric in D20916 / R20916C4: got 'n.a.'
## Warning: Expecting numeric in D20917 / R20917C4: got 'n.a.'
## Warning: Expecting numeric in D20918 / R20918C4: got 'n.a.'
## Warning: Expecting numeric in D20919 / R20919C4: got 'n.a.'
## Warning: Expecting numeric in D20920 / R20920C4: got 'n.a.'
## Warning: Expecting numeric in D20921 / R20921C4: got 'n.a.'
## Warning: Expecting numeric in D20922 / R20922C4: got 'n.a.'
## Warning: Expecting numeric in D20923 / R20923C4: got 'n.a.'
## Warning: Expecting numeric in D20924 / R20924C4: got 'n.a.'
## Warning: Expecting numeric in D20925 / R20925C4: got 'n.a.'
## Warning: Expecting numeric in D20926 / R20926C4: got 'n.a.'
## Warning: Expecting numeric in D20927 / R20927C4: got 'n.a.'
## Warning: Expecting numeric in D20928 / R20928C4: got 'n.a.'
## Warning: Expecting numeric in D20929 / R20929C4: got 'n.a.'
## Warning: Expecting numeric in D20930 / R20930C4: got 'n.a.'
## Warning: Expecting numeric in D20931 / R20931C4: got 'n.a.'
## Warning: Expecting numeric in D20932 / R20932C4: got 'n.a.'
## Warning: Expecting numeric in D20933 / R20933C4: got 'n.a.'
## Warning: Expecting numeric in D20934 / R20934C4: got 'n.a.'
## Warning: Expecting numeric in D20935 / R20935C4: got 'n.a.'
## Warning: Expecting numeric in D20936 / R20936C4: got 'n.a.'
## Warning: Expecting numeric in D20937 / R20937C4: got 'n.a.'
## Warning: Expecting numeric in D20938 / R20938C4: got 'n.a.'
## Warning: Expecting numeric in D20939 / R20939C4: got 'n.a.'
## Warning: Expecting numeric in D20940 / R20940C4: got 'n.a.'
## Warning: Expecting numeric in D20941 / R20941C4: got 'n.a.'
## Warning: Expecting numeric in D20942 / R20942C4: got 'n.a.'
## Warning: Expecting numeric in D20943 / R20943C4: got 'n.a.'
## Warning: Expecting numeric in D20944 / R20944C4: got 'n.a.'
## Warning: Expecting numeric in D20945 / R20945C4: got 'n.a.'
## Warning: Expecting numeric in D20946 / R20946C4: got 'n.a.'
## Warning: Expecting numeric in D20947 / R20947C4: got 'n.a.'
## Warning: Expecting numeric in D20948 / R20948C4: got 'n.a.'
## Warning: Expecting numeric in D20949 / R20949C4: got 'n.a.'
## Warning: Expecting numeric in D20950 / R20950C4: got 'n.a.'
## Warning: Expecting numeric in D20951 / R20951C4: got 'n.a.'
## Warning: Expecting numeric in D20952 / R20952C4: got 'n.a.'
## Warning: Expecting numeric in D20953 / R20953C4: got 'n.a.'
## Warning: Expecting numeric in D20954 / R20954C4: got 'n.a.'
## Warning: Expecting numeric in D20955 / R20955C4: got 'n.a.'
## Warning: Expecting numeric in D20956 / R20956C4: got 'n.a.'
## Warning: Expecting numeric in D20957 / R20957C4: got 'n.a.'
## Warning: Expecting numeric in D20958 / R20958C4: got 'n.a.'
## Warning: Expecting numeric in D20959 / R20959C4: got 'n.a.'
## Warning: Expecting numeric in D20960 / R20960C4: got 'n.a.'
## Warning: Expecting numeric in D20961 / R20961C4: got 'n.a.'
## Warning: Expecting numeric in D20962 / R20962C4: got 'n.a.'
## Warning: Expecting numeric in D20963 / R20963C4: got 'n.a.'
## Warning: Expecting numeric in D20964 / R20964C4: got 'n.a.'
## Warning: Expecting numeric in D20965 / R20965C4: got 'n.a.'
## Warning: Expecting numeric in D20966 / R20966C4: got 'n.a.'
## Warning: Expecting numeric in D20967 / R20967C4: got 'n.a.'
## Warning: Expecting numeric in D20968 / R20968C4: got 'n.a.'
## Warning: Expecting numeric in D20969 / R20969C4: got 'n.a.'
## Warning: Expecting numeric in D20970 / R20970C4: got 'n.a.'
## Warning: Expecting numeric in D20971 / R20971C4: got 'n.a.'
## Warning: Expecting numeric in D20972 / R20972C4: got 'n.a.'
## Warning: Expecting numeric in D20973 / R20973C4: got 'n.a.'
## Warning: Expecting numeric in D20974 / R20974C4: got 'n.a.'
## Warning: Expecting numeric in D20975 / R20975C4: got 'n.a.'
## Warning: Expecting numeric in D20976 / R20976C4: got 'n.a.'
## Warning: Expecting numeric in D20977 / R20977C4: got 'n.a.'
## Warning: Expecting numeric in D20978 / R20978C4: got 'n.a.'
## Warning: Expecting numeric in D20979 / R20979C4: got 'n.a.'
## Warning: Expecting numeric in D20980 / R20980C4: got 'n.a.'
## Warning: Expecting numeric in D20981 / R20981C4: got 'n.a.'
## Warning: Expecting numeric in D20982 / R20982C4: got 'n.a.'
## Warning: Expecting numeric in D20983 / R20983C4: got 'n.a.'
## Warning: Expecting numeric in D20984 / R20984C4: got 'n.a.'
## Warning: Expecting numeric in D20985 / R20985C4: got 'n.a.'
## Warning: Expecting numeric in D20986 / R20986C4: got 'n.a.'
## Warning: Expecting numeric in D20987 / R20987C4: got 'n.a.'
## Warning: Expecting numeric in D20988 / R20988C4: got 'n.a.'
## Warning: Expecting numeric in D20989 / R20989C4: got 'n.a.'
## Warning: Expecting numeric in D20990 / R20990C4: got 'n.a.'
## Warning: Expecting numeric in D20991 / R20991C4: got 'n.a.'
## Warning: Expecting numeric in D20992 / R20992C4: got 'n.a.'
## Warning: Expecting numeric in D20993 / R20993C4: got 'n.a.'
## Warning: Expecting numeric in D20994 / R20994C4: got 'n.a.'
## Warning: Expecting numeric in D20995 / R20995C4: got 'n.a.'
## Warning: Expecting numeric in D20996 / R20996C4: got 'n.a.'
## Warning: Expecting numeric in D20997 / R20997C4: got 'n.a.'
## Warning: Expecting numeric in D20998 / R20998C4: got 'n.a.'
## Warning: Expecting numeric in D20999 / R20999C4: got 'n.a.'
## Warning: Expecting numeric in D21000 / R21000C4: got 'n.a.'
## Warning: Expecting numeric in D21001 / R21001C4: got 'n.a.'
## Warning: Expecting numeric in D21002 / R21002C4: got 'n.a.'
## Warning: Expecting numeric in D21003 / R21003C4: got 'n.a.'
## Warning: Expecting numeric in D21004 / R21004C4: got 'n.a.'
## Warning: Expecting numeric in D21005 / R21005C4: got 'n.a.'
## Warning: Expecting numeric in D21006 / R21006C4: got 'n.a.'
## Warning: Expecting numeric in D21007 / R21007C4: got 'n.a.'
## Warning: Expecting numeric in D21008 / R21008C4: got 'n.a.'
## Warning: Expecting numeric in D21009 / R21009C4: got 'n.a.'
## Warning: Expecting numeric in D21010 / R21010C4: got 'n.a.'
## Warning: Expecting numeric in D21011 / R21011C4: got 'n.a.'
## Warning: Expecting numeric in D21012 / R21012C4: got 'n.a.'
## Warning: Expecting numeric in D21013 / R21013C4: got 'n.a.'
## Warning: Expecting numeric in D21014 / R21014C4: got 'n.a.'
## Warning: Expecting numeric in D21015 / R21015C4: got 'n.a.'
## Warning: Expecting numeric in D21016 / R21016C4: got 'n.a.'
## Warning: Expecting numeric in D21017 / R21017C4: got 'n.a.'
## Warning: Expecting numeric in D21018 / R21018C4: got 'n.a.'
## Warning: Expecting numeric in D21019 / R21019C4: got 'n.a.'
## Warning: Expecting numeric in D21020 / R21020C4: got 'n.a.'
## Warning: Expecting numeric in D21021 / R21021C4: got 'n.a.'
## Warning: Expecting numeric in D21022 / R21022C4: got 'n.a.'
## Warning: Expecting numeric in D21023 / R21023C4: got 'n.a.'
## Warning: Expecting numeric in D21024 / R21024C4: got 'n.a.'
## Warning: Expecting numeric in D21025 / R21025C4: got 'n.a.'
## Warning: Expecting numeric in D21026 / R21026C4: got 'n.a.'
## Warning: Expecting numeric in D21027 / R21027C4: got 'n.a.'
## Warning: Expecting numeric in D21028 / R21028C4: got 'n.a.'
## Warning: Expecting numeric in D21029 / R21029C4: got 'n.a.'
## Warning: Expecting numeric in D21030 / R21030C4: got 'n.a.'
## Warning: Expecting numeric in D21031 / R21031C4: got 'n.a.'
## Warning: Expecting numeric in D21032 / R21032C4: got 'n.a.'
## Warning: Expecting numeric in D21033 / R21033C4: got 'n.a.'
## Warning: Expecting numeric in D21034 / R21034C4: got 'n.a.'
## Warning: Expecting numeric in D21035 / R21035C4: got 'n.a.'
## Warning: Expecting numeric in D21036 / R21036C4: got 'n.a.'
## Warning: Expecting numeric in D21037 / R21037C4: got 'n.a.'
## Warning: Expecting numeric in D21038 / R21038C4: got 'n.a.'
## Warning: Expecting numeric in D21039 / R21039C4: got 'n.a.'
## Warning: Expecting numeric in D21040 / R21040C4: got 'n.a.'
## Warning: Expecting numeric in D21041 / R21041C4: got 'n.a.'
## Warning: Expecting numeric in D21042 / R21042C4: got 'n.a.'
## Warning: Expecting numeric in D21043 / R21043C4: got 'n.a.'
## Warning: Expecting numeric in D21044 / R21044C4: got 'n.a.'
## Warning: Expecting numeric in D21045 / R21045C4: got 'n.a.'
## Warning: Expecting numeric in D21046 / R21046C4: got 'n.a.'
## Warning: Expecting numeric in D21047 / R21047C4: got 'n.a.'
## Warning: Expecting numeric in D21048 / R21048C4: got 'n.a.'
## Warning: Expecting numeric in D21049 / R21049C4: got 'n.a.'
## Warning: Expecting numeric in D21050 / R21050C4: got 'n.a.'
## Warning: Expecting numeric in D21051 / R21051C4: got 'n.a.'
## Warning: Expecting numeric in D21052 / R21052C4: got 'n.a.'
## Warning: Expecting numeric in D21053 / R21053C4: got 'n.a.'
## Warning: Expecting numeric in D21054 / R21054C4: got 'n.a.'
## Warning: Expecting numeric in D21055 / R21055C4: got 'n.a.'
## Warning: Expecting numeric in D21056 / R21056C4: got 'n.a.'
## Warning: Expecting numeric in D21057 / R21057C4: got 'n.a.'
## Warning: Expecting numeric in D21058 / R21058C4: got 'n.a.'
## Warning: Expecting numeric in D21059 / R21059C4: got 'n.a.'
## Warning: Expecting numeric in D21060 / R21060C4: got 'n.a.'
## Warning: Expecting numeric in D21061 / R21061C4: got 'n.a.'
## Warning: Expecting numeric in D21062 / R21062C4: got 'n.a.'
## Warning: Expecting numeric in D21063 / R21063C4: got 'n.a.'
## Warning: Expecting numeric in D21064 / R21064C4: got 'n.a.'
## Warning: Expecting numeric in D21065 / R21065C4: got 'n.a.'
## Warning: Expecting numeric in D21066 / R21066C4: got 'n.a.'
## Warning: Expecting numeric in D21067 / R21067C4: got 'n.a.'
## Warning: Expecting numeric in D21068 / R21068C4: got 'n.a.'
## Warning: Expecting numeric in D21069 / R21069C4: got 'n.a.'
## Warning: Expecting numeric in D21070 / R21070C4: got 'n.a.'
## Warning: Expecting numeric in D21071 / R21071C4: got 'n.a.'
## Warning: Expecting numeric in D21072 / R21072C4: got 'n.a.'
## Warning: Expecting numeric in D21073 / R21073C4: got 'n.a.'
## Warning: Expecting numeric in D21074 / R21074C4: got 'n.a.'
## Warning: Expecting numeric in D21075 / R21075C4: got 'n.a.'
## Warning: Expecting numeric in D21076 / R21076C4: got 'n.a.'
## Warning: Expecting numeric in D21077 / R21077C4: got 'n.a.'
## Warning: Expecting numeric in D21078 / R21078C4: got 'n.a.'
## Warning: Expecting numeric in D21079 / R21079C4: got 'n.a.'
## Warning: Expecting numeric in D21080 / R21080C4: got 'n.a.'
## Warning: Expecting numeric in D21081 / R21081C4: got 'n.a.'
## Warning: Expecting numeric in D21082 / R21082C4: got 'n.a.'
## Warning: Expecting numeric in D21083 / R21083C4: got 'n.a.'
## Warning: Expecting numeric in D21084 / R21084C4: got 'n.a.'
## Warning: Expecting numeric in D21085 / R21085C4: got 'n.a.'
## Warning: Expecting numeric in D21086 / R21086C4: got 'n.a.'
## Warning: Expecting numeric in D21087 / R21087C4: got 'n.a.'
## Warning: Expecting numeric in D21088 / R21088C4: got 'n.a.'
## Warning: Expecting numeric in D21089 / R21089C4: got 'n.a.'
## Warning: Expecting numeric in D21090 / R21090C4: got 'n.a.'
## Warning: Expecting numeric in D21091 / R21091C4: got 'n.a.'
## Warning: Expecting numeric in D21092 / R21092C4: got 'n.a.'
## Warning: Expecting numeric in D21093 / R21093C4: got 'n.a.'
## Warning: Expecting numeric in D21094 / R21094C4: got 'n.a.'
## Warning: Expecting numeric in D21095 / R21095C4: got 'n.a.'
## Warning: Expecting numeric in D21096 / R21096C4: got 'n.a.'
## Warning: Expecting numeric in D21097 / R21097C4: got 'n.a.'
## Warning: Expecting numeric in D21098 / R21098C4: got 'n.a.'
## Warning: Expecting numeric in D21099 / R21099C4: got 'n.a.'
## Warning: Expecting numeric in D21100 / R21100C4: got 'n.a.'
## Warning: Expecting numeric in D21101 / R21101C4: got 'n.a.'
## Warning: Expecting numeric in D21102 / R21102C4: got 'n.a.'
## Warning: Expecting numeric in D21103 / R21103C4: got 'n.a.'
## Warning: Expecting numeric in D21104 / R21104C4: got 'n.a.'
## Warning: Expecting numeric in D21105 / R21105C4: got 'n.a.'
## Warning: Expecting numeric in D21106 / R21106C4: got 'n.a.'
## Warning: Expecting numeric in D21107 / R21107C4: got 'n.a.'
## Warning: Expecting numeric in D21108 / R21108C4: got 'n.a.'
## Warning: Expecting numeric in D21109 / R21109C4: got 'n.a.'
## Warning: Expecting numeric in D21110 / R21110C4: got 'n.a.'
## Warning: Expecting numeric in D21111 / R21111C4: got 'n.a.'
## Warning: Expecting numeric in D21112 / R21112C4: got 'n.a.'
## Warning: Expecting numeric in D21113 / R21113C4: got 'n.a.'
## Warning: Expecting numeric in D21114 / R21114C4: got 'n.a.'
## Warning: Expecting numeric in D21115 / R21115C4: got 'n.a.'
## Warning: Expecting numeric in D21116 / R21116C4: got 'n.a.'
## Warning: Expecting numeric in D21117 / R21117C4: got 'n.a.'
## Warning: Expecting numeric in D21118 / R21118C4: got 'n.a.'
## Warning: Expecting numeric in D21119 / R21119C4: got 'n.a.'
## Warning: Expecting numeric in D21120 / R21120C4: got 'n.a.'
## Warning: Expecting numeric in D21121 / R21121C4: got 'n.a.'
## Warning: Expecting numeric in D21122 / R21122C4: got 'n.a.'
## Warning: Expecting numeric in D21123 / R21123C4: got 'n.a.'
## Warning: Expecting numeric in D21124 / R21124C4: got 'n.a.'
## Warning: Expecting numeric in D21125 / R21125C4: got 'n.a.'
## Warning: Expecting numeric in D21126 / R21126C4: got 'n.a.'
## Warning: Expecting numeric in D21127 / R21127C4: got 'n.a.'
## Warning: Expecting numeric in D21128 / R21128C4: got 'n.a.'
## Warning: Expecting numeric in D21129 / R21129C4: got 'n.a.'
## Warning: Expecting numeric in D21130 / R21130C4: got 'n.a.'
## Warning: Expecting numeric in D21131 / R21131C4: got 'n.a.'
## Warning: Expecting numeric in D21132 / R21132C4: got 'n.a.'
## Warning: Expecting numeric in D21133 / R21133C4: got 'n.a.'
## Warning: Expecting numeric in D21134 / R21134C4: got 'n.a.'
## Warning: Expecting numeric in D21135 / R21135C4: got 'n.a.'
## Warning: Expecting numeric in D21136 / R21136C4: got 'n.a.'
## Warning: Expecting numeric in D21137 / R21137C4: got 'n.a.'
## Warning: Expecting numeric in D21138 / R21138C4: got 'n.a.'
## Warning: Expecting numeric in D21139 / R21139C4: got 'n.a.'
## Warning: Expecting numeric in D21140 / R21140C4: got 'n.a.'
## Warning: Expecting numeric in D21141 / R21141C4: got 'n.a.'
## Warning: Expecting numeric in D21142 / R21142C4: got 'n.a.'
## Warning: Expecting numeric in D21143 / R21143C4: got 'n.a.'
## Warning: Expecting numeric in D21144 / R21144C4: got 'n.a.'
## Warning: Expecting numeric in D21145 / R21145C4: got 'n.a.'
## Warning: Expecting numeric in D21146 / R21146C4: got 'n.a.'
## Warning: Expecting numeric in D21147 / R21147C4: got 'n.a.'
## Warning: Expecting numeric in D21148 / R21148C4: got 'n.a.'
## Warning: Expecting numeric in D21149 / R21149C4: got 'n.a.'
## Warning: Expecting numeric in D21150 / R21150C4: got 'n.a.'
## Warning: Expecting numeric in D21151 / R21151C4: got 'n.a.'
## Warning: Expecting numeric in D21152 / R21152C4: got 'n.a.'
## Warning: Expecting numeric in D21153 / R21153C4: got 'n.a.'
## Warning: Expecting numeric in D21154 / R21154C4: got 'n.a.'
## Warning: Expecting numeric in D21155 / R21155C4: got 'n.a.'
## Warning: Expecting numeric in D21156 / R21156C4: got 'n.a.'
## Warning: Expecting numeric in D21157 / R21157C4: got 'n.a.'
## Warning: Expecting numeric in D21158 / R21158C4: got 'n.a.'
## Warning: Expecting numeric in D21159 / R21159C4: got 'n.a.'
## Warning: Expecting numeric in D21160 / R21160C4: got 'n.a.'
## Warning: Expecting numeric in D21161 / R21161C4: got 'n.a.'
## Warning: Expecting numeric in D21162 / R21162C4: got 'n.a.'
## Warning: Expecting numeric in D21163 / R21163C4: got 'n.a.'
## Warning: Expecting numeric in D21164 / R21164C4: got 'n.a.'
## Warning: Expecting numeric in D21165 / R21165C4: got 'n.a.'
## Warning: Expecting numeric in D21166 / R21166C4: got 'n.a.'
## Warning: Expecting numeric in D21167 / R21167C4: got 'n.a.'
## Warning: Expecting numeric in D21168 / R21168C4: got 'n.a.'
## Warning: Expecting numeric in D21169 / R21169C4: got 'n.a.'
## Warning: Expecting numeric in D21170 / R21170C4: got 'n.a.'
## Warning: Expecting numeric in D21171 / R21171C4: got 'n.a.'
## Warning: Expecting numeric in D21172 / R21172C4: got 'n.a.'
## Warning: Expecting numeric in D21173 / R21173C4: got 'n.a.'
## Warning: Expecting numeric in D21174 / R21174C4: got 'n.a.'
## Warning: Expecting numeric in D21175 / R21175C4: got 'n.a.'
## Warning: Expecting numeric in D21176 / R21176C4: got 'n.a.'
## Warning: Expecting numeric in D21177 / R21177C4: got 'n.a.'
## Warning: Expecting numeric in D21178 / R21178C4: got 'n.a.'
## Warning: Expecting numeric in D21179 / R21179C4: got 'n.a.'
## Warning: Expecting numeric in D21180 / R21180C4: got 'n.a.'
## Warning: Expecting numeric in D21181 / R21181C4: got 'n.a.'
## Warning: Expecting numeric in D21182 / R21182C4: got 'n.a.'
## Warning: Expecting numeric in D21183 / R21183C4: got 'n.a.'
## Warning: Expecting numeric in D21184 / R21184C4: got 'n.a.'
## Warning: Expecting numeric in D21185 / R21185C4: got 'n.a.'
## Warning: Expecting numeric in D21186 / R21186C4: got 'n.a.'
## Warning: Expecting numeric in D21187 / R21187C4: got 'n.a.'
## Warning: Expecting numeric in D21188 / R21188C4: got 'n.a.'
## Warning: Expecting numeric in D21189 / R21189C4: got 'n.a.'
## Warning: Expecting numeric in D21190 / R21190C4: got 'n.a.'
## Warning: Expecting numeric in D21191 / R21191C4: got 'n.a.'
## Warning: Expecting numeric in D21192 / R21192C4: got 'n.a.'
## Warning: Expecting numeric in D21193 / R21193C4: got 'n.a.'
## Warning: Expecting numeric in D21194 / R21194C4: got 'n.a.'
## Warning: Expecting numeric in D21195 / R21195C4: got 'n.a.'
## Warning: Expecting numeric in D21196 / R21196C4: got 'n.a.'
## Warning: Expecting numeric in D21197 / R21197C4: got 'n.a.'
## Warning: Expecting numeric in D21198 / R21198C4: got 'n.a.'
## Warning: Expecting numeric in D21199 / R21199C4: got 'n.a.'
## Warning: Expecting numeric in D21200 / R21200C4: got 'n.a.'
## Warning: Expecting numeric in D21201 / R21201C4: got 'n.a.'
## Warning: Expecting numeric in D21202 / R21202C4: got 'n.a.'
## Warning: Expecting numeric in D21203 / R21203C4: got 'n.a.'
## Warning: Expecting numeric in D21204 / R21204C4: got 'n.a.'
## Warning: Expecting numeric in D21205 / R21205C4: got 'n.a.'
## Warning: Expecting numeric in D21206 / R21206C4: got 'n.a.'
## Warning: Expecting numeric in D21207 / R21207C4: got 'n.a.'
## Warning: Expecting numeric in D21208 / R21208C4: got 'n.a.'
## Warning: Expecting numeric in D21209 / R21209C4: got 'n.a.'
## Warning: Expecting numeric in D21210 / R21210C4: got 'n.a.'
## Warning: Expecting numeric in D21211 / R21211C4: got 'n.a.'
## Warning: Expecting numeric in D21212 / R21212C4: got 'n.a.'
## Warning: Expecting numeric in D21213 / R21213C4: got 'n.a.'
## Warning: Expecting numeric in D21214 / R21214C4: got 'n.a.'
## Warning: Expecting numeric in D21215 / R21215C4: got 'n.a.'
## Warning: Expecting numeric in D21216 / R21216C4: got 'n.a.'
## Warning: Expecting numeric in D21217 / R21217C4: got 'n.a.'
## Warning: Expecting numeric in D21218 / R21218C4: got 'n.a.'
## Warning: Expecting numeric in D21219 / R21219C4: got 'n.a.'
## Warning: Expecting numeric in D21220 / R21220C4: got 'n.a.'
## Warning: Expecting numeric in D21221 / R21221C4: got 'n.a.'
## Warning: Expecting numeric in D21222 / R21222C4: got 'n.a.'
## Warning: Expecting numeric in D21223 / R21223C4: got 'n.a.'
## Warning: Expecting numeric in D21224 / R21224C4: got 'n.a.'
## Warning: Expecting numeric in D21225 / R21225C4: got 'n.a.'
## Warning: Expecting numeric in D21226 / R21226C4: got 'n.a.'
## Warning: Expecting numeric in D21227 / R21227C4: got 'n.a.'
## Warning: Expecting numeric in D21228 / R21228C4: got 'n.a.'
## Warning: Expecting numeric in D21229 / R21229C4: got 'n.a.'
## Warning: Expecting numeric in D21230 / R21230C4: got 'n.a.'
## Warning: Expecting numeric in D21231 / R21231C4: got 'n.a.'
## Warning: Expecting numeric in D21232 / R21232C4: got 'n.a.'
## Warning: Expecting numeric in D21233 / R21233C4: got 'n.a.'
## Warning: Expecting numeric in D21234 / R21234C4: got 'n.a.'
## Warning: Expecting numeric in D21235 / R21235C4: got 'n.a.'
## Warning: Expecting numeric in D21236 / R21236C4: got 'n.a.'
## Warning: Expecting numeric in D21237 / R21237C4: got 'n.a.'
## Warning: Expecting numeric in D21238 / R21238C4: got 'n.a.'
## Warning: Expecting numeric in D21239 / R21239C4: got 'n.a.'
## Warning: Expecting numeric in D21240 / R21240C4: got 'n.a.'
## Warning: Expecting numeric in D21241 / R21241C4: got 'n.a.'
## Warning: Expecting numeric in D21242 / R21242C4: got 'n.a.'
## Warning: Expecting numeric in D21243 / R21243C4: got 'n.a.'
## Warning: Expecting numeric in D21244 / R21244C4: got 'n.a.'
## Warning: Expecting numeric in D21245 / R21245C4: got 'n.a.'
## Warning: Expecting numeric in D21246 / R21246C4: got 'n.a.'
## Warning: Expecting numeric in D21247 / R21247C4: got 'n.a.'
## Warning: Expecting numeric in D21248 / R21248C4: got 'n.a.'
## Warning: Expecting numeric in D21249 / R21249C4: got 'n.a.'
## Warning: Expecting numeric in D21250 / R21250C4: got 'n.a.'
## Warning: Expecting numeric in D21251 / R21251C4: got 'n.a.'
## Warning: Expecting numeric in D21252 / R21252C4: got 'n.a.'
## Warning: Expecting numeric in D21253 / R21253C4: got 'n.a.'
## Warning: Expecting numeric in D21254 / R21254C4: got 'n.a.'
## Warning: Expecting numeric in D21255 / R21255C4: got 'n.a.'
## Warning: Expecting numeric in D21256 / R21256C4: got 'n.a.'
## Warning: Expecting numeric in D21257 / R21257C4: got 'n.a.'
## Warning: Expecting numeric in D21258 / R21258C4: got 'n.a.'
## Warning: Expecting numeric in D21259 / R21259C4: got 'n.a.'
## Warning: Expecting numeric in D21260 / R21260C4: got 'n.a.'
## Warning: Expecting numeric in D21261 / R21261C4: got 'n.a.'
## Warning: Expecting numeric in D21262 / R21262C4: got 'n.a.'
## Warning: Expecting numeric in D21263 / R21263C4: got 'n.a.'
## Warning: Expecting numeric in D21264 / R21264C4: got 'n.a.'
## Warning: Expecting numeric in D21265 / R21265C4: got 'n.a.'
## Warning: Expecting numeric in D21266 / R21266C4: got 'n.a.'
## Warning: Expecting numeric in D21267 / R21267C4: got 'n.a.'
## Warning: Expecting numeric in D21268 / R21268C4: got 'n.a.'
## Warning: Expecting numeric in D21269 / R21269C4: got 'n.a.'
## Warning: Expecting numeric in D21270 / R21270C4: got 'n.a.'
## Warning: Expecting numeric in D21271 / R21271C4: got 'n.a.'
## Warning: Expecting numeric in D21272 / R21272C4: got 'n.a.'
## Warning: Expecting numeric in D21273 / R21273C4: got 'n.a.'
## Warning: Expecting numeric in D21274 / R21274C4: got 'n.a.'
## Warning: Expecting numeric in D21275 / R21275C4: got 'n.a.'
## Warning: Expecting numeric in D21276 / R21276C4: got 'n.a.'
## Warning: Expecting numeric in D21277 / R21277C4: got 'n.a.'
## Warning: Expecting numeric in D21278 / R21278C4: got 'n.a.'
## Warning: Expecting numeric in D21279 / R21279C4: got 'n.a.'
## Warning: Expecting numeric in D21280 / R21280C4: got 'n.a.'
## Warning: Expecting numeric in D21281 / R21281C4: got 'n.a.'
## Warning: Expecting numeric in D21282 / R21282C4: got 'n.a.'
## Warning: Expecting numeric in D21283 / R21283C4: got 'n.a.'
## Warning: Expecting numeric in D21284 / R21284C4: got 'n.a.'
## Warning: Expecting numeric in D21285 / R21285C4: got 'n.a.'
## Warning: Expecting numeric in D21286 / R21286C4: got 'n.a.'
## Warning: Expecting numeric in D21287 / R21287C4: got 'n.a.'
## Warning: Expecting numeric in D21288 / R21288C4: got 'n.a.'
## Warning: Expecting numeric in D21289 / R21289C4: got 'n.a.'
## Warning: Expecting numeric in D21290 / R21290C4: got 'n.a.'
## Warning: Expecting numeric in D21291 / R21291C4: got 'n.a.'
## Warning: Expecting numeric in D21292 / R21292C4: got 'n.a.'
## Warning: Expecting numeric in D21293 / R21293C4: got 'n.a.'
## Warning: Expecting numeric in D21294 / R21294C4: got 'n.a.'
## Warning: Expecting numeric in D21295 / R21295C4: got 'n.a.'
## Warning: Expecting numeric in D21296 / R21296C4: got 'n.a.'
## Warning: Expecting numeric in D21297 / R21297C4: got 'n.a.'
## Warning: Expecting numeric in D21298 / R21298C4: got 'n.a.'
## Warning: Expecting numeric in D21299 / R21299C4: got 'n.a.'
## Warning: Expecting numeric in D21300 / R21300C4: got 'n.a.'
## Warning: Expecting numeric in D21301 / R21301C4: got 'n.a.'
## Warning: Expecting numeric in D21302 / R21302C4: got 'n.a.'
## Warning: Expecting numeric in D21303 / R21303C4: got 'n.a.'
## Warning: Expecting numeric in D21304 / R21304C4: got 'n.a.'
## Warning: Expecting numeric in D21305 / R21305C4: got 'n.a.'
## Warning: Expecting numeric in D21306 / R21306C4: got 'n.a.'
## Warning: Expecting numeric in D21307 / R21307C4: got 'n.a.'
## Warning: Expecting numeric in D21308 / R21308C4: got 'n.a.'
## Warning: Expecting numeric in D21309 / R21309C4: got 'n.a.'
## Warning: Expecting numeric in D21310 / R21310C4: got 'n.a.'
## Warning: Expecting numeric in D21311 / R21311C4: got 'n.a.'
## Warning: Expecting numeric in D21312 / R21312C4: got 'n.a.'
## Warning: Expecting numeric in D21313 / R21313C4: got 'n.a.'
## Warning: Expecting numeric in D21314 / R21314C4: got 'n.a.'
## Warning: Expecting numeric in D21315 / R21315C4: got 'n.a.'
## Warning: Expecting numeric in D21316 / R21316C4: got 'n.a.'
## Warning: Expecting numeric in D21317 / R21317C4: got 'n.a.'
## Warning: Expecting numeric in D21318 / R21318C4: got 'n.a.'
## Warning: Expecting numeric in D21319 / R21319C4: got 'n.a.'
## Warning: Expecting numeric in D21320 / R21320C4: got 'n.a.'
## Warning: Expecting numeric in D21321 / R21321C4: got 'n.a.'
## Warning: Expecting numeric in D21322 / R21322C4: got 'n.a.'
## Warning: Expecting numeric in D21323 / R21323C4: got 'n.a.'
## Warning: Expecting numeric in D21324 / R21324C4: got 'n.a.'
## Warning: Expecting numeric in D21325 / R21325C4: got 'n.a.'
## Warning: Expecting numeric in D21326 / R21326C4: got 'n.a.'
## Warning: Expecting numeric in D21327 / R21327C4: got 'n.a.'
## Warning: Expecting numeric in D21328 / R21328C4: got 'n.a.'
## Warning: Expecting numeric in D21329 / R21329C4: got 'n.a.'
## Warning: Expecting numeric in D21330 / R21330C4: got 'n.a.'
## Warning: Expecting numeric in D21331 / R21331C4: got 'n.a.'
## Warning: Expecting numeric in D21332 / R21332C4: got 'n.a.'
## Warning: Expecting numeric in D21333 / R21333C4: got 'n.a.'
## Warning: Expecting numeric in D21334 / R21334C4: got 'n.a.'
## Warning: Expecting numeric in D21335 / R21335C4: got 'n.a.'
## Warning: Expecting numeric in D21336 / R21336C4: got 'n.a.'
## Warning: Expecting numeric in D21337 / R21337C4: got 'n.a.'
## Warning: Expecting numeric in D21338 / R21338C4: got 'n.a.'
## Warning: Expecting numeric in D21339 / R21339C4: got 'n.a.'
## Warning: Expecting numeric in D21340 / R21340C4: got 'n.a.'
## Warning: Expecting numeric in D21341 / R21341C4: got 'n.a.'
## Warning: Expecting numeric in D21342 / R21342C4: got 'n.a.'
## Warning: Expecting numeric in D21343 / R21343C4: got 'n.a.'
## Warning: Expecting numeric in D21344 / R21344C4: got 'n.a.'
## Warning: Expecting numeric in D21345 / R21345C4: got 'n.a.'
## Warning: Expecting numeric in D21346 / R21346C4: got 'n.a.'
## Warning: Expecting numeric in D21347 / R21347C4: got 'n.a.'
## Warning: Expecting numeric in D21348 / R21348C4: got 'n.a.'
## Warning: Expecting numeric in D21349 / R21349C4: got 'n.a.'
## Warning: Expecting numeric in D21350 / R21350C4: got 'n.a.'
## Warning: Expecting numeric in D21351 / R21351C4: got 'n.a.'
## Warning: Expecting numeric in D21352 / R21352C4: got 'n.a.'
## Warning: Expecting numeric in D21353 / R21353C4: got 'n.a.'
## Warning: Expecting numeric in D21354 / R21354C4: got 'n.a.'
## Warning: Expecting numeric in D21355 / R21355C4: got 'n.a.'
## Warning: Expecting numeric in D21356 / R21356C4: got 'n.a.'
## Warning: Expecting numeric in D21357 / R21357C4: got 'n.a.'
## Warning: Expecting numeric in D21358 / R21358C4: got 'n.a.'
## Warning: Expecting numeric in D21359 / R21359C4: got 'n.a.'
## Warning: Expecting numeric in D21360 / R21360C4: got 'n.a.'
## Warning: Expecting numeric in D21361 / R21361C4: got 'n.a.'
## Warning: Expecting numeric in D21362 / R21362C4: got 'n.a.'
## Warning: Expecting numeric in D21363 / R21363C4: got 'n.a.'
## Warning: Expecting numeric in D21364 / R21364C4: got 'n.a.'
## Warning: Expecting numeric in D21365 / R21365C4: got 'n.a.'
## Warning: Expecting numeric in D21366 / R21366C4: got 'n.a.'
## Warning: Expecting numeric in D21367 / R21367C4: got 'n.a.'
## Warning: Expecting numeric in D21368 / R21368C4: got 'n.a.'
## Warning: Expecting numeric in D21369 / R21369C4: got 'n.a.'
## Warning: Expecting numeric in D21370 / R21370C4: got 'n.a.'
## Warning: Expecting numeric in D21371 / R21371C4: got 'n.a.'
## Warning: Expecting numeric in D21372 / R21372C4: got 'n.a.'
## Warning: Expecting numeric in D21373 / R21373C4: got 'n.a.'
## Warning: Expecting numeric in D21374 / R21374C4: got 'n.a.'
## Warning: Expecting numeric in D21375 / R21375C4: got 'n.a.'
## Warning: Expecting numeric in D21376 / R21376C4: got 'n.a.'
## Warning: Expecting numeric in D21377 / R21377C4: got 'n.a.'
## Warning: Expecting numeric in D21378 / R21378C4: got 'n.a.'
## Warning: Expecting numeric in D21379 / R21379C4: got 'n.a.'
## Warning: Expecting numeric in D21380 / R21380C4: got 'n.a.'
## Warning: Expecting numeric in D21381 / R21381C4: got 'n.a.'
## Warning: Expecting numeric in D21382 / R21382C4: got 'n.a.'
## Warning: Expecting numeric in D21383 / R21383C4: got 'n.a.'
## Warning: Expecting numeric in D21384 / R21384C4: got 'n.a.'
## Warning: Expecting numeric in D21385 / R21385C4: got 'n.a.'
## Warning: Expecting numeric in D21386 / R21386C4: got 'n.a.'
## Warning: Expecting numeric in D21387 / R21387C4: got 'n.a.'
## Warning: Expecting numeric in D21388 / R21388C4: got 'n.a.'
## Warning: Expecting numeric in D21389 / R21389C4: got 'n.a.'
## Warning: Expecting numeric in D21390 / R21390C4: got 'n.a.'
## Warning: Expecting numeric in D21391 / R21391C4: got 'n.a.'
## Warning: Expecting numeric in D21392 / R21392C4: got 'n.a.'
## Warning: Expecting numeric in D21393 / R21393C4: got 'n.a.'
## Warning: Expecting numeric in D21394 / R21394C4: got 'n.a.'
## Warning: Expecting numeric in D21395 / R21395C4: got 'n.a.'
## Warning: Expecting numeric in D21396 / R21396C4: got 'n.a.'
## Warning: Expecting numeric in D21397 / R21397C4: got 'n.a.'
## Warning: Expecting numeric in D21398 / R21398C4: got 'n.a.'
## Warning: Expecting numeric in D21399 / R21399C4: got 'n.a.'
## Warning: Expecting numeric in D21400 / R21400C4: got 'n.a.'
## Warning: Expecting numeric in D21401 / R21401C4: got 'n.a.'
## Warning: Expecting numeric in D21402 / R21402C4: got 'n.a.'
## Warning: Expecting numeric in D21403 / R21403C4: got 'n.a.'
## Warning: Expecting numeric in D21404 / R21404C4: got 'n.a.'
## Warning: Expecting numeric in D21405 / R21405C4: got 'n.a.'
## Warning: Expecting numeric in D21406 / R21406C4: got 'n.a.'
## Warning: Expecting numeric in D21407 / R21407C4: got 'n.a.'
## Warning: Expecting numeric in D21408 / R21408C4: got 'n.a.'
## Warning: Expecting numeric in D21409 / R21409C4: got 'n.a.'
## Warning: Expecting numeric in D21410 / R21410C4: got 'n.a.'
## Warning: Expecting numeric in D21411 / R21411C4: got 'n.a.'
## Warning: Expecting numeric in D21412 / R21412C4: got 'n.a.'
## Warning: Expecting numeric in D21413 / R21413C4: got 'n.a.'
## Warning: Expecting numeric in D21414 / R21414C4: got 'n.a.'
## Warning: Expecting numeric in D21415 / R21415C4: got 'n.a.'
## Warning: Expecting numeric in D21416 / R21416C4: got 'n.a.'
## Warning: Expecting numeric in D21417 / R21417C4: got 'n.a.'
## Warning: Expecting numeric in D21418 / R21418C4: got 'n.a.'
## Warning: Expecting numeric in D21419 / R21419C4: got 'n.a.'
## Warning: Expecting numeric in D21420 / R21420C4: got 'n.a.'
## Warning: Expecting numeric in D21421 / R21421C4: got 'n.a.'
## Warning: Expecting numeric in D21422 / R21422C4: got 'n.a.'
## Warning: Expecting numeric in D21423 / R21423C4: got 'n.a.'
## Warning: Expecting numeric in D21424 / R21424C4: got 'n.a.'
## Warning: Expecting numeric in D21425 / R21425C4: got 'n.a.'
## Warning: Expecting numeric in D21426 / R21426C4: got 'n.a.'
## Warning: Expecting numeric in D21427 / R21427C4: got 'n.a.'
## Warning: Expecting numeric in D21428 / R21428C4: got 'n.a.'
## Warning: Expecting numeric in D21429 / R21429C4: got 'n.a.'
## Warning: Expecting numeric in D21430 / R21430C4: got 'n.a.'
## Warning: Expecting numeric in D21431 / R21431C4: got 'n.a.'
## Warning: Expecting numeric in D21432 / R21432C4: got 'n.a.'
## Warning: Expecting numeric in D21433 / R21433C4: got 'n.a.'
## Warning: Expecting numeric in D21434 / R21434C4: got 'n.a.'
## Warning: Expecting numeric in D21435 / R21435C4: got 'n.a.'
## Warning: Expecting numeric in D21436 / R21436C4: got 'n.a.'
## Warning: Expecting numeric in D21437 / R21437C4: got 'n.a.'
## Warning: Expecting numeric in D21438 / R21438C4: got 'n.a.'
## Warning: Expecting numeric in D21439 / R21439C4: got 'n.a.'
## Warning: Expecting numeric in D21440 / R21440C4: got 'n.a.'
## Warning: Expecting numeric in D21441 / R21441C4: got 'n.a.'
## Warning: Expecting numeric in D21442 / R21442C4: got 'n.a.'
## Warning: Expecting numeric in D21443 / R21443C4: got 'n.a.'
## Warning: Expecting numeric in D21444 / R21444C4: got 'n.a.'
## Warning: Expecting numeric in D21445 / R21445C4: got 'n.a.'
## Warning: Expecting numeric in D21446 / R21446C4: got 'n.a.'
## Warning: Expecting numeric in D21447 / R21447C4: got 'n.a.'
## Warning: Expecting numeric in D21448 / R21448C4: got 'n.a.'
## Warning: Expecting numeric in D21449 / R21449C4: got 'n.a.'
## Warning: Expecting numeric in D21450 / R21450C4: got 'n.a.'
## Warning: Expecting numeric in D21451 / R21451C4: got 'n.a.'
## Warning: Expecting numeric in D21452 / R21452C4: got 'n.a.'
## Warning: Expecting numeric in D21453 / R21453C4: got 'n.a.'
## Warning: Expecting numeric in D21454 / R21454C4: got 'n.a.'
## Warning: Expecting numeric in D21455 / R21455C4: got 'n.a.'
## Warning: Expecting numeric in D21456 / R21456C4: got 'n.a.'
## Warning: Expecting numeric in D21457 / R21457C4: got 'n.a.'
## Warning: Expecting numeric in D21458 / R21458C4: got 'n.a.'
## Warning: Expecting numeric in D21459 / R21459C4: got 'n.a.'
## Warning: Expecting numeric in D21460 / R21460C4: got 'n.a.'
## Warning: Expecting numeric in D21461 / R21461C4: got 'n.a.'
## Warning: Expecting numeric in D21462 / R21462C4: got 'n.a.'
## Warning: Expecting numeric in D21463 / R21463C4: got 'n.a.'
## Warning: Expecting numeric in D21464 / R21464C4: got 'n.a.'
## Warning: Expecting numeric in D21465 / R21465C4: got 'n.a.'
## Warning: Expecting numeric in D21466 / R21466C4: got 'n.a.'
## Warning: Expecting numeric in D21467 / R21467C4: got 'n.a.'
## Warning: Expecting numeric in D21468 / R21468C4: got 'n.a.'
## Warning: Expecting numeric in D21469 / R21469C4: got 'n.a.'
## Warning: Expecting numeric in D21470 / R21470C4: got 'n.a.'
## Warning: Expecting numeric in D21471 / R21471C4: got 'n.a.'
## Warning: Expecting numeric in D21472 / R21472C4: got 'n.a.'
## Warning: Expecting numeric in D21473 / R21473C4: got 'n.a.'
## Warning: Expecting numeric in D21474 / R21474C4: got 'n.a.'
## Warning: Expecting numeric in D21475 / R21475C4: got 'n.a.'
## Warning: Expecting numeric in D21476 / R21476C4: got 'n.a.'
## Warning: Expecting numeric in D21477 / R21477C4: got 'n.a.'
## Warning: Expecting numeric in D21478 / R21478C4: got 'n.a.'
## Warning: Expecting numeric in D21479 / R21479C4: got 'n.a.'
## Warning: Expecting numeric in D21480 / R21480C4: got 'n.a.'
## Warning: Expecting numeric in D21481 / R21481C4: got 'n.a.'
## Warning: Expecting numeric in D21482 / R21482C4: got 'n.a.'
## Warning: Expecting numeric in D21483 / R21483C4: got 'n.a.'
## Warning: Expecting numeric in D21484 / R21484C4: got 'n.a.'
## Warning: Expecting numeric in D21485 / R21485C4: got 'n.a.'
## Warning: Expecting numeric in D21486 / R21486C4: got 'n.a.'
## Warning: Expecting numeric in D21487 / R21487C4: got 'n.a.'
## Warning: Expecting numeric in D21488 / R21488C4: got 'n.a.'
## Warning: Expecting numeric in D21489 / R21489C4: got 'n.a.'
## Warning: Expecting numeric in D21490 / R21490C4: got 'n.a.'
## Warning: Expecting numeric in D21491 / R21491C4: got 'n.a.'
## Warning: Expecting numeric in D21492 / R21492C4: got 'n.a.'
## Warning: Expecting numeric in D21493 / R21493C4: got 'n.a.'
## Warning: Expecting numeric in D21494 / R21494C4: got 'n.a.'
## Warning: Expecting numeric in D21495 / R21495C4: got 'n.a.'
## Warning: Expecting numeric in D21496 / R21496C4: got 'n.a.'
## Warning: Expecting numeric in D21497 / R21497C4: got 'n.a.'
## Warning: Expecting numeric in D21498 / R21498C4: got 'n.a.'
## Warning: Expecting numeric in D21499 / R21499C4: got 'n.a.'
## Warning: Expecting numeric in D21500 / R21500C4: got 'n.a.'
## Warning: Expecting numeric in D21501 / R21501C4: got 'n.a.'
## Warning: Expecting numeric in D21502 / R21502C4: got 'n.a.'
## Warning: Expecting numeric in D21503 / R21503C4: got 'n.a.'
## Warning: Expecting numeric in D21504 / R21504C4: got 'n.a.'
## Warning: Expecting numeric in D21505 / R21505C4: got 'n.a.'
## Warning: Expecting numeric in D21506 / R21506C4: got 'n.a.'
## Warning: Expecting numeric in D21507 / R21507C4: got 'n.a.'
## Warning: Expecting numeric in D21508 / R21508C4: got 'n.a.'
## Warning: Expecting numeric in D21509 / R21509C4: got 'n.a.'
## Warning: Expecting numeric in D21510 / R21510C4: got 'n.a.'
## Warning: Expecting numeric in D21511 / R21511C4: got 'n.a.'
## Warning: Expecting numeric in D21512 / R21512C4: got 'n.a.'
## Warning: Expecting numeric in D21513 / R21513C4: got 'n.a.'
## Warning: Expecting numeric in D21514 / R21514C4: got 'n.a.'
## Warning: Expecting numeric in D21515 / R21515C4: got 'n.a.'
## Warning: Expecting numeric in D21516 / R21516C4: got 'n.a.'
## Warning: Expecting numeric in D21517 / R21517C4: got 'n.a.'
## Warning: Expecting numeric in D21518 / R21518C4: got 'n.a.'
## Warning: Expecting numeric in D21519 / R21519C4: got 'n.a.'
## Warning: Expecting numeric in D21520 / R21520C4: got 'n.a.'
## Warning: Expecting numeric in D21521 / R21521C4: got 'n.a.'
## Warning: Expecting numeric in D21522 / R21522C4: got 'n.a.'
## Warning: Expecting numeric in D21523 / R21523C4: got 'n.a.'
## Warning: Expecting numeric in D21524 / R21524C4: got 'n.a.'
## Warning: Expecting numeric in D21525 / R21525C4: got 'n.a.'
## Warning: Expecting numeric in D21526 / R21526C4: got 'n.a.'
## Warning: Expecting numeric in D21527 / R21527C4: got 'n.a.'
## Warning: Expecting numeric in D21528 / R21528C4: got 'n.a.'
## Warning: Expecting numeric in D21529 / R21529C4: got 'n.a.'
## Warning: Expecting numeric in D21530 / R21530C4: got 'n.a.'
## Warning: Expecting numeric in D21531 / R21531C4: got 'n.a.'
## Warning: Expecting numeric in D21532 / R21532C4: got 'n.a.'
## Warning: Expecting numeric in D21533 / R21533C4: got 'n.a.'
## Warning: Expecting numeric in D21534 / R21534C4: got 'n.a.'
## Warning: Expecting numeric in D21535 / R21535C4: got 'n.a.'
## Warning: Expecting numeric in D21536 / R21536C4: got 'n.a.'
## Warning: Expecting numeric in D21537 / R21537C4: got 'n.a.'
## Warning: Expecting numeric in D21538 / R21538C4: got 'n.a.'
## Warning: Expecting numeric in D21539 / R21539C4: got 'n.a.'
## Warning: Expecting numeric in D21540 / R21540C4: got 'n.a.'
## Warning: Expecting numeric in D21541 / R21541C4: got 'n.a.'
## Warning: Expecting numeric in D21542 / R21542C4: got 'n.a.'
## Warning: Expecting numeric in D21543 / R21543C4: got 'n.a.'
## Warning: Expecting numeric in D21544 / R21544C4: got 'n.a.'
## Warning: Expecting numeric in D21545 / R21545C4: got 'n.a.'
## Warning: Expecting numeric in D21546 / R21546C4: got 'n.a.'
## Warning: Expecting numeric in D21547 / R21547C4: got 'n.a.'
## Warning: Expecting numeric in D21548 / R21548C4: got 'n.a.'
## Warning: Expecting numeric in D21549 / R21549C4: got 'n.a.'
## Warning: Expecting numeric in D21550 / R21550C4: got 'n.a.'
## Warning: Expecting numeric in D21551 / R21551C4: got 'n.a.'
## Warning: Expecting numeric in D21552 / R21552C4: got 'n.a.'
## Warning: Expecting numeric in D21553 / R21553C4: got 'n.a.'
## Warning: Expecting numeric in D21554 / R21554C4: got 'n.a.'
## Warning: Expecting numeric in D21555 / R21555C4: got 'n.a.'
## Warning: Expecting numeric in D21556 / R21556C4: got 'n.a.'
## Warning: Expecting numeric in D21557 / R21557C4: got 'n.a.'
## Warning: Expecting numeric in D21558 / R21558C4: got 'n.a.'
## Warning: Expecting numeric in D21559 / R21559C4: got 'n.a.'
## Warning: Expecting numeric in D21560 / R21560C4: got 'n.a.'
## Warning: Expecting numeric in D21561 / R21561C4: got 'n.a.'
## Warning: Expecting numeric in D21562 / R21562C4: got 'n.a.'
## Warning: Expecting numeric in D21563 / R21563C4: got 'n.a.'
## Warning: Expecting numeric in D21564 / R21564C4: got 'n.a.'
## Warning: Expecting numeric in D21565 / R21565C4: got 'n.a.'
## Warning: Expecting numeric in D21566 / R21566C4: got 'n.a.'
## Warning: Expecting numeric in D21567 / R21567C4: got 'n.a.'
## Warning: Expecting numeric in D21568 / R21568C4: got 'n.a.'
## Warning: Expecting numeric in D21569 / R21569C4: got 'n.a.'
## Warning: Expecting numeric in D21570 / R21570C4: got 'n.a.'
## Warning: Expecting numeric in D21571 / R21571C4: got 'n.a.'
## Warning: Expecting numeric in D21572 / R21572C4: got 'n.a.'
## Warning: Expecting numeric in D21573 / R21573C4: got 'n.a.'
## Warning: Expecting numeric in D21574 / R21574C4: got 'n.a.'
## Warning: Expecting numeric in D21575 / R21575C4: got 'n.a.'
## Warning: Expecting numeric in D21576 / R21576C4: got 'n.a.'
## Warning: Expecting numeric in D21577 / R21577C4: got 'n.a.'
## Warning: Expecting numeric in D21578 / R21578C4: got 'n.a.'
## Warning: Expecting numeric in D21579 / R21579C4: got 'n.a.'
## Warning: Expecting numeric in D21580 / R21580C4: got 'n.a.'
## Warning: Expecting numeric in D21581 / R21581C4: got 'n.a.'
## Warning: Expecting numeric in D21582 / R21582C4: got 'n.a.'
## Warning: Expecting numeric in D21583 / R21583C4: got 'n.a.'
## Warning: Expecting numeric in D21584 / R21584C4: got 'n.a.'
## Warning: Expecting numeric in D21585 / R21585C4: got 'n.a.'
## Warning: Expecting numeric in D21586 / R21586C4: got 'n.a.'
## Warning: Expecting numeric in D21587 / R21587C4: got 'n.a.'
## Warning: Expecting numeric in D21588 / R21588C4: got 'n.a.'
## Warning: Expecting numeric in D21589 / R21589C4: got 'n.a.'
## Warning: Expecting numeric in D21590 / R21590C4: got 'n.a.'
## Warning: Expecting numeric in D21591 / R21591C4: got 'n.a.'
## Warning: Expecting numeric in D21592 / R21592C4: got 'n.a.'
## Warning: Expecting numeric in D21593 / R21593C4: got 'n.a.'
## Warning: Expecting numeric in D21594 / R21594C4: got 'n.a.'
## Warning: Expecting numeric in D21595 / R21595C4: got 'n.a.'
## Warning: Expecting numeric in D21596 / R21596C4: got 'n.a.'
## Warning: Expecting numeric in D21597 / R21597C4: got 'n.a.'
## Warning: Expecting numeric in D21598 / R21598C4: got 'n.a.'
## Warning: Expecting numeric in D21599 / R21599C4: got 'n.a.'
## Warning: Expecting numeric in D21600 / R21600C4: got 'n.a.'
## Warning: Expecting numeric in D21601 / R21601C4: got 'n.a.'
## Warning: Expecting numeric in D21602 / R21602C4: got 'n.a.'
## Warning: Expecting numeric in D21603 / R21603C4: got 'n.a.'
## Warning: Expecting numeric in D21604 / R21604C4: got 'n.a.'
## Warning: Expecting numeric in D21605 / R21605C4: got 'n.a.'
## Warning: Expecting numeric in D21606 / R21606C4: got 'n.a.'
## Warning: Expecting numeric in D21607 / R21607C4: got 'n.a.'
## Warning: Expecting numeric in D21608 / R21608C4: got 'n.a.'
## Warning: Expecting numeric in D21609 / R21609C4: got 'n.a.'
## Warning: Expecting numeric in D21610 / R21610C4: got 'n.a.'
## Warning: Expecting numeric in D21611 / R21611C4: got 'n.a.'
## Warning: Expecting numeric in D21612 / R21612C4: got 'n.a.'
## Warning: Expecting numeric in D21613 / R21613C4: got 'n.a.'
## Warning: Expecting numeric in D21614 / R21614C4: got 'n.a.'
## Warning: Expecting numeric in D21615 / R21615C4: got 'n.a.'
## Warning: Expecting numeric in D21616 / R21616C4: got 'n.a.'
## Warning: Expecting numeric in D21617 / R21617C4: got 'n.a.'
## Warning: Expecting numeric in D21618 / R21618C4: got 'n.a.'
## Warning: Expecting numeric in D21619 / R21619C4: got 'n.a.'
## Warning: Expecting numeric in D21620 / R21620C4: got 'n.a.'
## Warning: Expecting numeric in D21621 / R21621C4: got 'n.a.'
## Warning: Expecting numeric in D21622 / R21622C4: got 'n.a.'
## Warning: Expecting numeric in D21623 / R21623C4: got 'n.a.'
## Warning: Expecting numeric in D21624 / R21624C4: got 'n.a.'
## Warning: Expecting numeric in D21625 / R21625C4: got 'n.a.'
## Warning: Expecting numeric in D21626 / R21626C4: got 'n.a.'
## Warning: Expecting numeric in D21627 / R21627C4: got 'n.a.'
## Warning: Expecting numeric in D21628 / R21628C4: got 'n.a.'
## Warning: Expecting numeric in D21629 / R21629C4: got 'n.a.'
## Warning: Expecting numeric in D21630 / R21630C4: got 'n.a.'
## Warning: Expecting numeric in D21631 / R21631C4: got 'n.a.'
## Warning: Expecting numeric in D21632 / R21632C4: got 'n.a.'
## Warning: Expecting numeric in D21633 / R21633C4: got 'n.a.'
## Warning: Expecting numeric in D21634 / R21634C4: got 'n.a.'
## Warning: Expecting numeric in D21635 / R21635C4: got 'n.a.'
## Warning: Expecting numeric in D21636 / R21636C4: got 'n.a.'
## Warning: Expecting numeric in D21637 / R21637C4: got 'n.a.'
## Warning: Expecting numeric in D21638 / R21638C4: got 'n.a.'
## Warning: Expecting numeric in D21639 / R21639C4: got 'n.a.'
## Warning: Expecting numeric in D21640 / R21640C4: got 'n.a.'
## Warning: Expecting numeric in D21641 / R21641C4: got 'n.a.'
## Warning: Expecting numeric in D21642 / R21642C4: got 'n.a.'
## Warning: Expecting numeric in D21643 / R21643C4: got 'n.a.'
## Warning: Expecting numeric in D21644 / R21644C4: got 'n.a.'
## Warning: Expecting numeric in D21645 / R21645C4: got 'n.a.'
## Warning: Expecting numeric in D21646 / R21646C4: got 'n.a.'
## Warning: Expecting numeric in D21647 / R21647C4: got 'n.a.'
## Warning: Expecting numeric in D21648 / R21648C4: got 'n.a.'
## Warning: Expecting numeric in D21649 / R21649C4: got 'n.a.'
## Warning: Expecting numeric in D21650 / R21650C4: got 'n.a.'
## Warning: Expecting numeric in D21651 / R21651C4: got 'n.a.'
## Warning: Expecting numeric in D21652 / R21652C4: got 'n.a.'
## Warning: Expecting numeric in D21653 / R21653C4: got 'n.a.'
## Warning: Expecting numeric in D21654 / R21654C4: got 'n.a.'
## Warning: Expecting numeric in D21655 / R21655C4: got 'n.a.'
## Warning: Expecting numeric in D21656 / R21656C4: got 'n.a.'
## Warning: Expecting numeric in D21657 / R21657C4: got 'n.a.'
## Warning: Expecting numeric in D21658 / R21658C4: got 'n.a.'
## Warning: Expecting numeric in D21659 / R21659C4: got 'n.a.'
## Warning: Expecting numeric in D21660 / R21660C4: got 'n.a.'
## Warning: Expecting numeric in D21661 / R21661C4: got 'n.a.'
## Warning: Expecting numeric in D21662 / R21662C4: got 'n.a.'
## Warning: Expecting numeric in D21663 / R21663C4: got 'n.a.'
## Warning: Expecting numeric in D21664 / R21664C4: got 'n.a.'
## Warning: Expecting numeric in D21665 / R21665C4: got 'n.a.'
## Warning: Expecting numeric in D21666 / R21666C4: got 'n.a.'
## Warning: Expecting numeric in D21667 / R21667C4: got 'n.a.'
## Warning: Expecting numeric in D21668 / R21668C4: got 'n.a.'
## Warning: Expecting numeric in D21669 / R21669C4: got 'n.a.'
## Warning: Expecting numeric in D21670 / R21670C4: got 'n.a.'
## Warning: Expecting numeric in D21671 / R21671C4: got 'n.a.'
## Warning: Expecting numeric in D21672 / R21672C4: got 'n.a.'
## Warning: Expecting numeric in D21673 / R21673C4: got 'n.a.'
## Warning: Expecting numeric in D21674 / R21674C4: got 'n.a.'
## Warning: Expecting numeric in D21675 / R21675C4: got 'n.a.'
## Warning: Expecting numeric in D21676 / R21676C4: got 'n.a.'
## Warning: Expecting numeric in D21677 / R21677C4: got 'n.a.'
## Warning: Expecting numeric in D21678 / R21678C4: got 'n.a.'
## Warning: Expecting numeric in D21679 / R21679C4: got 'n.a.'
## Warning: Expecting numeric in D21680 / R21680C4: got 'n.a.'
## Warning: Expecting numeric in D21681 / R21681C4: got 'n.a.'
## Warning: Expecting numeric in D21682 / R21682C4: got 'n.a.'
## Warning: Expecting numeric in D21683 / R21683C4: got 'n.a.'
## Warning: Expecting numeric in D21684 / R21684C4: got 'n.a.'
## Warning: Expecting numeric in D21685 / R21685C4: got 'n.a.'
## Warning: Expecting numeric in D21686 / R21686C4: got 'n.a.'
## Warning: Expecting numeric in D21687 / R21687C4: got 'n.a.'
## Warning: Expecting numeric in D21688 / R21688C4: got 'n.a.'
## Warning: Expecting numeric in D21689 / R21689C4: got 'n.a.'
## Warning: Expecting numeric in D21690 / R21690C4: got 'n.a.'
## Warning: Expecting numeric in D21691 / R21691C4: got 'n.a.'
## Warning: Expecting numeric in D21692 / R21692C4: got 'n.a.'
## Warning: Expecting numeric in D21693 / R21693C4: got 'n.a.'
## Warning: Expecting numeric in D21694 / R21694C4: got 'n.a.'
## Warning: Expecting numeric in D21695 / R21695C4: got 'n.a.'
## Warning: Expecting numeric in D21696 / R21696C4: got 'n.a.'
## Warning: Expecting numeric in D21697 / R21697C4: got 'n.a.'
## Warning: Expecting numeric in D21698 / R21698C4: got 'n.a.'
## Warning: Expecting numeric in D21699 / R21699C4: got 'n.a.'
## Warning: Expecting numeric in D21700 / R21700C4: got 'n.a.'
## Warning: Expecting numeric in D21701 / R21701C4: got 'n.a.'
## Warning: Expecting numeric in D21702 / R21702C4: got 'n.a.'
## Warning: Expecting numeric in D21703 / R21703C4: got 'n.a.'
## Warning: Expecting numeric in D21704 / R21704C4: got 'n.a.'
## Warning: Expecting numeric in D21705 / R21705C4: got 'n.a.'
## Warning: Expecting numeric in D21706 / R21706C4: got 'n.a.'
## Warning: Expecting numeric in D21707 / R21707C4: got 'n.a.'
## Warning: Expecting numeric in D21708 / R21708C4: got 'n.a.'
## Warning: Expecting numeric in D21709 / R21709C4: got 'n.a.'
## Warning: Expecting numeric in D21710 / R21710C4: got 'n.a.'
## Warning: Expecting numeric in D21711 / R21711C4: got 'n.a.'
## Warning: Expecting numeric in D21712 / R21712C4: got 'n.a.'
## Warning: Expecting numeric in D21713 / R21713C4: got 'n.a.'
## Warning: Expecting numeric in D21714 / R21714C4: got 'n.a.'
## Warning: Expecting numeric in D21715 / R21715C4: got 'n.a.'
## Warning: Expecting numeric in D21716 / R21716C4: got 'n.a.'
## Warning: Expecting numeric in D21717 / R21717C4: got 'n.a.'
## Warning: Expecting numeric in D21718 / R21718C4: got 'n.a.'
## Warning: Expecting numeric in D21719 / R21719C4: got 'n.a.'
## Warning: Expecting numeric in D21720 / R21720C4: got 'n.a.'
## Warning: Expecting numeric in D21721 / R21721C4: got 'n.a.'
## Warning: Expecting numeric in D21722 / R21722C4: got 'n.a.'
## Warning: Expecting numeric in D21723 / R21723C4: got 'n.a.'
## Warning: Expecting numeric in D21724 / R21724C4: got 'n.a.'
## Warning: Expecting numeric in D21725 / R21725C4: got 'n.a.'
## Warning: Expecting numeric in D21726 / R21726C4: got 'n.a.'
## Warning: Expecting numeric in D21727 / R21727C4: got 'n.a.'
## Warning: Expecting numeric in D21728 / R21728C4: got 'n.a.'
## Warning: Expecting numeric in D21729 / R21729C4: got 'n.a.'
## Warning: Expecting numeric in D21730 / R21730C4: got 'n.a.'
## Warning: Expecting numeric in D21731 / R21731C4: got 'n.a.'
## Warning: Expecting numeric in D21732 / R21732C4: got 'n.a.'
## Warning: Expecting numeric in D21733 / R21733C4: got 'n.a.'
## Warning: Expecting numeric in D21734 / R21734C4: got 'n.a.'
## Warning: Expecting numeric in D21735 / R21735C4: got 'n.a.'
## Warning: Expecting numeric in D21736 / R21736C4: got 'n.a.'
## Warning: Expecting numeric in D21737 / R21737C4: got 'n.a.'
## Warning: Expecting numeric in D21738 / R21738C4: got 'n.a.'
## Warning: Expecting numeric in D21739 / R21739C4: got 'n.a.'
## Warning: Expecting numeric in D21740 / R21740C4: got 'n.a.'
## Warning: Expecting numeric in D21741 / R21741C4: got 'n.a.'
## Warning: Expecting numeric in D21742 / R21742C4: got 'n.a.'
## Warning: Expecting numeric in D21743 / R21743C4: got 'n.a.'
## Warning: Expecting numeric in D21744 / R21744C4: got 'n.a.'
## Warning: Expecting numeric in D21745 / R21745C4: got 'n.a.'
## Warning: Expecting numeric in D21746 / R21746C4: got 'n.a.'
## Warning: Expecting numeric in D21747 / R21747C4: got 'n.a.'
## Warning: Expecting numeric in D21748 / R21748C4: got 'n.a.'
## Warning: Expecting numeric in D21749 / R21749C4: got 'n.a.'
## Warning: Expecting numeric in D21750 / R21750C4: got 'n.a.'
## Warning: Expecting numeric in D21751 / R21751C4: got 'n.a.'
## Warning: Expecting numeric in D21752 / R21752C4: got 'n.a.'
## Warning: Expecting numeric in D21753 / R21753C4: got 'n.a.'
## Warning: Expecting numeric in D21754 / R21754C4: got 'n.a.'
## Warning: Expecting numeric in D21755 / R21755C4: got 'n.a.'
## Warning: Expecting numeric in D21756 / R21756C4: got 'n.a.'
## Warning: Expecting numeric in D21757 / R21757C4: got 'n.a.'
## Warning: Expecting numeric in D21758 / R21758C4: got 'n.a.'
## Warning: Expecting numeric in D21759 / R21759C4: got 'n.a.'
## Warning: Expecting numeric in D21760 / R21760C4: got 'n.a.'
## Warning: Expecting numeric in D21761 / R21761C4: got 'n.a.'
## Warning: Expecting numeric in D21762 / R21762C4: got 'n.a.'
## Warning: Expecting numeric in D21763 / R21763C4: got 'n.a.'
## Warning: Expecting numeric in D21764 / R21764C4: got 'n.a.'
## Warning: Expecting numeric in D21765 / R21765C4: got 'n.a.'
## Warning: Expecting numeric in D21766 / R21766C4: got 'n.a.'
## Warning: Expecting numeric in D21767 / R21767C4: got 'n.a.'
## Warning: Expecting numeric in D21768 / R21768C4: got 'n.a.'
## Warning: Expecting numeric in D21769 / R21769C4: got 'n.a.'
## Warning: Expecting numeric in D21770 / R21770C4: got 'n.a.'
## Warning: Expecting numeric in D21771 / R21771C4: got 'n.a.'
## Warning: Expecting numeric in D21772 / R21772C4: got 'n.a.'
## Warning: Expecting numeric in D21773 / R21773C4: got 'n.a.'
## Warning: Expecting numeric in D21774 / R21774C4: got 'n.a.'
## Warning: Expecting numeric in D21775 / R21775C4: got 'n.a.'
## Warning: Expecting numeric in D21776 / R21776C4: got 'n.a.'
## Warning: Expecting numeric in D21777 / R21777C4: got 'n.a.'
## Warning: Expecting numeric in D21778 / R21778C4: got 'n.a.'
## Warning: Expecting numeric in D21779 / R21779C4: got 'n.a.'
## Warning: Expecting numeric in D21780 / R21780C4: got 'n.a.'
## Warning: Expecting numeric in D21781 / R21781C4: got 'n.a.'
## Warning: Expecting numeric in D21782 / R21782C4: got 'n.a.'
## Warning: Expecting numeric in D21783 / R21783C4: got 'n.a.'
## Warning: Expecting numeric in D21784 / R21784C4: got 'n.a.'
## Warning: Expecting numeric in D21785 / R21785C4: got 'n.a.'
## Warning: Expecting numeric in D21786 / R21786C4: got 'n.a.'
## Warning: Expecting numeric in D21787 / R21787C4: got 'n.a.'
## Warning: Expecting numeric in D21788 / R21788C4: got 'n.a.'
## Warning: Expecting numeric in D21789 / R21789C4: got 'n.a.'
## Warning: Expecting numeric in D21790 / R21790C4: got 'n.a.'
## Warning: Expecting numeric in D21791 / R21791C4: got 'n.a.'
## Warning: Expecting numeric in D21792 / R21792C4: got 'n.a.'
## Warning: Expecting numeric in D21793 / R21793C4: got 'n.a.'
## Warning: Expecting numeric in D21794 / R21794C4: got 'n.a.'
## Warning: Expecting numeric in D21795 / R21795C4: got 'n.a.'
## Warning: Expecting numeric in D21796 / R21796C4: got 'n.a.'
## Warning: Expecting numeric in D21797 / R21797C4: got 'n.a.'
## Warning: Expecting numeric in D21798 / R21798C4: got 'n.a.'
## Warning: Expecting numeric in D21799 / R21799C4: got 'n.a.'
## Warning: Expecting numeric in D21800 / R21800C4: got 'n.a.'
## Warning: Expecting numeric in D21801 / R21801C4: got 'n.a.'
## Warning: Expecting numeric in D21802 / R21802C4: got 'n.a.'
## Warning: Expecting numeric in D21803 / R21803C4: got 'n.a.'
## Warning: Expecting numeric in D21804 / R21804C4: got 'n.a.'
## Warning: Expecting numeric in D21805 / R21805C4: got 'n.a.'
## Warning: Expecting numeric in D21806 / R21806C4: got 'n.a.'
## Warning: Expecting numeric in D21807 / R21807C4: got 'n.a.'
## Warning: Expecting numeric in D21808 / R21808C4: got 'n.a.'
## Warning: Expecting numeric in D21809 / R21809C4: got 'n.a.'
## Warning: Expecting numeric in D21810 / R21810C4: got 'n.a.'
## Warning: Expecting numeric in D21811 / R21811C4: got 'n.a.'
## Warning: Expecting numeric in D21812 / R21812C4: got 'n.a.'
## Warning: Expecting numeric in D21813 / R21813C4: got 'n.a.'
## Warning: Expecting numeric in D21814 / R21814C4: got 'n.a.'
## Warning: Expecting numeric in D21815 / R21815C4: got 'n.a.'
## Warning: Expecting numeric in D21816 / R21816C4: got 'n.a.'
## Warning: Expecting numeric in D21817 / R21817C4: got 'n.a.'
## Warning: Expecting numeric in D21818 / R21818C4: got 'n.a.'
## Warning: Expecting numeric in D21819 / R21819C4: got 'n.a.'
## Warning: Expecting numeric in D21820 / R21820C4: got 'n.a.'
## Warning: Expecting numeric in D21821 / R21821C4: got 'n.a.'
## Warning: Expecting numeric in D21822 / R21822C4: got 'n.a.'
## Warning: Expecting numeric in D21823 / R21823C4: got 'n.a.'
## Warning: Expecting numeric in D21824 / R21824C4: got 'n.a.'
## Warning: Expecting numeric in D21825 / R21825C4: got 'n.a.'
## Warning: Expecting numeric in D21826 / R21826C4: got 'n.a.'
## Warning: Expecting numeric in D21827 / R21827C4: got 'n.a.'
## Warning: Expecting numeric in D21828 / R21828C4: got 'n.a.'
## Warning: Expecting numeric in D21829 / R21829C4: got 'n.a.'
## Warning: Expecting numeric in D21830 / R21830C4: got 'n.a.'
## Warning: Expecting numeric in D21831 / R21831C4: got 'n.a.'
## Warning: Expecting numeric in D21832 / R21832C4: got 'n.a.'
## Warning: Expecting numeric in D21833 / R21833C4: got 'n.a.'
## Warning: Expecting numeric in D21834 / R21834C4: got 'n.a.'
## Warning: Expecting numeric in D21835 / R21835C4: got 'n.a.'
## Warning: Expecting numeric in D21836 / R21836C4: got 'n.a.'
## Warning: Expecting numeric in D21837 / R21837C4: got 'n.a.'
## Warning: Expecting numeric in D21838 / R21838C4: got 'n.a.'
## Warning: Expecting numeric in D21839 / R21839C4: got 'n.a.'
## Warning: Expecting numeric in D21840 / R21840C4: got 'n.a.'
## Warning: Expecting numeric in D21841 / R21841C4: got 'n.a.'
## Warning: Expecting numeric in D21842 / R21842C4: got 'n.a.'
## Warning: Expecting numeric in D21843 / R21843C4: got 'n.a.'
## Warning: Expecting numeric in D21844 / R21844C4: got 'n.a.'
## Warning: Expecting numeric in D21845 / R21845C4: got 'n.a.'
## Warning: Expecting numeric in D21846 / R21846C4: got 'n.a.'
## Warning: Expecting numeric in D21847 / R21847C4: got 'n.a.'
## Warning: Expecting numeric in D21848 / R21848C4: got 'n.a.'
## Warning: Expecting numeric in D21849 / R21849C4: got 'n.a.'
## Warning: Expecting numeric in D21850 / R21850C4: got 'n.a.'
## Warning: Expecting numeric in D21851 / R21851C4: got 'n.a.'
## Warning: Expecting numeric in D21852 / R21852C4: got 'n.a.'
## Warning: Expecting numeric in D21853 / R21853C4: got 'n.a.'
## Warning: Expecting numeric in D21854 / R21854C4: got 'n.a.'
## Warning: Expecting numeric in D21855 / R21855C4: got 'n.a.'
## Warning: Expecting numeric in D21856 / R21856C4: got 'n.a.'
## Warning: Expecting numeric in D21857 / R21857C4: got 'n.a.'
## Warning: Expecting numeric in D21858 / R21858C4: got 'n.a.'
## Warning: Expecting numeric in D21859 / R21859C4: got 'n.a.'
## Warning: Expecting numeric in D21860 / R21860C4: got 'n.a.'
## Warning: Expecting numeric in D21861 / R21861C4: got 'n.a.'
## Warning: Expecting numeric in D21862 / R21862C4: got 'n.a.'
## Warning: Expecting numeric in D21863 / R21863C4: got 'n.a.'
## Warning: Expecting numeric in D21864 / R21864C4: got 'n.a.'
## Warning: Expecting numeric in D21865 / R21865C4: got 'n.a.'
## Warning: Expecting numeric in D21866 / R21866C4: got 'n.a.'
## Warning: Expecting numeric in D21867 / R21867C4: got 'n.a.'
## Warning: Expecting numeric in D21868 / R21868C4: got 'n.a.'
## Warning: Expecting numeric in D21869 / R21869C4: got 'n.a.'
## Warning: Expecting numeric in D21870 / R21870C4: got 'n.a.'
## Warning: Expecting numeric in D21871 / R21871C4: got 'n.a.'
## Warning: Expecting numeric in D21872 / R21872C4: got 'n.a.'
## Warning: Expecting numeric in D21873 / R21873C4: got 'n.a.'
## Warning: Expecting numeric in D21874 / R21874C4: got 'n.a.'
## Warning: Expecting numeric in D21875 / R21875C4: got 'n.a.'
## Warning: Expecting numeric in D21876 / R21876C4: got 'n.a.'
## Warning: Expecting numeric in D21877 / R21877C4: got 'n.a.'
## Warning: Expecting numeric in D21878 / R21878C4: got 'n.a.'
## Warning: Expecting numeric in D21879 / R21879C4: got 'n.a.'
## Warning: Expecting numeric in D21880 / R21880C4: got 'n.a.'
## Warning: Expecting numeric in D21881 / R21881C4: got 'n.a.'
## Warning: Expecting numeric in D21882 / R21882C4: got 'n.a.'
## Warning: Expecting numeric in D21883 / R21883C4: got 'n.a.'
## Warning: Expecting numeric in D21884 / R21884C4: got 'n.a.'
## Warning: Expecting numeric in D21885 / R21885C4: got 'n.a.'
## Warning: Expecting numeric in D21886 / R21886C4: got 'n.a.'
## Warning: Expecting numeric in D21887 / R21887C4: got 'n.a.'
## Warning: Expecting numeric in D21888 / R21888C4: got 'n.a.'
## Warning: Expecting numeric in D21889 / R21889C4: got 'n.a.'
## Warning: Expecting numeric in D21890 / R21890C4: got 'n.a.'
## Warning: Expecting numeric in D21891 / R21891C4: got 'n.a.'
## Warning: Expecting numeric in D21892 / R21892C4: got 'n.a.'
## Warning: Expecting numeric in D21893 / R21893C4: got 'n.a.'
## Warning: Expecting numeric in D21894 / R21894C4: got 'n.a.'
## Warning: Expecting numeric in D21895 / R21895C4: got 'n.a.'
## Warning: Expecting numeric in D21896 / R21896C4: got 'n.a.'
## Warning: Expecting numeric in D21897 / R21897C4: got 'n.a.'
## Warning: Expecting numeric in D21898 / R21898C4: got 'n.a.'
## Warning: Expecting numeric in D21899 / R21899C4: got 'n.a.'
## Warning: Expecting numeric in D21900 / R21900C4: got 'n.a.'
## Warning: Expecting numeric in D21901 / R21901C4: got 'n.a.'
## Warning: Expecting numeric in D21902 / R21902C4: got 'n.a.'
## Warning: Expecting numeric in D21903 / R21903C4: got 'n.a.'
## Warning: Expecting numeric in D21904 / R21904C4: got 'n.a.'
## Warning: Expecting numeric in D21905 / R21905C4: got 'n.a.'
## Warning: Expecting numeric in D21906 / R21906C4: got 'n.a.'
## Warning: Expecting numeric in D21907 / R21907C4: got 'n.a.'
## Warning: Expecting numeric in D21908 / R21908C4: got 'n.a.'
## Warning: Expecting numeric in D21909 / R21909C4: got 'n.a.'
## Warning: Expecting numeric in D21910 / R21910C4: got 'n.a.'
## Warning: Expecting numeric in D21911 / R21911C4: got 'n.a.'
## Warning: Expecting numeric in D21912 / R21912C4: got 'n.a.'
## Warning: Expecting numeric in D21913 / R21913C4: got 'n.a.'
## Warning: Expecting numeric in D21914 / R21914C4: got 'n.a.'
## Warning: Expecting numeric in D21915 / R21915C4: got 'n.a.'
## Warning: Expecting numeric in D21916 / R21916C4: got 'n.a.'
## Warning: Expecting numeric in D21917 / R21917C4: got 'n.a.'
## Warning: Expecting numeric in D21918 / R21918C4: got 'n.a.'
## Warning: Expecting numeric in D21919 / R21919C4: got 'n.a.'
## Warning: Expecting numeric in D21920 / R21920C4: got 'n.a.'
## Warning: Expecting numeric in D21921 / R21921C4: got 'n.a.'
## Warning: Expecting numeric in D21922 / R21922C4: got 'n.a.'
## Warning: Expecting numeric in D21923 / R21923C4: got 'n.a.'
## Warning: Expecting numeric in D21924 / R21924C4: got 'n.a.'
## Warning: Expecting numeric in D21925 / R21925C4: got 'n.a.'
## Warning: Expecting numeric in D21926 / R21926C4: got 'n.a.'
## Warning: Expecting numeric in D21927 / R21927C4: got 'n.a.'
## Warning: Expecting numeric in D21928 / R21928C4: got 'n.a.'
## Warning: Expecting numeric in D21929 / R21929C4: got 'n.a.'
## Warning: Expecting numeric in D21930 / R21930C4: got 'n.a.'
## Warning: Expecting numeric in D21931 / R21931C4: got 'n.a.'
## Warning: Expecting numeric in D21932 / R21932C4: got 'n.a.'
## Warning: Expecting numeric in D21933 / R21933C4: got 'n.a.'
## Warning: Expecting numeric in D21934 / R21934C4: got 'n.a.'
## Warning: Expecting numeric in D21935 / R21935C4: got 'n.a.'
## Warning: Expecting numeric in D21936 / R21936C4: got 'n.a.'
## Warning: Expecting numeric in D21937 / R21937C4: got 'n.a.'
## Warning: Expecting numeric in D21938 / R21938C4: got 'n.a.'
## Warning: Expecting numeric in D21939 / R21939C4: got 'n.a.'
## Warning: Expecting numeric in D21940 / R21940C4: got 'n.a.'
## Warning: Expecting numeric in D21941 / R21941C4: got 'n.a.'
## Warning: Expecting numeric in D21942 / R21942C4: got 'n.a.'
## Warning: Expecting numeric in D21943 / R21943C4: got 'n.a.'
## Warning: Expecting numeric in D21944 / R21944C4: got 'n.a.'
## Warning: Expecting numeric in D21945 / R21945C4: got 'n.a.'
## Warning: Expecting numeric in D21946 / R21946C4: got 'n.a.'
## Warning: Expecting numeric in D21947 / R21947C4: got 'n.a.'
## Warning: Expecting numeric in D21948 / R21948C4: got 'n.a.'
## Warning: Expecting numeric in D21949 / R21949C4: got 'n.a.'
## Warning: Expecting numeric in D21950 / R21950C4: got 'n.a.'
## Warning: Expecting numeric in D21951 / R21951C4: got 'n.a.'
## Warning: Expecting numeric in D21952 / R21952C4: got 'n.a.'
## Warning: Expecting numeric in D21953 / R21953C4: got 'n.a.'
## Warning: Expecting numeric in D21954 / R21954C4: got 'n.a.'
## Warning: Expecting numeric in D21955 / R21955C4: got 'n.a.'
## Warning: Expecting numeric in D21956 / R21956C4: got 'n.a.'
## Warning: Expecting numeric in D21957 / R21957C4: got 'n.a.'
## Warning: Expecting numeric in D21958 / R21958C4: got 'n.a.'
## Warning: Expecting numeric in D21959 / R21959C4: got 'n.a.'
## Warning: Expecting numeric in D21960 / R21960C4: got 'n.a.'
## Warning: Expecting numeric in D21961 / R21961C4: got 'n.a.'
## Warning: Expecting numeric in D21962 / R21962C4: got 'n.a.'
## Warning: Expecting numeric in D21963 / R21963C4: got 'n.a.'
## Warning: Expecting numeric in D21964 / R21964C4: got 'n.a.'
## Warning: Expecting numeric in D21965 / R21965C4: got 'n.a.'
## Warning: Expecting numeric in D21966 / R21966C4: got 'n.a.'
## Warning: Expecting numeric in D21967 / R21967C4: got 'n.a.'
## Warning: Expecting numeric in D21968 / R21968C4: got 'n.a.'
## Warning: Expecting numeric in D21969 / R21969C4: got 'n.a.'
## Warning: Expecting numeric in D21970 / R21970C4: got 'n.a.'
## Warning: Expecting numeric in D21971 / R21971C4: got 'n.a.'
## Warning: Expecting numeric in D21972 / R21972C4: got 'n.a.'
## Warning: Expecting numeric in D21973 / R21973C4: got 'n.a.'
## Warning: Expecting numeric in D21974 / R21974C4: got 'n.a.'
## Warning: Expecting numeric in D21975 / R21975C4: got 'n.a.'
## Warning: Expecting numeric in D21976 / R21976C4: got 'n.a.'
## Warning: Expecting numeric in D21977 / R21977C4: got 'n.a.'
## Warning: Expecting numeric in D21978 / R21978C4: got 'n.a.'
## Warning: Expecting numeric in D21979 / R21979C4: got 'n.a.'
## Warning: Expecting numeric in D21980 / R21980C4: got 'n.a.'
## Warning: Expecting numeric in D21981 / R21981C4: got 'n.a.'
## Warning: Expecting numeric in D21982 / R21982C4: got 'n.a.'
## Warning: Expecting numeric in D21983 / R21983C4: got 'n.a.'
## Warning: Expecting numeric in D21984 / R21984C4: got 'n.a.'
## Warning: Expecting numeric in D21985 / R21985C4: got 'n.a.'
## Warning: Expecting numeric in D21986 / R21986C4: got 'n.a.'
## Warning: Expecting numeric in D21987 / R21987C4: got 'n.a.'
## Warning: Expecting numeric in D21988 / R21988C4: got 'n.a.'
## Warning: Expecting numeric in D21989 / R21989C4: got 'n.a.'
## Warning: Expecting numeric in D21990 / R21990C4: got 'n.a.'
## Warning: Expecting numeric in D21991 / R21991C4: got 'n.a.'
## Warning: Expecting numeric in D21992 / R21992C4: got 'n.a.'
## Warning: Expecting numeric in D21993 / R21993C4: got 'n.a.'
## Warning: Expecting numeric in D21994 / R21994C4: got 'n.a.'
## Warning: Expecting numeric in D21995 / R21995C4: got 'n.a.'
## Warning: Expecting numeric in D21996 / R21996C4: got 'n.a.'
## Warning: Expecting numeric in D21997 / R21997C4: got 'n.a.'
## Warning: Expecting numeric in D21998 / R21998C4: got 'n.a.'
## Warning: Expecting numeric in D21999 / R21999C4: got 'n.a.'
## Warning: Expecting numeric in D22000 / R22000C4: got 'n.a.'
## Warning: Expecting numeric in D22001 / R22001C4: got 'n.a.'
## Warning: Expecting numeric in D22002 / R22002C4: got 'n.a.'
## Warning: Expecting numeric in D22003 / R22003C4: got 'n.a.'
## Warning: Expecting numeric in D22004 / R22004C4: got 'n.a.'
## Warning: Expecting numeric in D22005 / R22005C4: got 'n.a.'
## Warning: Expecting numeric in D22006 / R22006C4: got 'n.a.'
## Warning: Expecting numeric in D22007 / R22007C4: got 'n.a.'
## Warning: Expecting numeric in D22008 / R22008C4: got 'n.a.'
## Warning: Expecting numeric in D22009 / R22009C4: got 'n.a.'
## Warning: Expecting numeric in D22010 / R22010C4: got 'n.a.'
## Warning: Expecting numeric in D22011 / R22011C4: got 'n.a.'
## Warning: Expecting numeric in D22012 / R22012C4: got 'n.a.'
## Warning: Expecting numeric in D22013 / R22013C4: got 'n.a.'
## Warning: Expecting numeric in D22014 / R22014C4: got 'n.a.'
## Warning: Expecting numeric in D22015 / R22015C4: got 'n.a.'
## Warning: Expecting numeric in D22016 / R22016C4: got 'n.a.'
## Warning: Expecting numeric in D22017 / R22017C4: got 'n.a.'
## Warning: Expecting numeric in D22018 / R22018C4: got 'n.a.'
## Warning: Expecting numeric in D22019 / R22019C4: got 'n.a.'
## Warning: Expecting numeric in D22020 / R22020C4: got 'n.a.'
## Warning: Expecting numeric in D22021 / R22021C4: got 'n.a.'
## Warning: Expecting numeric in D22022 / R22022C4: got 'n.a.'
## Warning: Expecting numeric in D22023 / R22023C4: got 'n.a.'
## Warning: Expecting numeric in D22024 / R22024C4: got 'n.a.'
## Warning: Expecting numeric in D22025 / R22025C4: got 'n.a.'
## Warning: Expecting numeric in D22026 / R22026C4: got 'n.a.'
## Warning: Expecting numeric in D22027 / R22027C4: got 'n.a.'
## Warning: Expecting numeric in D22028 / R22028C4: got 'n.a.'
## Warning: Expecting numeric in D22029 / R22029C4: got 'n.a.'
## Warning: Expecting numeric in D22030 / R22030C4: got 'n.a.'
## Warning: Expecting numeric in D22031 / R22031C4: got 'n.a.'
## Warning: Expecting numeric in D22032 / R22032C4: got 'n.a.'
## Warning: Expecting numeric in D22033 / R22033C4: got 'n.a.'
## Warning: Expecting numeric in D22034 / R22034C4: got 'n.a.'
## Warning: Expecting numeric in D22035 / R22035C4: got 'n.a.'
## Warning: Expecting numeric in D22036 / R22036C4: got 'n.a.'
## Warning: Expecting numeric in D22037 / R22037C4: got 'n.a.'
## Warning: Expecting numeric in D22038 / R22038C4: got 'n.a.'
## Warning: Expecting numeric in D22039 / R22039C4: got 'n.a.'
## Warning: Expecting numeric in D22040 / R22040C4: got 'n.a.'
## Warning: Expecting numeric in D22041 / R22041C4: got 'n.a.'
## Warning: Expecting numeric in D22042 / R22042C4: got 'n.a.'
## Warning: Expecting numeric in D22043 / R22043C4: got 'n.a.'
## Warning: Expecting numeric in D22044 / R22044C4: got 'n.a.'
## Warning: Expecting numeric in D22045 / R22045C4: got 'n.a.'
## Warning: Expecting numeric in D22046 / R22046C4: got 'n.a.'
## Warning: Expecting numeric in D22047 / R22047C4: got 'n.a.'
## Warning: Expecting numeric in D22048 / R22048C4: got 'n.a.'
## Warning: Expecting numeric in D22049 / R22049C4: got 'n.a.'
## Warning: Expecting numeric in D22050 / R22050C4: got 'n.a.'
## Warning: Expecting numeric in D22051 / R22051C4: got 'n.a.'
## Warning: Expecting numeric in D22052 / R22052C4: got 'n.a.'
## Warning: Expecting numeric in D22053 / R22053C4: got 'n.a.'
## Warning: Expecting numeric in D22054 / R22054C4: got 'n.a.'
## Warning: Expecting numeric in D22055 / R22055C4: got 'n.a.'
## Warning: Expecting numeric in D22056 / R22056C4: got 'n.a.'
## Warning: Expecting numeric in D22057 / R22057C4: got 'n.a.'
## Warning: Expecting numeric in D22058 / R22058C4: got 'n.a.'
## Warning: Expecting numeric in D22059 / R22059C4: got 'n.a.'
## Warning: Expecting numeric in D22060 / R22060C4: got 'n.a.'
## Warning: Expecting numeric in D22061 / R22061C4: got 'n.a.'
## Warning: Expecting numeric in D22062 / R22062C4: got 'n.a.'
## Warning: Expecting numeric in D22063 / R22063C4: got 'n.a.'
## Warning: Expecting numeric in D22064 / R22064C4: got 'n.a.'
## Warning: Expecting numeric in D22065 / R22065C4: got 'n.a.'
## Warning: Expecting numeric in D22066 / R22066C4: got 'n.a.'
## Warning: Expecting numeric in D22067 / R22067C4: got 'n.a.'
## Warning: Expecting numeric in D22068 / R22068C4: got 'n.a.'
## Warning: Expecting numeric in D22069 / R22069C4: got 'n.a.'
## Warning: Expecting numeric in D22070 / R22070C4: got 'n.a.'
## Warning: Expecting numeric in D22071 / R22071C4: got 'n.a.'
## Warning: Expecting numeric in D22072 / R22072C4: got 'n.a.'
## Warning: Expecting numeric in D22073 / R22073C4: got 'n.a.'
## Warning: Expecting numeric in D22074 / R22074C4: got 'n.a.'
## Warning: Expecting numeric in D22075 / R22075C4: got 'n.a.'
## Warning: Expecting numeric in D22076 / R22076C4: got 'n.a.'
## Warning: Expecting numeric in D22077 / R22077C4: got 'n.a.'
## Warning: Expecting numeric in D22078 / R22078C4: got 'n.a.'
## Warning: Expecting numeric in D22079 / R22079C4: got 'n.a.'
## Warning: Expecting numeric in D22080 / R22080C4: got 'n.a.'
## Warning: Expecting numeric in D22081 / R22081C4: got 'n.a.'
## Warning: Expecting numeric in D22082 / R22082C4: got 'n.a.'
## Warning: Expecting numeric in D22083 / R22083C4: got 'n.a.'
## Warning: Expecting numeric in D22084 / R22084C4: got 'n.a.'
## Warning: Expecting numeric in D22085 / R22085C4: got 'n.a.'
## Warning: Expecting numeric in D22086 / R22086C4: got 'n.a.'
## Warning: Expecting numeric in D22087 / R22087C4: got 'n.a.'
## Warning: Expecting numeric in D22088 / R22088C4: got 'n.a.'
## Warning: Expecting numeric in D22089 / R22089C4: got 'n.a.'
## Warning: Expecting numeric in D22090 / R22090C4: got 'n.a.'
## Warning: Expecting numeric in D22091 / R22091C4: got 'n.a.'
## Warning: Expecting numeric in D22092 / R22092C4: got 'n.a.'
## Warning: Expecting numeric in D22093 / R22093C4: got 'n.a.'
## Warning: Expecting numeric in D22094 / R22094C4: got 'n.a.'
## Warning: Expecting numeric in D22095 / R22095C4: got 'n.a.'
## Warning: Expecting numeric in D22096 / R22096C4: got 'n.a.'
## Warning: Expecting numeric in D22097 / R22097C4: got 'n.a.'
## Warning: Expecting numeric in D22098 / R22098C4: got 'n.a.'
## Warning: Expecting numeric in D22099 / R22099C4: got 'n.a.'
## Warning: Expecting numeric in D22100 / R22100C4: got 'n.a.'
## Warning: Expecting numeric in D22101 / R22101C4: got 'n.a.'
## Warning: Expecting numeric in D22102 / R22102C4: got 'n.a.'
## Warning: Expecting numeric in D22103 / R22103C4: got 'n.a.'
## Warning: Expecting numeric in D22104 / R22104C4: got 'n.a.'
## Warning: Expecting numeric in D22105 / R22105C4: got 'n.a.'
## Warning: Expecting numeric in D22106 / R22106C4: got 'n.a.'
## Warning: Expecting numeric in D22107 / R22107C4: got 'n.a.'
## Warning: Expecting numeric in D22108 / R22108C4: got 'n.a.'
## Warning: Expecting numeric in D22109 / R22109C4: got 'n.a.'
## Warning: Expecting numeric in D22110 / R22110C4: got 'n.a.'
## Warning: Expecting numeric in D22111 / R22111C4: got 'n.a.'
## Warning: Expecting numeric in D22112 / R22112C4: got 'n.a.'
## Warning: Expecting numeric in D22113 / R22113C4: got 'n.a.'
## Warning: Expecting numeric in D22114 / R22114C4: got 'n.a.'
## Warning: Expecting numeric in D22115 / R22115C4: got 'n.a.'
## Warning: Expecting numeric in D22116 / R22116C4: got 'n.a.'
## Warning: Expecting numeric in D22117 / R22117C4: got 'n.a.'
## Warning: Expecting numeric in D22118 / R22118C4: got 'n.a.'
## Warning: Expecting numeric in D22119 / R22119C4: got 'n.a.'
## Warning: Expecting numeric in D22120 / R22120C4: got 'n.a.'
## Warning: Expecting numeric in D22121 / R22121C4: got 'n.a.'
## Warning: Expecting numeric in D22122 / R22122C4: got 'n.a.'
## Warning: Expecting numeric in D22123 / R22123C4: got 'n.a.'
## Warning: Expecting numeric in D22124 / R22124C4: got 'n.a.'
## Warning: Expecting numeric in D22125 / R22125C4: got 'n.a.'
## Warning: Expecting numeric in D22126 / R22126C4: got 'n.a.'
## Warning: Expecting numeric in D22127 / R22127C4: got 'n.a.'
## Warning: Expecting numeric in D22128 / R22128C4: got 'n.a.'
## Warning: Expecting numeric in D22129 / R22129C4: got 'n.a.'
## Warning: Expecting numeric in D22130 / R22130C4: got 'n.a.'
## Warning: Expecting numeric in D22131 / R22131C4: got 'n.a.'
## Warning: Expecting numeric in D22132 / R22132C4: got 'n.a.'
## Warning: Expecting numeric in D22133 / R22133C4: got 'n.a.'
## Warning: Expecting numeric in D22134 / R22134C4: got 'n.a.'
## Warning: Expecting numeric in D22135 / R22135C4: got 'n.a.'
## Warning: Expecting numeric in D22136 / R22136C4: got 'n.a.'
## Warning: Expecting numeric in D22137 / R22137C4: got 'n.a.'
## Warning: Expecting numeric in D22138 / R22138C4: got 'n.a.'
## Warning: Expecting numeric in D22139 / R22139C4: got 'n.a.'
## Warning: Expecting numeric in D22140 / R22140C4: got 'n.a.'
## Warning: Expecting numeric in D22141 / R22141C4: got 'n.a.'
## Warning: Expecting numeric in D22142 / R22142C4: got 'n.a.'
## Warning: Expecting numeric in D22143 / R22143C4: got 'n.a.'
## Warning: Expecting numeric in D22144 / R22144C4: got 'n.a.'
## Warning: Expecting numeric in D22145 / R22145C4: got 'n.a.'
## Warning: Expecting numeric in D22146 / R22146C4: got 'n.a.'
## Warning: Expecting numeric in D22147 / R22147C4: got 'n.a.'
## Warning: Expecting numeric in D22148 / R22148C4: got 'n.a.'
## Warning: Expecting numeric in D22149 / R22149C4: got 'n.a.'
## Warning: Expecting numeric in D22150 / R22150C4: got 'n.a.'
## Warning: Expecting numeric in D22151 / R22151C4: got 'n.a.'
## Warning: Expecting numeric in D22152 / R22152C4: got 'n.a.'
## Warning: Expecting numeric in D22153 / R22153C4: got 'n.a.'
## Warning: Expecting numeric in D22154 / R22154C4: got 'n.a.'
## Warning: Expecting numeric in D22155 / R22155C4: got 'n.a.'
## Warning: Expecting numeric in D22156 / R22156C4: got 'n.a.'
## Warning: Expecting numeric in D22157 / R22157C4: got 'n.a.'
## Warning: Expecting numeric in D22158 / R22158C4: got 'n.a.'
## Warning: Expecting numeric in D22159 / R22159C4: got 'n.a.'
## Warning: Expecting numeric in D22160 / R22160C4: got 'n.a.'
## Warning: Expecting numeric in D22161 / R22161C4: got 'n.a.'
## Warning: Expecting numeric in D22162 / R22162C4: got 'n.a.'
## Warning: Expecting numeric in D22163 / R22163C4: got 'n.a.'
## Warning: Expecting numeric in D22164 / R22164C4: got 'n.a.'
## Warning: Expecting numeric in D22165 / R22165C4: got 'n.a.'
## Warning: Expecting numeric in D22166 / R22166C4: got 'n.a.'
## Warning: Expecting numeric in D22167 / R22167C4: got 'n.a.'
## Warning: Expecting numeric in D22168 / R22168C4: got 'n.a.'
## Warning: Expecting numeric in D22169 / R22169C4: got 'n.a.'
## Warning: Expecting numeric in D22170 / R22170C4: got 'n.a.'
## Warning: Expecting numeric in D22171 / R22171C4: got 'n.a.'
## Warning: Expecting numeric in D22172 / R22172C4: got 'n.a.'
## Warning: Expecting numeric in D22173 / R22173C4: got 'n.a.'
## Warning: Expecting numeric in D22174 / R22174C4: got 'n.a.'
## Warning: Expecting numeric in D22175 / R22175C4: got 'n.a.'
## Warning: Expecting numeric in D22176 / R22176C4: got 'n.a.'
## Warning: Expecting numeric in D22177 / R22177C4: got 'n.a.'
## Warning: Expecting numeric in D22178 / R22178C4: got 'n.a.'
## Warning: Expecting numeric in D22179 / R22179C4: got 'n.a.'
## Warning: Expecting numeric in D22180 / R22180C4: got 'n.a.'
## Warning: Expecting numeric in D22181 / R22181C4: got 'n.a.'
## Warning: Expecting numeric in D22182 / R22182C4: got 'n.a.'
## Warning: Expecting numeric in D22183 / R22183C4: got 'n.a.'
## Warning: Expecting numeric in D22184 / R22184C4: got 'n.a.'
## Warning: Expecting numeric in D22185 / R22185C4: got 'n.a.'
## Warning: Expecting numeric in D22186 / R22186C4: got 'n.a.'
## Warning: Expecting numeric in D22187 / R22187C4: got 'n.a.'
## Warning: Expecting numeric in D22188 / R22188C4: got 'n.a.'
## Warning: Expecting numeric in D22189 / R22189C4: got 'n.a.'
## Warning: Expecting numeric in D22190 / R22190C4: got 'n.a.'
## Warning: Expecting numeric in D22191 / R22191C4: got 'n.a.'
## Warning: Expecting numeric in D22192 / R22192C4: got 'n.a.'
## Warning: Expecting numeric in D22193 / R22193C4: got 'n.a.'
## Warning: Expecting numeric in D22194 / R22194C4: got 'n.a.'
## Warning: Expecting numeric in D22195 / R22195C4: got 'n.a.'
## Warning: Expecting numeric in D22196 / R22196C4: got 'n.a.'
## Warning: Expecting numeric in D22197 / R22197C4: got 'n.a.'
## Warning: Expecting numeric in D22198 / R22198C4: got 'n.a.'
## Warning: Expecting numeric in D22199 / R22199C4: got 'n.a.'
## Warning: Expecting numeric in D22200 / R22200C4: got 'n.a.'
## Warning: Expecting numeric in D22201 / R22201C4: got 'n.a.'
## Warning: Expecting numeric in D22202 / R22202C4: got 'n.a.'
## Warning: Expecting numeric in D22203 / R22203C4: got 'n.a.'
## Warning: Expecting numeric in D22204 / R22204C4: got 'n.a.'
## Warning: Expecting numeric in D22205 / R22205C4: got 'n.a.'
## Warning: Expecting numeric in D22206 / R22206C4: got 'n.a.'
## Warning: Expecting numeric in D22207 / R22207C4: got 'n.a.'
## Warning: Expecting numeric in D22208 / R22208C4: got 'n.a.'
## Warning: Expecting numeric in D22209 / R22209C4: got 'n.a.'
## Warning: Expecting numeric in D22210 / R22210C4: got 'n.a.'
## Warning: Expecting numeric in D22211 / R22211C4: got 'n.a.'
## Warning: Expecting numeric in D22212 / R22212C4: got 'n.a.'
## Warning: Expecting numeric in D22213 / R22213C4: got 'n.a.'
## Warning: Expecting numeric in D22214 / R22214C4: got 'n.a.'
## Warning: Expecting numeric in D22215 / R22215C4: got 'n.a.'
## Warning: Expecting numeric in D22216 / R22216C4: got 'n.a.'
## Warning: Expecting numeric in D22217 / R22217C4: got 'n.a.'
## Warning: Expecting numeric in D22218 / R22218C4: got 'n.a.'
## Warning: Expecting numeric in D22219 / R22219C4: got 'n.a.'
## Warning: Expecting numeric in D22220 / R22220C4: got 'n.a.'
## Warning: Expecting numeric in D22221 / R22221C4: got 'n.a.'
## Warning: Expecting numeric in D22222 / R22222C4: got 'n.a.'
## Warning: Expecting numeric in D22223 / R22223C4: got 'n.a.'
## Warning: Expecting numeric in D22224 / R22224C4: got 'n.a.'
## Warning: Expecting numeric in D22225 / R22225C4: got 'n.a.'
## Warning: Expecting numeric in D22226 / R22226C4: got 'n.a.'
## Warning: Expecting numeric in D22227 / R22227C4: got 'n.a.'
## Warning: Expecting numeric in D22228 / R22228C4: got 'n.a.'
## Warning: Expecting numeric in D22229 / R22229C4: got 'n.a.'
## Warning: Expecting numeric in D22230 / R22230C4: got 'n.a.'
## Warning: Expecting numeric in D22231 / R22231C4: got 'n.a.'
## Warning: Expecting numeric in D22232 / R22232C4: got 'n.a.'
## Warning: Expecting numeric in D22233 / R22233C4: got 'n.a.'
## Warning: Expecting numeric in D22234 / R22234C4: got 'n.a.'
## Warning: Expecting numeric in D22235 / R22235C4: got 'n.a.'
## Warning: Expecting numeric in D22236 / R22236C4: got 'n.a.'
## Warning: Expecting numeric in D22237 / R22237C4: got 'n.a.'
## Warning: Expecting numeric in D22238 / R22238C4: got 'n.a.'
## Warning: Expecting numeric in D22239 / R22239C4: got 'n.a.'
## Warning: Expecting numeric in D22240 / R22240C4: got 'n.a.'
## Warning: Expecting numeric in D22241 / R22241C4: got 'n.a.'
## Warning: Expecting numeric in D22242 / R22242C4: got 'n.a.'
## Warning: Expecting numeric in D22243 / R22243C4: got 'n.a.'
## Warning: Expecting numeric in D22244 / R22244C4: got 'n.a.'
## Warning: Expecting numeric in D22245 / R22245C4: got 'n.a.'
## Warning: Expecting numeric in D22246 / R22246C4: got 'n.a.'
## Warning: Expecting numeric in D22247 / R22247C4: got 'n.a.'
## Warning: Expecting numeric in D22248 / R22248C4: got 'n.a.'
## Warning: Expecting numeric in D22249 / R22249C4: got 'n.a.'
## Warning: Expecting numeric in D22250 / R22250C4: got 'n.a.'
## Warning: Expecting numeric in D22251 / R22251C4: got 'n.a.'
## Warning: Expecting numeric in D22252 / R22252C4: got 'n.a.'
## Warning: Expecting numeric in D22253 / R22253C4: got 'n.a.'
## Warning: Expecting numeric in D22254 / R22254C4: got 'n.a.'
## Warning: Expecting numeric in D22255 / R22255C4: got 'n.a.'
## Warning: Expecting numeric in D22256 / R22256C4: got 'n.a.'
## Warning: Expecting numeric in D22257 / R22257C4: got 'n.a.'
## Warning: Expecting numeric in D22258 / R22258C4: got 'n.a.'
## Warning: Expecting numeric in D22259 / R22259C4: got 'n.a.'
## Warning: Expecting numeric in D22260 / R22260C4: got 'n.a.'
## Warning: Expecting numeric in D22261 / R22261C4: got 'n.a.'
## Warning: Expecting numeric in D22262 / R22262C4: got 'n.a.'
## Warning: Expecting numeric in D22263 / R22263C4: got 'n.a.'
## Warning: Expecting numeric in D22264 / R22264C4: got 'n.a.'
## Warning: Expecting numeric in D22265 / R22265C4: got 'n.a.'
## Warning: Expecting numeric in D22266 / R22266C4: got 'n.a.'
## Warning: Expecting numeric in D22267 / R22267C4: got 'n.a.'
## Warning: Expecting numeric in D22268 / R22268C4: got 'n.a.'
## Warning: Expecting numeric in D22269 / R22269C4: got 'n.a.'
## Warning: Expecting numeric in D22270 / R22270C4: got 'n.a.'
## Warning: Expecting numeric in D22271 / R22271C4: got 'n.a.'
## Warning: Expecting numeric in D22272 / R22272C4: got 'n.a.'
## Warning: Expecting numeric in D22273 / R22273C4: got 'n.a.'
## Warning: Expecting numeric in D22274 / R22274C4: got 'n.a.'
## Warning: Expecting numeric in D22275 / R22275C4: got 'n.a.'
## Warning: Expecting numeric in D22276 / R22276C4: got 'n.a.'
## Warning: Expecting numeric in D22277 / R22277C4: got 'n.a.'
## Warning: Expecting numeric in D22278 / R22278C4: got 'n.a.'
## Warning: Expecting numeric in D22279 / R22279C4: got 'n.a.'
## Warning: Expecting numeric in D22280 / R22280C4: got 'n.a.'
## Warning: Expecting numeric in D22281 / R22281C4: got 'n.a.'
## Warning: Expecting numeric in D22282 / R22282C4: got 'n.a.'
## Warning: Expecting numeric in D22283 / R22283C4: got 'n.a.'
## Warning: Expecting numeric in D22284 / R22284C4: got 'n.a.'
## Warning: Expecting numeric in D22285 / R22285C4: got 'n.a.'
## Warning: Expecting numeric in D22286 / R22286C4: got 'n.a.'
## Warning: Expecting numeric in D22287 / R22287C4: got 'n.a.'
## Warning: Expecting numeric in D22288 / R22288C4: got 'n.a.'
## Warning: Expecting numeric in D22289 / R22289C4: got 'n.a.'
## Warning: Expecting numeric in D22290 / R22290C4: got 'n.a.'
## Warning: Expecting numeric in D22291 / R22291C4: got 'n.a.'
## Warning: Expecting numeric in D22292 / R22292C4: got 'n.a.'
## Warning: Expecting numeric in D22293 / R22293C4: got 'n.a.'
## Warning: Expecting numeric in D22294 / R22294C4: got 'n.a.'
## Warning: Expecting numeric in D22295 / R22295C4: got 'n.a.'
## Warning: Expecting numeric in D22296 / R22296C4: got 'n.a.'
## Warning: Expecting numeric in D22297 / R22297C4: got 'n.a.'
## Warning: Expecting numeric in D22298 / R22298C4: got 'n.a.'
## Warning: Expecting numeric in D22299 / R22299C4: got 'n.a.'
## Warning: Expecting numeric in D22300 / R22300C4: got 'n.a.'
## Warning: Expecting numeric in D22301 / R22301C4: got 'n.a.'
## Warning: Expecting numeric in D22302 / R22302C4: got 'n.a.'
## Warning: Expecting numeric in D22303 / R22303C4: got 'n.a.'
## Warning: Expecting numeric in D22304 / R22304C4: got 'n.a.'
## Warning: Expecting numeric in D22305 / R22305C4: got 'n.a.'
## Warning: Expecting numeric in D22306 / R22306C4: got 'n.a.'
## Warning: Expecting numeric in D22307 / R22307C4: got 'n.a.'
## Warning: Expecting numeric in D22308 / R22308C4: got 'n.a.'
## Warning: Expecting numeric in D22309 / R22309C4: got 'n.a.'
## Warning: Expecting numeric in D22310 / R22310C4: got 'n.a.'
## Warning: Expecting numeric in D22311 / R22311C4: got 'n.a.'
## Warning: Expecting numeric in D22312 / R22312C4: got 'n.a.'
## Warning: Expecting numeric in D22313 / R22313C4: got 'n.a.'
## Warning: Expecting numeric in D22314 / R22314C4: got 'n.a.'
## Warning: Expecting numeric in D22315 / R22315C4: got 'n.a.'
## Warning: Expecting numeric in D22316 / R22316C4: got 'n.a.'
## Warning: Expecting numeric in D22317 / R22317C4: got 'n.a.'
## Warning: Expecting numeric in D22318 / R22318C4: got 'n.a.'
## Warning: Expecting numeric in D22319 / R22319C4: got 'n.a.'
## Warning: Expecting numeric in D22320 / R22320C4: got 'n.a.'
## Warning: Expecting numeric in D22321 / R22321C4: got 'n.a.'
## Warning: Expecting numeric in D22322 / R22322C4: got 'n.a.'
## Warning: Expecting numeric in D22323 / R22323C4: got 'n.a.'
## Warning: Expecting numeric in D22324 / R22324C4: got 'n.a.'
## Warning: Expecting numeric in D22325 / R22325C4: got 'n.a.'
## Warning: Expecting numeric in D22326 / R22326C4: got 'n.a.'
## Warning: Expecting numeric in D22327 / R22327C4: got 'n.a.'
## Warning: Expecting numeric in D22328 / R22328C4: got 'n.a.'
## Warning: Expecting numeric in D22329 / R22329C4: got 'n.a.'
## Warning: Expecting numeric in D22330 / R22330C4: got 'n.a.'
## Warning: Expecting numeric in D22331 / R22331C4: got 'n.a.'
## Warning: Expecting numeric in D22332 / R22332C4: got 'n.a.'
## Warning: Expecting numeric in D22333 / R22333C4: got 'n.a.'
## Warning: Expecting numeric in D22334 / R22334C4: got 'n.a.'
## Warning: Expecting numeric in D22335 / R22335C4: got 'n.a.'
## Warning: Expecting numeric in D22336 / R22336C4: got 'n.a.'
## Warning: Expecting numeric in D22337 / R22337C4: got 'n.a.'
## Warning: Expecting numeric in D22338 / R22338C4: got 'n.a.'
## Warning: Expecting numeric in D22339 / R22339C4: got 'n.a.'
## Warning: Expecting numeric in D22340 / R22340C4: got 'n.a.'
## Warning: Expecting numeric in D22341 / R22341C4: got 'n.a.'
## Warning: Expecting numeric in D22342 / R22342C4: got 'n.a.'
## Warning: Expecting numeric in D22343 / R22343C4: got 'n.a.'
## Warning: Expecting numeric in D22344 / R22344C4: got 'n.a.'
## Warning: Expecting numeric in D22345 / R22345C4: got 'n.a.'
## Warning: Expecting numeric in D22346 / R22346C4: got 'n.a.'
## Warning: Expecting numeric in D22347 / R22347C4: got 'n.a.'
## Warning: Expecting numeric in D22348 / R22348C4: got 'n.a.'
## Warning: Expecting numeric in D22349 / R22349C4: got 'n.a.'
## Warning: Expecting numeric in D22350 / R22350C4: got 'n.a.'
## Warning: Expecting numeric in D22351 / R22351C4: got 'n.a.'
## Warning: Expecting numeric in D22352 / R22352C4: got 'n.a.'
## Warning: Expecting numeric in D22353 / R22353C4: got 'n.a.'
## Warning: Expecting numeric in D22354 / R22354C4: got 'n.a.'
## Warning: Expecting numeric in D22355 / R22355C4: got 'n.a.'
## Warning: Expecting numeric in D22356 / R22356C4: got 'n.a.'
## Warning: Expecting numeric in D22357 / R22357C4: got 'n.a.'
## Warning: Expecting numeric in D22358 / R22358C4: got 'n.a.'
## Warning: Expecting numeric in D22359 / R22359C4: got 'n.a.'
## Warning: Expecting numeric in D22360 / R22360C4: got 'n.a.'
## Warning: Expecting numeric in D22361 / R22361C4: got 'n.a.'
## Warning: Expecting numeric in D22362 / R22362C4: got 'n.a.'
## Warning: Expecting numeric in D22363 / R22363C4: got 'n.a.'
## Warning: Expecting numeric in D22364 / R22364C4: got 'n.a.'
## Warning: Expecting numeric in D22365 / R22365C4: got 'n.a.'
## Warning: Expecting numeric in D22366 / R22366C4: got 'n.a.'
## Warning: Expecting numeric in D22367 / R22367C4: got 'n.a.'
## Warning: Expecting numeric in D22368 / R22368C4: got 'n.a.'
## Warning: Expecting numeric in D22369 / R22369C4: got 'n.a.'
## Warning: Expecting numeric in D22370 / R22370C4: got 'n.a.'
## Warning: Expecting numeric in D22371 / R22371C4: got 'n.a.'
## Warning: Expecting numeric in D22372 / R22372C4: got 'n.a.'
## Warning: Expecting numeric in D22373 / R22373C4: got 'n.a.'
## Warning: Expecting numeric in D22374 / R22374C4: got 'n.a.'
## Warning: Expecting numeric in D22375 / R22375C4: got 'n.a.'
## Warning: Expecting numeric in D22376 / R22376C4: got 'n.a.'
## Warning: Expecting numeric in D22377 / R22377C4: got 'n.a.'
## Warning: Expecting numeric in D22378 / R22378C4: got 'n.a.'
## Warning: Expecting numeric in D22379 / R22379C4: got 'n.a.'
## Warning: Expecting numeric in D22380 / R22380C4: got 'n.a.'
## Warning: Expecting numeric in D22381 / R22381C4: got 'n.a.'
## Warning: Expecting numeric in D22382 / R22382C4: got 'n.a.'
## Warning: Expecting numeric in D22383 / R22383C4: got 'n.a.'
## Warning: Expecting numeric in D22384 / R22384C4: got 'n.a.'
## Warning: Expecting numeric in D22385 / R22385C4: got 'n.a.'
## Warning: Expecting numeric in D22386 / R22386C4: got 'n.a.'
## Warning: Expecting numeric in D22387 / R22387C4: got 'n.a.'
## Warning: Expecting numeric in D22388 / R22388C4: got 'n.a.'
## Warning: Expecting numeric in D22389 / R22389C4: got 'n.a.'
## Warning: Expecting numeric in D22390 / R22390C4: got 'n.a.'
## Warning: Expecting numeric in D22391 / R22391C4: got 'n.a.'
## Warning: Expecting numeric in D22392 / R22392C4: got 'n.a.'
## Warning: Expecting numeric in D22393 / R22393C4: got 'n.a.'
## Warning: Expecting numeric in D22394 / R22394C4: got 'n.a.'
## Warning: Expecting numeric in D22395 / R22395C4: got 'n.a.'
## Warning: Expecting numeric in D22396 / R22396C4: got 'n.a.'
## Warning: Expecting numeric in D22397 / R22397C4: got 'n.a.'
## Warning: Expecting numeric in D22398 / R22398C4: got 'n.a.'
## Warning: Expecting numeric in D22399 / R22399C4: got 'n.a.'
## Warning: Expecting numeric in D22400 / R22400C4: got 'n.a.'
## Warning: Expecting numeric in D22401 / R22401C4: got 'n.a.'
## Warning: Expecting numeric in D22402 / R22402C4: got 'n.a.'
## Warning: Expecting numeric in D22403 / R22403C4: got 'n.a.'
## Warning: Expecting numeric in D22404 / R22404C4: got 'n.a.'
## Warning: Expecting numeric in D22405 / R22405C4: got 'n.a.'
## Warning: Expecting numeric in D22406 / R22406C4: got 'n.a.'
## Warning: Expecting numeric in D22407 / R22407C4: got 'n.a.'
## Warning: Expecting numeric in D22408 / R22408C4: got 'n.a.'
## Warning: Expecting numeric in D22409 / R22409C4: got 'n.a.'
## Warning: Expecting numeric in D22410 / R22410C4: got 'n.a.'
## Warning: Expecting numeric in D22411 / R22411C4: got 'n.a.'
## Warning: Expecting numeric in D22412 / R22412C4: got 'n.a.'
## Warning: Expecting numeric in D22413 / R22413C4: got 'n.a.'
## Warning: Expecting numeric in D22414 / R22414C4: got 'n.a.'
## Warning: Expecting numeric in D22415 / R22415C4: got 'n.a.'
## Warning: Expecting numeric in D22416 / R22416C4: got 'n.a.'
## Warning: Expecting numeric in D22417 / R22417C4: got 'n.a.'
## Warning: Expecting numeric in D22418 / R22418C4: got 'n.a.'
## Warning: Expecting numeric in D22419 / R22419C4: got 'n.a.'
## Warning: Expecting numeric in D22420 / R22420C4: got 'n.a.'
## Warning: Expecting numeric in D22421 / R22421C4: got 'n.a.'
## Warning: Expecting numeric in D22422 / R22422C4: got 'n.a.'
## Warning: Expecting numeric in D22423 / R22423C4: got 'n.a.'
## Warning: Expecting numeric in D22424 / R22424C4: got 'n.a.'
## Warning: Expecting numeric in D22425 / R22425C4: got 'n.a.'
## Warning: Expecting numeric in D22426 / R22426C4: got 'n.a.'
## Warning: Expecting numeric in D22427 / R22427C4: got 'n.a.'
## Warning: Expecting numeric in D22428 / R22428C4: got 'n.a.'
## Warning: Expecting numeric in D22429 / R22429C4: got 'n.a.'
## Warning: Expecting numeric in D22430 / R22430C4: got 'n.a.'
## Warning: Expecting numeric in D22431 / R22431C4: got 'n.a.'
## Warning: Expecting numeric in D22432 / R22432C4: got 'n.a.'
## Warning: Expecting numeric in D22433 / R22433C4: got 'n.a.'
## Warning: Expecting numeric in D22434 / R22434C4: got 'n.a.'
## Warning: Expecting numeric in D22435 / R22435C4: got 'n.a.'
## Warning: Expecting numeric in D22436 / R22436C4: got 'n.a.'
## Warning: Expecting numeric in D22437 / R22437C4: got 'n.a.'
## Warning: Expecting numeric in D22438 / R22438C4: got 'n.a.'
## Warning: Expecting numeric in D22439 / R22439C4: got 'n.a.'
## Warning: Expecting numeric in D22440 / R22440C4: got 'n.a.'
## Warning: Expecting numeric in D22441 / R22441C4: got 'n.a.'
## Warning: Expecting numeric in D22442 / R22442C4: got 'n.a.'
## Warning: Expecting numeric in D22443 / R22443C4: got 'n.a.'
## Warning: Expecting numeric in D22444 / R22444C4: got 'n.a.'
## Warning: Expecting numeric in D22445 / R22445C4: got 'n.a.'
## Warning: Expecting numeric in D22446 / R22446C4: got 'n.a.'
## Warning: Expecting numeric in D22447 / R22447C4: got 'n.a.'
## Warning: Expecting numeric in D22448 / R22448C4: got 'n.a.'
## Warning: Expecting numeric in D22449 / R22449C4: got 'n.a.'
## Warning: Expecting numeric in D22450 / R22450C4: got 'n.a.'
## Warning: Expecting numeric in D22451 / R22451C4: got 'n.a.'
## Warning: Expecting numeric in D22452 / R22452C4: got 'n.a.'
## Warning: Expecting numeric in D22453 / R22453C4: got 'n.a.'
## Warning: Expecting numeric in D22454 / R22454C4: got 'n.a.'
## Warning: Expecting numeric in D22455 / R22455C4: got 'n.a.'
## Warning: Expecting numeric in D22456 / R22456C4: got 'n.a.'
## Warning: Expecting numeric in D22457 / R22457C4: got 'n.a.'
## Warning: Expecting numeric in D22458 / R22458C4: got 'n.a.'
## Warning: Expecting numeric in D22459 / R22459C4: got 'n.a.'
## Warning: Expecting numeric in D22460 / R22460C4: got 'n.a.'
## Warning: Expecting numeric in D22461 / R22461C4: got 'n.a.'
## Warning: Expecting numeric in D22462 / R22462C4: got 'n.a.'
## Warning: Expecting numeric in D22463 / R22463C4: got 'n.a.'
## Warning: Expecting numeric in D22464 / R22464C4: got 'n.a.'
## Warning: Expecting numeric in D22465 / R22465C4: got 'n.a.'
## Warning: Expecting numeric in D22466 / R22466C4: got 'n.a.'
## Warning: Expecting numeric in D22467 / R22467C4: got 'n.a.'
## Warning: Expecting numeric in D22468 / R22468C4: got 'n.a.'
## Warning: Expecting numeric in D22469 / R22469C4: got 'n.a.'
## Warning: Expecting numeric in D22470 / R22470C4: got 'n.a.'
## Warning: Expecting numeric in D22471 / R22471C4: got 'n.a.'
## Warning: Expecting numeric in D22472 / R22472C4: got 'n.a.'
## Warning: Expecting numeric in D22473 / R22473C4: got 'n.a.'
## Warning: Expecting numeric in D22474 / R22474C4: got 'n.a.'
## Warning: Expecting numeric in D22475 / R22475C4: got 'n.a.'
## Warning: Expecting numeric in D22476 / R22476C4: got 'n.a.'
## Warning: Expecting numeric in D22477 / R22477C4: got 'n.a.'
## Warning: Expecting numeric in D22478 / R22478C4: got 'n.a.'
## Warning: Expecting numeric in D22479 / R22479C4: got 'n.a.'
## Warning: Expecting numeric in D22480 / R22480C4: got 'n.a.'
## Warning: Expecting numeric in D22481 / R22481C4: got 'n.a.'
## Warning: Expecting numeric in D22482 / R22482C4: got 'n.a.'
## Warning: Expecting numeric in D22483 / R22483C4: got 'n.a.'
## Warning: Expecting numeric in D22484 / R22484C4: got 'n.a.'
## Warning: Expecting numeric in D22485 / R22485C4: got 'n.a.'
## Warning: Expecting numeric in D22486 / R22486C4: got 'n.a.'
## Warning: Expecting numeric in D22487 / R22487C4: got 'n.a.'
## Warning: Expecting numeric in D22488 / R22488C4: got 'n.a.'
## Warning: Expecting numeric in D22489 / R22489C4: got 'n.a.'
## Warning: Expecting numeric in D22490 / R22490C4: got 'n.a.'
## Warning: Expecting numeric in D22491 / R22491C4: got 'n.a.'
## Warning: Expecting numeric in D22492 / R22492C4: got 'n.a.'
## Warning: Expecting numeric in D22493 / R22493C4: got 'n.a.'
## Warning: Expecting numeric in D22494 / R22494C4: got 'n.a.'
## Warning: Expecting numeric in D22495 / R22495C4: got 'n.a.'
## Warning: Expecting numeric in D22496 / R22496C4: got 'n.a.'
## Warning: Expecting numeric in D22497 / R22497C4: got 'n.a.'
## Warning: Expecting numeric in D22498 / R22498C4: got 'n.a.'
## Warning: Expecting numeric in D22499 / R22499C4: got 'n.a.'
## Warning: Expecting numeric in D22500 / R22500C4: got 'n.a.'
## Warning: Expecting numeric in D22501 / R22501C4: got 'n.a.'
## Warning: Expecting numeric in D22502 / R22502C4: got 'n.a.'
## Warning: Expecting numeric in D22503 / R22503C4: got 'n.a.'
## Warning: Expecting numeric in D22504 / R22504C4: got 'n.a.'
## Warning: Expecting numeric in D22505 / R22505C4: got 'n.a.'
## Warning: Expecting numeric in D22506 / R22506C4: got 'n.a.'
## Warning: Expecting numeric in D22507 / R22507C4: got 'n.a.'
## Warning: Expecting numeric in D22508 / R22508C4: got 'n.a.'
## Warning: Expecting numeric in D22509 / R22509C4: got 'n.a.'
## Warning: Expecting numeric in D22510 / R22510C4: got 'n.a.'
## Warning: Expecting numeric in D22511 / R22511C4: got 'n.a.'
## Warning: Expecting numeric in D22512 / R22512C4: got 'n.a.'
## Warning: Expecting numeric in D22513 / R22513C4: got 'n.a.'
## Warning: Expecting numeric in D22514 / R22514C4: got 'n.a.'
## Warning: Expecting numeric in D22515 / R22515C4: got 'n.a.'
## Warning: Expecting numeric in D22516 / R22516C4: got 'n.a.'
## Warning: Expecting numeric in D22517 / R22517C4: got 'n.a.'
## Warning: Expecting numeric in D22518 / R22518C4: got 'n.a.'
## Warning: Expecting numeric in D22519 / R22519C4: got 'n.a.'
## Warning: Expecting numeric in D22520 / R22520C4: got 'n.a.'
## Warning: Expecting numeric in D22521 / R22521C4: got 'n.a.'
## Warning: Expecting numeric in D22522 / R22522C4: got 'n.a.'
## Warning: Expecting numeric in D22523 / R22523C4: got 'n.a.'
## Warning: Expecting numeric in D22524 / R22524C4: got 'n.a.'
## Warning: Expecting numeric in D22525 / R22525C4: got 'n.a.'
## Warning: Expecting numeric in D22526 / R22526C4: got 'n.a.'
## Warning: Expecting numeric in D22527 / R22527C4: got 'n.a.'
## Warning: Expecting numeric in D22528 / R22528C4: got 'n.a.'
## Warning: Expecting numeric in D22529 / R22529C4: got 'n.a.'
## Warning: Expecting numeric in D22530 / R22530C4: got 'n.a.'
## Warning: Expecting numeric in D22531 / R22531C4: got 'n.a.'
## Warning: Expecting numeric in D22532 / R22532C4: got 'n.a.'
## Warning: Expecting numeric in D22533 / R22533C4: got 'n.a.'
## Warning: Expecting numeric in D22534 / R22534C4: got 'n.a.'
## Warning: Expecting numeric in D22535 / R22535C4: got 'n.a.'
## Warning: Expecting numeric in D22536 / R22536C4: got 'n.a.'
## Warning: Expecting numeric in D22537 / R22537C4: got 'n.a.'
## Warning: Expecting numeric in D22538 / R22538C4: got 'n.a.'
## Warning: Expecting numeric in D22539 / R22539C4: got 'n.a.'
## Warning: Expecting numeric in D22540 / R22540C4: got 'n.a.'
## Warning: Expecting numeric in D22541 / R22541C4: got 'n.a.'
## Warning: Expecting numeric in D22542 / R22542C4: got 'n.a.'
## Warning: Expecting numeric in D22543 / R22543C4: got 'n.a.'
## Warning: Expecting numeric in D22544 / R22544C4: got 'n.a.'
## Warning: Expecting numeric in D22545 / R22545C4: got 'n.a.'
## Warning: Expecting numeric in D22546 / R22546C4: got 'n.a.'
## Warning: Expecting numeric in D22547 / R22547C4: got 'n.a.'
## Warning: Expecting numeric in D22548 / R22548C4: got 'n.a.'
## Warning: Expecting numeric in D22549 / R22549C4: got 'n.a.'
## Warning: Expecting numeric in D22550 / R22550C4: got 'n.a.'
## Warning: Expecting numeric in D22551 / R22551C4: got 'n.a.'
## Warning: Expecting numeric in D22552 / R22552C4: got 'n.a.'
## Warning: Expecting numeric in D22553 / R22553C4: got 'n.a.'
## Warning: Expecting numeric in D22554 / R22554C4: got 'n.a.'
## Warning: Expecting numeric in D22555 / R22555C4: got 'n.a.'
## Warning: Expecting numeric in D22556 / R22556C4: got 'n.a.'
## Warning: Expecting numeric in D22557 / R22557C4: got 'n.a.'
## Warning: Expecting numeric in D22558 / R22558C4: got 'n.a.'
## Warning: Expecting numeric in D22559 / R22559C4: got 'n.a.'
## Warning: Expecting numeric in D22560 / R22560C4: got 'n.a.'
## Warning: Expecting numeric in D22561 / R22561C4: got 'n.a.'
## Warning: Expecting numeric in D22562 / R22562C4: got 'n.a.'
## Warning: Expecting numeric in D22563 / R22563C4: got 'n.a.'
## Warning: Expecting numeric in D22564 / R22564C4: got 'n.a.'
## Warning: Expecting numeric in D22565 / R22565C4: got 'n.a.'
## Warning: Expecting numeric in D22566 / R22566C4: got 'n.a.'
## Warning: Expecting numeric in D22567 / R22567C4: got 'n.a.'
## Warning: Expecting numeric in D22568 / R22568C4: got 'n.a.'
## Warning: Expecting numeric in D22569 / R22569C4: got 'n.a.'
## Warning: Expecting numeric in D22570 / R22570C4: got 'n.a.'
## Warning: Expecting numeric in D22571 / R22571C4: got 'n.a.'
## Warning: Expecting numeric in D22572 / R22572C4: got 'n.a.'
## Warning: Expecting numeric in D22573 / R22573C4: got 'n.a.'
## Warning: Expecting numeric in D22574 / R22574C4: got 'n.a.'
## Warning: Expecting numeric in D22575 / R22575C4: got 'n.a.'
## Warning: Expecting numeric in D22576 / R22576C4: got 'n.a.'
## Warning: Expecting numeric in D22577 / R22577C4: got 'n.a.'
## Warning: Expecting numeric in D22578 / R22578C4: got 'n.a.'
## Warning: Expecting numeric in D22579 / R22579C4: got 'n.a.'
## Warning: Expecting numeric in D22580 / R22580C4: got 'n.a.'
## Warning: Expecting numeric in D22581 / R22581C4: got 'n.a.'
## Warning: Expecting numeric in D22582 / R22582C4: got 'n.a.'
## Warning: Expecting numeric in D22583 / R22583C4: got 'n.a.'
## Warning: Expecting numeric in D22584 / R22584C4: got 'n.a.'
## Warning: Expecting numeric in D22585 / R22585C4: got 'n.a.'
## Warning: Expecting numeric in D22586 / R22586C4: got 'n.a.'
## Warning: Expecting numeric in D22587 / R22587C4: got 'n.a.'
## Warning: Expecting numeric in D22588 / R22588C4: got 'n.a.'
## Warning: Expecting numeric in D22589 / R22589C4: got 'n.a.'
## Warning: Expecting numeric in D22590 / R22590C4: got 'n.a.'
## Warning: Expecting numeric in D22591 / R22591C4: got 'n.a.'
## Warning: Expecting numeric in D22592 / R22592C4: got 'n.a.'
## Warning: Expecting numeric in D22593 / R22593C4: got 'n.a.'
## Warning: Expecting numeric in D22594 / R22594C4: got 'n.a.'
## Warning: Expecting numeric in D22595 / R22595C4: got 'n.a.'
## Warning: Expecting numeric in D22596 / R22596C4: got 'n.a.'
## Warning: Expecting numeric in D22597 / R22597C4: got 'n.a.'
## Warning: Expecting numeric in D22598 / R22598C4: got 'n.a.'
## Warning: Expecting numeric in D22599 / R22599C4: got 'n.a.'
## Warning: Expecting numeric in D22600 / R22600C4: got 'n.a.'
## Warning: Expecting numeric in D22601 / R22601C4: got 'n.a.'
## Warning: Expecting numeric in D22602 / R22602C4: got 'n.a.'
## Warning: Expecting numeric in D22603 / R22603C4: got 'n.a.'
## Warning: Expecting numeric in D22604 / R22604C4: got 'n.a.'
## Warning: Expecting numeric in D22605 / R22605C4: got 'n.a.'
## Warning: Expecting numeric in D22606 / R22606C4: got 'n.a.'
## Warning: Expecting numeric in D22607 / R22607C4: got 'n.a.'
## Warning: Expecting numeric in D22608 / R22608C4: got 'n.a.'
## Warning: Expecting numeric in D22609 / R22609C4: got 'n.a.'
## Warning: Expecting numeric in D22610 / R22610C4: got 'n.a.'
## Warning: Expecting numeric in D22611 / R22611C4: got 'n.a.'
## Warning: Expecting numeric in D22612 / R22612C4: got 'n.a.'
## Warning: Expecting numeric in D22613 / R22613C4: got 'n.a.'
## Warning: Expecting numeric in D22614 / R22614C4: got 'n.a.'
## Warning: Expecting numeric in D22615 / R22615C4: got 'n.a.'
## Warning: Expecting numeric in D22616 / R22616C4: got 'n.a.'
## Warning: Expecting numeric in D22617 / R22617C4: got 'n.a.'
## Warning: Expecting numeric in D22618 / R22618C4: got 'n.a.'
## Warning: Expecting numeric in D22619 / R22619C4: got 'n.a.'
## Warning: Expecting numeric in D22620 / R22620C4: got 'n.a.'
## Warning: Expecting numeric in D22621 / R22621C4: got 'n.a.'
## Warning: Expecting numeric in D22622 / R22622C4: got 'n.a.'
## Warning: Expecting numeric in D22623 / R22623C4: got 'n.a.'
## Warning: Expecting numeric in D22624 / R22624C4: got 'n.a.'
## Warning: Expecting numeric in D22625 / R22625C4: got 'n.a.'
## Warning: Expecting numeric in D22626 / R22626C4: got 'n.a.'
## Warning: Expecting numeric in D22627 / R22627C4: got 'n.a.'
## Warning: Expecting numeric in D22628 / R22628C4: got 'n.a.'
## Warning: Expecting numeric in D22629 / R22629C4: got 'n.a.'
## Warning: Expecting numeric in D22630 / R22630C4: got 'n.a.'
## Warning: Expecting numeric in D22631 / R22631C4: got 'n.a.'
## Warning: Expecting numeric in D22632 / R22632C4: got 'n.a.'
## Warning: Expecting numeric in D22633 / R22633C4: got 'n.a.'
## Warning: Expecting numeric in D22634 / R22634C4: got 'n.a.'
## Warning: Expecting numeric in D22635 / R22635C4: got 'n.a.'
## Warning: Expecting numeric in D22636 / R22636C4: got 'n.a.'
## Warning: Expecting numeric in D22637 / R22637C4: got 'n.a.'
## Warning: Expecting numeric in D22638 / R22638C4: got 'n.a.'
## Warning: Expecting numeric in D22639 / R22639C4: got 'n.a.'
## Warning: Expecting numeric in D22640 / R22640C4: got 'n.a.'
## Warning: Expecting numeric in D22641 / R22641C4: got 'n.a.'
## Warning: Expecting numeric in D22642 / R22642C4: got 'n.a.'
## Warning: Expecting numeric in D22643 / R22643C4: got 'n.a.'
## Warning: Expecting numeric in D22644 / R22644C4: got 'n.a.'
## Warning: Expecting numeric in D22645 / R22645C4: got 'n.a.'
## Warning: Expecting numeric in D22646 / R22646C4: got 'n.a.'
## Warning: Expecting numeric in D22647 / R22647C4: got 'n.a.'
## Warning: Expecting numeric in D22648 / R22648C4: got 'n.a.'
## Warning: Expecting numeric in D22649 / R22649C4: got 'n.a.'
## Warning: Expecting numeric in D22650 / R22650C4: got 'n.a.'
## Warning: Expecting numeric in D22651 / R22651C4: got 'n.a.'
## Warning: Expecting numeric in D22652 / R22652C4: got 'n.a.'
## Warning: Expecting numeric in D22653 / R22653C4: got 'n.a.'
## Warning: Expecting numeric in D22654 / R22654C4: got 'n.a.'
## Warning: Expecting numeric in D22655 / R22655C4: got 'n.a.'
## Warning: Expecting numeric in D22656 / R22656C4: got 'n.a.'
## Warning: Expecting numeric in D22657 / R22657C4: got 'n.a.'
## Warning: Expecting numeric in D22658 / R22658C4: got 'n.a.'
## Warning: Expecting numeric in D22659 / R22659C4: got 'n.a.'
## Warning: Expecting numeric in D22660 / R22660C4: got 'n.a.'
## Warning: Expecting numeric in D22661 / R22661C4: got 'n.a.'
## Warning: Expecting numeric in D22662 / R22662C4: got 'n.a.'
## Warning: Expecting numeric in D22663 / R22663C4: got 'n.a.'
## Warning: Expecting numeric in D22664 / R22664C4: got 'n.a.'
## Warning: Expecting numeric in D22665 / R22665C4: got 'n.a.'
## Warning: Expecting numeric in D22666 / R22666C4: got 'n.a.'
## Warning: Expecting numeric in D22667 / R22667C4: got 'n.a.'
## Warning: Expecting numeric in D22668 / R22668C4: got 'n.a.'
## Warning: Expecting numeric in D22669 / R22669C4: got 'n.a.'
## Warning: Expecting numeric in D22670 / R22670C4: got 'n.a.'
## Warning: Expecting numeric in D22671 / R22671C4: got 'n.a.'
## Warning: Expecting numeric in D22672 / R22672C4: got 'n.a.'
## Warning: Expecting numeric in D22673 / R22673C4: got 'n.a.'
## Warning: Expecting numeric in D22674 / R22674C4: got 'n.a.'
## Warning: Expecting numeric in D22675 / R22675C4: got 'n.a.'
## Warning: Expecting numeric in D22676 / R22676C4: got 'n.a.'
## Warning: Expecting numeric in D22677 / R22677C4: got 'n.a.'
## Warning: Expecting numeric in D22678 / R22678C4: got 'n.a.'
## Warning: Expecting numeric in D22679 / R22679C4: got 'n.a.'
## Warning: Expecting numeric in D22680 / R22680C4: got 'n.a.'
## Warning: Expecting numeric in D22681 / R22681C4: got 'n.a.'
## Warning: Expecting numeric in D22682 / R22682C4: got 'n.a.'
## Warning: Expecting numeric in D22683 / R22683C4: got 'n.a.'
## Warning: Expecting numeric in D22684 / R22684C4: got 'n.a.'
## Warning: Expecting numeric in D22685 / R22685C4: got 'n.a.'
## Warning: Expecting numeric in D22686 / R22686C4: got 'n.a.'
## Warning: Expecting numeric in D22687 / R22687C4: got 'n.a.'
## Warning: Expecting numeric in D22688 / R22688C4: got 'n.a.'
## Warning: Expecting numeric in D22689 / R22689C4: got 'n.a.'
## Warning: Expecting numeric in D22690 / R22690C4: got 'n.a.'
## Warning: Expecting numeric in D22691 / R22691C4: got 'n.a.'
## Warning: Expecting numeric in D22692 / R22692C4: got 'n.a.'
## Warning: Expecting numeric in D22693 / R22693C4: got 'n.a.'
## Warning: Expecting numeric in D22694 / R22694C4: got 'n.a.'
## Warning: Expecting numeric in D22695 / R22695C4: got 'n.a.'
## Warning: Expecting numeric in D22696 / R22696C4: got 'n.a.'
## Warning: Expecting numeric in D22697 / R22697C4: got 'n.a.'
## Warning: Expecting numeric in D22698 / R22698C4: got 'n.a.'
## Warning: Expecting numeric in D22699 / R22699C4: got 'n.a.'
## Warning: Expecting numeric in D22700 / R22700C4: got 'n.a.'
## Warning: Expecting numeric in D22701 / R22701C4: got 'n.a.'
## Warning: Expecting numeric in D22702 / R22702C4: got 'n.a.'
## Warning: Expecting numeric in D22703 / R22703C4: got 'n.a.'
## Warning: Expecting numeric in D22704 / R22704C4: got 'n.a.'
## Warning: Expecting numeric in D22705 / R22705C4: got 'n.a.'
## Warning: Expecting numeric in D22706 / R22706C4: got 'n.a.'
## Warning: Expecting numeric in D22707 / R22707C4: got 'n.a.'
## Warning: Expecting numeric in D22708 / R22708C4: got 'n.a.'
## Warning: Expecting numeric in D22709 / R22709C4: got 'n.a.'
## Warning: Expecting numeric in D22710 / R22710C4: got 'n.a.'
## Warning: Expecting numeric in D22711 / R22711C4: got 'n.a.'
## Warning: Expecting numeric in D22712 / R22712C4: got 'n.a.'
## Warning: Expecting numeric in D22713 / R22713C4: got 'n.a.'
## Warning: Expecting numeric in D22714 / R22714C4: got 'n.a.'
## Warning: Expecting numeric in D22715 / R22715C4: got 'n.a.'
## Warning: Expecting numeric in D22716 / R22716C4: got 'n.a.'
## Warning: Expecting numeric in D22717 / R22717C4: got 'n.a.'
## Warning: Expecting numeric in D22718 / R22718C4: got 'n.a.'
## Warning: Expecting numeric in D22719 / R22719C4: got 'n.a.'
## Warning: Expecting numeric in D22720 / R22720C4: got 'n.a.'
## Warning: Expecting numeric in D22721 / R22721C4: got 'n.a.'
## Warning: Expecting numeric in D22722 / R22722C4: got 'n.a.'
## Warning: Expecting numeric in D22723 / R22723C4: got 'n.a.'
## Warning: Expecting numeric in D22724 / R22724C4: got 'n.a.'
## Warning: Expecting numeric in D22725 / R22725C4: got 'n.a.'
## Warning: Expecting numeric in D22726 / R22726C4: got 'n.a.'
## Warning: Expecting numeric in D22727 / R22727C4: got 'n.a.'
## Warning: Expecting numeric in D22728 / R22728C4: got 'n.a.'
## Warning: Expecting numeric in D22729 / R22729C4: got 'n.a.'
## Warning: Expecting numeric in D22730 / R22730C4: got 'n.a.'
## Warning: Expecting numeric in D22731 / R22731C4: got 'n.a.'
## Warning: Expecting numeric in D22732 / R22732C4: got 'n.a.'
## Warning: Expecting numeric in D22733 / R22733C4: got 'n.a.'
## Warning: Expecting numeric in D22734 / R22734C4: got 'n.a.'
## Warning: Expecting numeric in D22735 / R22735C4: got 'n.a.'
## Warning: Expecting numeric in D22736 / R22736C4: got 'n.a.'
## Warning: Expecting numeric in D22737 / R22737C4: got 'n.a.'
## Warning: Expecting numeric in D22738 / R22738C4: got 'n.a.'
## Warning: Expecting numeric in D22739 / R22739C4: got 'n.a.'
## Warning: Expecting numeric in D22740 / R22740C4: got 'n.a.'
## Warning: Expecting numeric in D22741 / R22741C4: got 'n.a.'
## Warning: Expecting numeric in D22742 / R22742C4: got 'n.a.'
## Warning: Expecting numeric in D22743 / R22743C4: got 'n.a.'
## Warning: Expecting numeric in D22744 / R22744C4: got 'n.a.'
## Warning: Expecting numeric in D22745 / R22745C4: got 'n.a.'
## Warning: Expecting numeric in D22746 / R22746C4: got 'n.a.'
## Warning: Expecting numeric in D22747 / R22747C4: got 'n.a.'
## Warning: Expecting numeric in D22748 / R22748C4: got 'n.a.'
## Warning: Expecting numeric in D22749 / R22749C4: got 'n.a.'
## Warning: Expecting numeric in D22750 / R22750C4: got 'n.a.'
## Warning: Expecting numeric in D22751 / R22751C4: got 'n.a.'
## Warning: Expecting numeric in D22752 / R22752C4: got 'n.a.'
## Warning: Expecting numeric in D22753 / R22753C4: got 'n.a.'
## Warning: Expecting numeric in D22754 / R22754C4: got 'n.a.'
## Warning: Expecting numeric in D22755 / R22755C4: got 'n.a.'
## Warning: Expecting numeric in D22756 / R22756C4: got 'n.a.'
## Warning: Expecting numeric in D22757 / R22757C4: got 'n.a.'
## Warning: Expecting numeric in D22758 / R22758C4: got 'n.a.'
## Warning: Expecting numeric in D22759 / R22759C4: got 'n.a.'
## Warning: Expecting numeric in D22760 / R22760C4: got 'n.a.'
## Warning: Expecting numeric in D22761 / R22761C4: got 'n.a.'
## Warning: Expecting numeric in D22762 / R22762C4: got 'n.a.'
## Warning: Expecting numeric in D22763 / R22763C4: got 'n.a.'
## Warning: Expecting numeric in D22764 / R22764C4: got 'n.a.'
## Warning: Expecting numeric in D22765 / R22765C4: got 'n.a.'
## Warning: Expecting numeric in D22766 / R22766C4: got 'n.a.'
## Warning: Expecting numeric in D22767 / R22767C4: got 'n.a.'
## Warning: Expecting numeric in D22768 / R22768C4: got 'n.a.'
## Warning: Expecting numeric in D22769 / R22769C4: got 'n.a.'
## Warning: Expecting numeric in D22770 / R22770C4: got 'n.a.'
## Warning: Expecting numeric in D22771 / R22771C4: got 'n.a.'
## Warning: Expecting numeric in D22772 / R22772C4: got 'n.a.'
## Warning: Expecting numeric in D22773 / R22773C4: got 'n.a.'
## Warning: Expecting numeric in D22774 / R22774C4: got 'n.a.'
## Warning: Expecting numeric in D22775 / R22775C4: got 'n.a.'
## Warning: Expecting numeric in D22776 / R22776C4: got 'n.a.'
## Warning: Expecting numeric in D22777 / R22777C4: got 'n.a.'
## Warning: Expecting numeric in D22778 / R22778C4: got 'n.a.'
## Warning: Expecting numeric in D22779 / R22779C4: got 'n.a.'
## Warning: Expecting numeric in D22780 / R22780C4: got 'n.a.'
## Warning: Expecting numeric in D22781 / R22781C4: got 'n.a.'
## Warning: Expecting numeric in D22782 / R22782C4: got 'n.a.'
## Warning: Expecting numeric in D22783 / R22783C4: got 'n.a.'
## Warning: Expecting numeric in D22784 / R22784C4: got 'n.a.'
## Warning: Expecting numeric in D22785 / R22785C4: got 'n.a.'
## Warning: Expecting numeric in D22786 / R22786C4: got 'n.a.'
## Warning: Expecting numeric in D22787 / R22787C4: got 'n.a.'
## Warning: Expecting numeric in D22788 / R22788C4: got 'n.a.'
## Warning: Expecting numeric in D22789 / R22789C4: got 'n.a.'
## Warning: Expecting numeric in D22790 / R22790C4: got 'n.a.'
## Warning: Expecting numeric in D22791 / R22791C4: got 'n.a.'
## Warning: Expecting numeric in D22792 / R22792C4: got 'n.a.'
## Warning: Expecting numeric in D22793 / R22793C4: got 'n.a.'
## Warning: Expecting numeric in D22794 / R22794C4: got 'n.a.'
## Warning: Expecting numeric in D22795 / R22795C4: got 'n.a.'
## Warning: Expecting numeric in D22796 / R22796C4: got 'n.a.'
## Warning: Expecting numeric in D22797 / R22797C4: got 'n.a.'
## Warning: Expecting numeric in D22798 / R22798C4: got 'n.a.'
## Warning: Expecting numeric in D22799 / R22799C4: got 'n.a.'
## Warning: Expecting numeric in D22800 / R22800C4: got 'n.a.'
## Warning: Expecting numeric in D22801 / R22801C4: got 'n.a.'
## Warning: Expecting numeric in D22802 / R22802C4: got 'n.a.'
## Warning: Expecting numeric in D22803 / R22803C4: got 'n.a.'
## Warning: Expecting numeric in D22804 / R22804C4: got 'n.a.'
## Warning: Expecting numeric in D22805 / R22805C4: got 'n.a.'
## Warning: Expecting numeric in D22806 / R22806C4: got 'n.a.'
## Warning: Expecting numeric in D22807 / R22807C4: got 'n.a.'
## Warning: Expecting numeric in D22808 / R22808C4: got 'n.a.'
## Warning: Expecting numeric in D22809 / R22809C4: got 'n.a.'
## Warning: Expecting numeric in D22810 / R22810C4: got 'n.a.'
## Warning: Expecting numeric in D22811 / R22811C4: got 'n.a.'
## Warning: Expecting numeric in D22812 / R22812C4: got 'n.a.'
## Warning: Expecting numeric in D22813 / R22813C4: got 'n.a.'
## Warning: Expecting numeric in D22814 / R22814C4: got 'n.a.'
## Warning: Expecting numeric in D22815 / R22815C4: got 'n.a.'
## Warning: Expecting numeric in D22816 / R22816C4: got 'n.a.'
## Warning: Expecting numeric in D22817 / R22817C4: got 'n.a.'
## Warning: Expecting numeric in D22818 / R22818C4: got 'n.a.'
## Warning: Expecting numeric in D22819 / R22819C4: got 'n.a.'
## Warning: Expecting numeric in D22820 / R22820C4: got 'n.a.'
## Warning: Expecting numeric in D22821 / R22821C4: got 'n.a.'
## Warning: Expecting numeric in D22822 / R22822C4: got 'n.a.'
## Warning: Expecting numeric in D22823 / R22823C4: got 'n.a.'
## Warning: Expecting numeric in D22824 / R22824C4: got 'n.a.'
## Warning: Expecting numeric in D22825 / R22825C4: got 'n.a.'
## Warning: Expecting numeric in D22826 / R22826C4: got 'n.a.'
## Warning: Expecting numeric in D22827 / R22827C4: got 'n.a.'
## Warning: Expecting numeric in D22828 / R22828C4: got 'n.a.'
## Warning: Expecting numeric in D22829 / R22829C4: got 'n.a.'
## Warning: Expecting numeric in D22830 / R22830C4: got 'n.a.'
## Warning: Expecting numeric in D22831 / R22831C4: got 'n.a.'
## Warning: Expecting numeric in D22832 / R22832C4: got 'n.a.'
## Warning: Expecting numeric in D22833 / R22833C4: got 'n.a.'
## Warning: Expecting numeric in D22834 / R22834C4: got 'n.a.'
## Warning: Expecting numeric in D22835 / R22835C4: got 'n.a.'
## Warning: Expecting numeric in D22836 / R22836C4: got 'n.a.'
## Warning: Expecting numeric in D22837 / R22837C4: got 'n.a.'
## Warning: Expecting numeric in D22838 / R22838C4: got 'n.a.'
## Warning: Expecting numeric in D22839 / R22839C4: got 'n.a.'
## Warning: Expecting numeric in D22840 / R22840C4: got 'n.a.'
## Warning: Expecting numeric in D22841 / R22841C4: got 'n.a.'
## Warning: Expecting numeric in D22842 / R22842C4: got 'n.a.'
## Warning: Expecting numeric in D22843 / R22843C4: got 'n.a.'
## Warning: Expecting numeric in D22844 / R22844C4: got 'n.a.'
## Warning: Expecting numeric in D22845 / R22845C4: got 'n.a.'
## Warning: Expecting numeric in D22846 / R22846C4: got 'n.a.'
## Warning: Expecting numeric in D22847 / R22847C4: got 'n.a.'
## Warning: Expecting numeric in D22848 / R22848C4: got 'n.a.'
## Warning: Expecting numeric in D22849 / R22849C4: got 'n.a.'
## Warning: Expecting numeric in D22850 / R22850C4: got 'n.a.'
## Warning: Expecting numeric in D22851 / R22851C4: got 'n.a.'
## Warning: Expecting numeric in D22852 / R22852C4: got 'n.a.'
## Warning: Expecting numeric in D22853 / R22853C4: got 'n.a.'
## Warning: Expecting numeric in D22854 / R22854C4: got 'n.a.'
## Warning: Expecting numeric in D22855 / R22855C4: got 'n.a.'
## Warning: Expecting numeric in D22856 / R22856C4: got 'n.a.'
## Warning: Expecting numeric in D22857 / R22857C4: got 'n.a.'
## Warning: Expecting numeric in D22858 / R22858C4: got 'n.a.'
## Warning: Expecting numeric in D22859 / R22859C4: got 'n.a.'
## Warning: Expecting numeric in D22860 / R22860C4: got 'n.a.'
## Warning: Expecting numeric in D22861 / R22861C4: got 'n.a.'
## Warning: Expecting numeric in D22862 / R22862C4: got 'n.a.'
## Warning: Expecting numeric in D22863 / R22863C4: got 'n.a.'
## Warning: Expecting numeric in D22864 / R22864C4: got 'n.a.'
## Warning: Expecting numeric in D22865 / R22865C4: got 'n.a.'
## Warning: Expecting numeric in D22866 / R22866C4: got 'n.a.'
## Warning: Expecting numeric in D22867 / R22867C4: got 'n.a.'
## Warning: Expecting numeric in D22868 / R22868C4: got 'n.a.'
## Warning: Expecting numeric in D22869 / R22869C4: got 'n.a.'
## Warning: Expecting numeric in D22870 / R22870C4: got 'n.a.'
## Warning: Expecting numeric in D22871 / R22871C4: got 'n.a.'
## Warning: Expecting numeric in D22872 / R22872C4: got 'n.a.'
## Warning: Expecting numeric in D22873 / R22873C4: got 'n.a.'
## Warning: Expecting numeric in D22874 / R22874C4: got 'n.a.'
## Warning: Expecting numeric in D22875 / R22875C4: got 'n.a.'
## Warning: Expecting numeric in D22876 / R22876C4: got 'n.a.'
## Warning: Expecting numeric in D22877 / R22877C4: got 'n.a.'
## Warning: Expecting numeric in D22878 / R22878C4: got 'n.a.'
## Warning: Expecting numeric in D22879 / R22879C4: got 'n.a.'
## Warning: Expecting numeric in D22880 / R22880C4: got 'n.a.'
## Warning: Expecting numeric in D22881 / R22881C4: got 'n.a.'
## Warning: Expecting numeric in D22882 / R22882C4: got 'n.a.'
## Warning: Expecting numeric in D22883 / R22883C4: got 'n.a.'
## Warning: Expecting numeric in D22884 / R22884C4: got 'n.a.'
## Warning: Expecting numeric in D22885 / R22885C4: got 'n.a.'
## Warning: Expecting numeric in D22886 / R22886C4: got 'n.a.'
## Warning: Expecting numeric in D22887 / R22887C4: got 'n.a.'
## Warning: Expecting numeric in D22888 / R22888C4: got 'n.a.'
## Warning: Expecting numeric in D22889 / R22889C4: got 'n.a.'
## Warning: Expecting numeric in D22890 / R22890C4: got 'n.a.'
## Warning: Expecting numeric in D22891 / R22891C4: got 'n.a.'
## Warning: Expecting numeric in D22892 / R22892C4: got 'n.a.'
## Warning: Expecting numeric in D22893 / R22893C4: got 'n.a.'
## Warning: Expecting numeric in D22894 / R22894C4: got 'n.a.'
## Warning: Expecting numeric in D22895 / R22895C4: got 'n.a.'
## Warning: Expecting numeric in D22896 / R22896C4: got 'n.a.'
## Warning: Expecting numeric in D22897 / R22897C4: got 'n.a.'
## Warning: Expecting numeric in D22898 / R22898C4: got 'n.a.'
## Warning: Expecting numeric in D22899 / R22899C4: got 'n.a.'
## Warning: Expecting numeric in D22900 / R22900C4: got 'n.a.'
## Warning: Expecting numeric in D22901 / R22901C4: got 'n.a.'
## Warning: Expecting numeric in D22902 / R22902C4: got 'n.a.'
## Warning: Expecting numeric in D22903 / R22903C4: got 'n.a.'
## Warning: Expecting numeric in D22904 / R22904C4: got 'n.a.'
## Warning: Expecting numeric in D22905 / R22905C4: got 'n.a.'
## Warning: Expecting numeric in D22906 / R22906C4: got 'n.a.'
## Warning: Expecting numeric in D22907 / R22907C4: got 'n.a.'
## Warning: Expecting numeric in D22908 / R22908C4: got 'n.a.'
## Warning: Expecting numeric in D22909 / R22909C4: got 'n.a.'
## Warning: Expecting numeric in D22910 / R22910C4: got 'n.a.'
## Warning: Expecting numeric in D22911 / R22911C4: got 'n.a.'
## Warning: Expecting numeric in D22912 / R22912C4: got 'n.a.'
## Warning: Expecting numeric in D22913 / R22913C4: got 'n.a.'
## Warning: Expecting numeric in D22914 / R22914C4: got 'n.a.'
## Warning: Expecting numeric in D22915 / R22915C4: got 'n.a.'
## Warning: Expecting numeric in D22916 / R22916C4: got 'n.a.'
## Warning: Expecting numeric in D22917 / R22917C4: got 'n.a.'
## Warning: Expecting numeric in D22918 / R22918C4: got 'n.a.'
## Warning: Expecting numeric in D22919 / R22919C4: got 'n.a.'
## Warning: Expecting numeric in D22920 / R22920C4: got 'n.a.'
## Warning: Expecting numeric in D22921 / R22921C4: got 'n.a.'
## Warning: Expecting numeric in D22922 / R22922C4: got 'n.a.'
## Warning: Expecting numeric in D22923 / R22923C4: got 'n.a.'
## Warning: Expecting numeric in D22924 / R22924C4: got 'n.a.'
## Warning: Expecting numeric in D22925 / R22925C4: got 'n.a.'
## Warning: Expecting numeric in D22926 / R22926C4: got 'n.a.'
## Warning: Expecting numeric in D22927 / R22927C4: got 'n.a.'
## Warning: Expecting numeric in D22928 / R22928C4: got 'n.a.'
## Warning: Expecting numeric in D22929 / R22929C4: got 'n.a.'
## Warning: Expecting numeric in D22930 / R22930C4: got 'n.a.'
## Warning: Expecting numeric in D22931 / R22931C4: got 'n.a.'
## Warning: Expecting numeric in D22932 / R22932C4: got 'n.a.'
## Warning: Expecting numeric in D22933 / R22933C4: got 'n.a.'
## Warning: Expecting numeric in D22934 / R22934C4: got 'n.a.'
## Warning: Expecting numeric in D22935 / R22935C4: got 'n.a.'
## Warning: Expecting numeric in D22936 / R22936C4: got 'n.a.'
## Warning: Expecting numeric in D22937 / R22937C4: got 'n.a.'
## Warning: Expecting numeric in D22938 / R22938C4: got 'n.a.'
## Warning: Expecting numeric in D22939 / R22939C4: got 'n.a.'
## Warning: Expecting numeric in D22940 / R22940C4: got 'n.a.'
## Warning: Expecting numeric in D22941 / R22941C4: got 'n.a.'
## Warning: Expecting numeric in D22942 / R22942C4: got 'n.a.'
## Warning: Expecting numeric in D22943 / R22943C4: got 'n.a.'
## Warning: Expecting numeric in D22944 / R22944C4: got 'n.a.'
## Warning: Expecting numeric in D22945 / R22945C4: got 'n.a.'
## Warning: Expecting numeric in D22946 / R22946C4: got 'n.a.'
## Warning: Expecting numeric in D22947 / R22947C4: got 'n.a.'
## Warning: Expecting numeric in D22948 / R22948C4: got 'n.a.'
## Warning: Expecting numeric in D22949 / R22949C4: got 'n.a.'
## Warning: Expecting numeric in D22950 / R22950C4: got 'n.a.'
## Warning: Expecting numeric in D22951 / R22951C4: got 'n.a.'
## Warning: Expecting numeric in D22952 / R22952C4: got 'n.a.'
## Warning: Expecting numeric in D22953 / R22953C4: got 'n.a.'
## Warning: Expecting numeric in D22954 / R22954C4: got 'n.a.'
## Warning: Expecting numeric in D22955 / R22955C4: got 'n.a.'
## Warning: Expecting numeric in D22956 / R22956C4: got 'n.a.'
## Warning: Expecting numeric in D22957 / R22957C4: got 'n.a.'
## Warning: Expecting numeric in D22958 / R22958C4: got 'n.a.'
## Warning: Expecting numeric in D22959 / R22959C4: got 'n.a.'
## Warning: Expecting numeric in D22960 / R22960C4: got 'n.a.'
## Warning: Expecting numeric in D22961 / R22961C4: got 'n.a.'
## Warning: Expecting numeric in D22962 / R22962C4: got 'n.a.'
## Warning: Expecting numeric in D22963 / R22963C4: got 'n.a.'
## Warning: Expecting numeric in D22964 / R22964C4: got 'n.a.'
## Warning: Expecting numeric in D22965 / R22965C4: got 'n.a.'
## Warning: Expecting numeric in D22966 / R22966C4: got 'n.a.'
## Warning: Expecting numeric in D22967 / R22967C4: got 'n.a.'
## Warning: Expecting numeric in D22968 / R22968C4: got 'n.a.'
## Warning: Expecting numeric in D22969 / R22969C4: got 'n.a.'
## Warning: Expecting numeric in D22970 / R22970C4: got 'n.a.'
## Warning: Expecting numeric in D22971 / R22971C4: got 'n.a.'
## Warning: Expecting numeric in D22972 / R22972C4: got 'n.a.'
## Warning: Expecting numeric in D22973 / R22973C4: got 'n.a.'
## Warning: Expecting numeric in D22974 / R22974C4: got 'n.a.'
## Warning: Expecting numeric in D22975 / R22975C4: got 'n.a.'
## Warning: Expecting numeric in D22976 / R22976C4: got 'n.a.'
## Warning: Expecting numeric in D22977 / R22977C4: got 'n.a.'
## Warning: Expecting numeric in D22978 / R22978C4: got 'n.a.'
## Warning: Expecting numeric in D22979 / R22979C4: got 'n.a.'
## Warning: Expecting numeric in D22980 / R22980C4: got 'n.a.'
## Warning: Expecting numeric in D22981 / R22981C4: got 'n.a.'
## Warning: Expecting numeric in D22982 / R22982C4: got 'n.a.'
## Warning: Expecting numeric in D22983 / R22983C4: got 'n.a.'
## Warning: Expecting numeric in D22984 / R22984C4: got 'n.a.'
## Warning: Expecting numeric in D22985 / R22985C4: got 'n.a.'
## Warning: Expecting numeric in D22986 / R22986C4: got 'n.a.'
## Warning: Expecting numeric in D22987 / R22987C4: got 'n.a.'
## Warning: Expecting numeric in D22988 / R22988C4: got 'n.a.'
## Warning: Expecting numeric in D22989 / R22989C4: got 'n.a.'
## Warning: Expecting numeric in D22990 / R22990C4: got 'n.a.'
## Warning: Expecting numeric in D22991 / R22991C4: got 'n.a.'
## Warning: Expecting numeric in D22992 / R22992C4: got 'n.a.'
## Warning: Expecting numeric in D22993 / R22993C4: got 'n.a.'
## Warning: Expecting numeric in D22994 / R22994C4: got 'n.a.'
## Warning: Expecting numeric in D22995 / R22995C4: got 'n.a.'
## Warning: Expecting numeric in D22996 / R22996C4: got 'n.a.'
## Warning: Expecting numeric in D22997 / R22997C4: got 'n.a.'
## Warning: Expecting numeric in D22998 / R22998C4: got 'n.a.'
## Warning: Expecting numeric in D22999 / R22999C4: got 'n.a.'
## Warning: Expecting numeric in D23000 / R23000C4: got 'n.a.'
## Warning: Expecting numeric in D23001 / R23001C4: got 'n.a.'
## Warning: Expecting numeric in D23002 / R23002C4: got 'n.a.'
## Warning: Expecting numeric in D23003 / R23003C4: got 'n.a.'
## Warning: Expecting numeric in D23004 / R23004C4: got 'n.a.'
## Warning: Expecting numeric in D23005 / R23005C4: got 'n.a.'
## Warning: Expecting numeric in D23006 / R23006C4: got 'n.a.'
## Warning: Expecting numeric in D23007 / R23007C4: got 'n.a.'
## Warning: Expecting numeric in D23008 / R23008C4: got 'n.a.'
## Warning: Expecting numeric in D23009 / R23009C4: got 'n.a.'
## Warning: Expecting numeric in D23010 / R23010C4: got 'n.a.'
## Warning: Expecting numeric in D23011 / R23011C4: got 'n.a.'
## Warning: Expecting numeric in D23012 / R23012C4: got 'n.a.'
## Warning: Expecting numeric in D23013 / R23013C4: got 'n.a.'
## Warning: Expecting numeric in D23014 / R23014C4: got 'n.a.'
## Warning: Expecting numeric in D23015 / R23015C4: got 'n.a.'
## Warning: Expecting numeric in D23016 / R23016C4: got 'n.a.'
## Warning: Expecting numeric in D23017 / R23017C4: got 'n.a.'
## Warning: Expecting numeric in D23018 / R23018C4: got 'n.a.'
## Warning: Expecting numeric in D23019 / R23019C4: got 'n.a.'
## Warning: Expecting numeric in D23020 / R23020C4: got 'n.a.'
## Warning: Expecting numeric in D23021 / R23021C4: got 'n.a.'
## Warning: Expecting numeric in D23022 / R23022C4: got 'n.a.'
## Warning: Expecting numeric in D23023 / R23023C4: got 'n.a.'
## Warning: Expecting numeric in D23024 / R23024C4: got 'n.a.'
## Warning: Expecting numeric in D23025 / R23025C4: got 'n.a.'
## Warning: Expecting numeric in D23026 / R23026C4: got 'n.a.'
## Warning: Expecting numeric in D23027 / R23027C4: got 'n.a.'
## Warning: Expecting numeric in D23028 / R23028C4: got 'n.a.'
## Warning: Expecting numeric in D23029 / R23029C4: got 'n.a.'
## Warning: Expecting numeric in D23030 / R23030C4: got 'n.a.'
## Warning: Expecting numeric in D23031 / R23031C4: got 'n.a.'
## Warning: Expecting numeric in D23032 / R23032C4: got 'n.a.'
## Warning: Expecting numeric in D23033 / R23033C4: got 'n.a.'
## Warning: Expecting numeric in D23034 / R23034C4: got 'n.a.'
## Warning: Expecting numeric in D23035 / R23035C4: got 'n.a.'
## Warning: Expecting numeric in D23036 / R23036C4: got 'n.a.'
## Warning: Expecting numeric in D23037 / R23037C4: got 'n.a.'
## Warning: Expecting numeric in D23038 / R23038C4: got 'n.a.'
## Warning: Expecting numeric in D23039 / R23039C4: got 'n.a.'
## Warning: Expecting numeric in D23040 / R23040C4: got 'n.a.'
## Warning: Expecting numeric in D23041 / R23041C4: got 'n.a.'
## Warning: Expecting numeric in D23042 / R23042C4: got 'n.a.'
## Warning: Expecting numeric in D23043 / R23043C4: got 'n.a.'
## Warning: Expecting numeric in D23044 / R23044C4: got 'n.a.'
## Warning: Expecting numeric in D23045 / R23045C4: got 'n.a.'
## Warning: Expecting numeric in D23046 / R23046C4: got 'n.a.'
## Warning: Expecting numeric in D23047 / R23047C4: got 'n.a.'
## Warning: Expecting numeric in D23048 / R23048C4: got 'n.a.'
## Warning: Expecting numeric in D23049 / R23049C4: got 'n.a.'
## Warning: Expecting numeric in D23050 / R23050C4: got 'n.a.'
## Warning: Expecting numeric in D23051 / R23051C4: got 'n.a.'
## Warning: Expecting numeric in D23052 / R23052C4: got 'n.a.'
## Warning: Expecting numeric in D23053 / R23053C4: got 'n.a.'
## Warning: Expecting numeric in D23054 / R23054C4: got 'n.a.'
## Warning: Expecting numeric in D23055 / R23055C4: got 'n.a.'
## Warning: Expecting numeric in D23056 / R23056C4: got 'n.a.'
## Warning: Expecting numeric in D23057 / R23057C4: got 'n.a.'
## Warning: Expecting numeric in D23058 / R23058C4: got 'n.a.'
## Warning: Expecting numeric in D23059 / R23059C4: got 'n.a.'
## Warning: Expecting numeric in D23060 / R23060C4: got 'n.a.'
## Warning: Expecting numeric in D23061 / R23061C4: got 'n.a.'
## Warning: Expecting numeric in D23062 / R23062C4: got 'n.a.'
## Warning: Expecting numeric in D23063 / R23063C4: got 'n.a.'
## Warning: Expecting numeric in D23064 / R23064C4: got 'n.a.'
## Warning: Expecting numeric in D23065 / R23065C4: got 'n.a.'
## Warning: Expecting numeric in D23066 / R23066C4: got 'n.a.'
## Warning: Expecting numeric in D23067 / R23067C4: got 'n.a.'
## Warning: Expecting numeric in D23068 / R23068C4: got 'n.a.'
## Warning: Expecting numeric in D23069 / R23069C4: got 'n.a.'
## Warning: Expecting numeric in D23070 / R23070C4: got 'n.a.'
## Warning: Expecting numeric in D23071 / R23071C4: got 'n.a.'
## Warning: Expecting numeric in D23072 / R23072C4: got 'n.a.'
## Warning: Expecting numeric in D23073 / R23073C4: got 'n.a.'
## Warning: Expecting numeric in D23074 / R23074C4: got 'n.a.'
## Warning: Expecting numeric in D23075 / R23075C4: got 'n.a.'
## Warning: Expecting numeric in D23076 / R23076C4: got 'n.a.'
## Warning: Expecting numeric in D23077 / R23077C4: got 'n.a.'
## Warning: Expecting numeric in D23078 / R23078C4: got 'n.a.'
## Warning: Expecting numeric in D23079 / R23079C4: got 'n.a.'
## Warning: Expecting numeric in D23080 / R23080C4: got 'n.a.'
## Warning: Expecting numeric in D23081 / R23081C4: got 'n.a.'
## Warning: Expecting numeric in D23082 / R23082C4: got 'n.a.'
## Warning: Expecting numeric in D23083 / R23083C4: got 'n.a.'
## Warning: Expecting numeric in D23084 / R23084C4: got 'n.a.'
## Warning: Expecting numeric in D23085 / R23085C4: got 'n.a.'
## Warning: Expecting numeric in D23086 / R23086C4: got 'n.a.'
## Warning: Expecting numeric in D23087 / R23087C4: got 'n.a.'
## Warning: Expecting numeric in D23088 / R23088C4: got 'n.a.'
## Warning: Expecting numeric in D23089 / R23089C4: got 'n.a.'
## Warning: Expecting numeric in D23090 / R23090C4: got 'n.a.'
## Warning: Expecting numeric in D23091 / R23091C4: got 'n.a.'
## Warning: Expecting numeric in D23092 / R23092C4: got 'n.a.'
## Warning: Expecting numeric in D23093 / R23093C4: got 'n.a.'
## Warning: Expecting numeric in D23094 / R23094C4: got 'n.a.'
## Warning: Expecting numeric in D23095 / R23095C4: got 'n.a.'
## Warning: Expecting numeric in D23096 / R23096C4: got 'n.a.'
## Warning: Expecting numeric in D23097 / R23097C4: got 'n.a.'
## Warning: Expecting numeric in D23098 / R23098C4: got 'n.a.'
## Warning: Expecting numeric in D23099 / R23099C4: got 'n.a.'
## Warning: Expecting numeric in D23100 / R23100C4: got 'n.a.'
## Warning: Expecting numeric in D23101 / R23101C4: got 'n.a.'
## Warning: Expecting numeric in D23102 / R23102C4: got 'n.a.'
## Warning: Expecting numeric in D23103 / R23103C4: got 'n.a.'
## Warning: Expecting numeric in D23104 / R23104C4: got 'n.a.'
## Warning: Expecting numeric in D23105 / R23105C4: got 'n.a.'
## Warning: Expecting numeric in D23106 / R23106C4: got 'n.a.'
## Warning: Expecting numeric in D23107 / R23107C4: got 'n.a.'
## Warning: Expecting numeric in D23108 / R23108C4: got 'n.a.'
## Warning: Expecting numeric in D23109 / R23109C4: got 'n.a.'
## Warning: Expecting numeric in D23110 / R23110C4: got 'n.a.'
## Warning: Expecting numeric in D23111 / R23111C4: got 'n.a.'
## Warning: Expecting numeric in D23112 / R23112C4: got 'n.a.'
## Warning: Expecting numeric in D23113 / R23113C4: got 'n.a.'
## Warning: Expecting numeric in D23114 / R23114C4: got 'n.a.'
## Warning: Expecting numeric in D23115 / R23115C4: got 'n.a.'
## Warning: Expecting numeric in D23116 / R23116C4: got 'n.a.'
## Warning: Expecting numeric in D23117 / R23117C4: got 'n.a.'
## Warning: Expecting numeric in D23118 / R23118C4: got 'n.a.'
## Warning: Expecting numeric in D23119 / R23119C4: got 'n.a.'
## Warning: Expecting numeric in D23120 / R23120C4: got 'n.a.'
## Warning: Expecting numeric in D23121 / R23121C4: got 'n.a.'
## Warning: Expecting numeric in D23122 / R23122C4: got 'n.a.'
## Warning: Expecting numeric in D23123 / R23123C4: got 'n.a.'
## Warning: Expecting numeric in D23124 / R23124C4: got 'n.a.'
## Warning: Expecting numeric in D23125 / R23125C4: got 'n.a.'
## Warning: Expecting numeric in D23126 / R23126C4: got 'n.a.'
## Warning: Expecting numeric in D23127 / R23127C4: got 'n.a.'
## Warning: Expecting numeric in D23128 / R23128C4: got 'n.a.'
## Warning: Expecting numeric in D23129 / R23129C4: got 'n.a.'
## Warning: Expecting numeric in D23130 / R23130C4: got 'n.a.'
## Warning: Expecting numeric in D23131 / R23131C4: got 'n.a.'
## Warning: Expecting numeric in D23132 / R23132C4: got 'n.a.'
## Warning: Expecting numeric in D23133 / R23133C4: got 'n.a.'
## Warning: Expecting numeric in D23134 / R23134C4: got 'n.a.'
## Warning: Expecting numeric in D23135 / R23135C4: got 'n.a.'
## Warning: Expecting numeric in D23136 / R23136C4: got 'n.a.'
## Warning: Expecting numeric in D23137 / R23137C4: got 'n.a.'
## Warning: Expecting numeric in D23138 / R23138C4: got 'n.a.'
## Warning: Expecting numeric in D23139 / R23139C4: got 'n.a.'
## Warning: Expecting numeric in D23140 / R23140C4: got 'n.a.'
## Warning: Expecting numeric in D23141 / R23141C4: got 'n.a.'
## Warning: Expecting numeric in D23142 / R23142C4: got 'n.a.'
## Warning: Expecting numeric in D23143 / R23143C4: got 'n.a.'
## Warning: Expecting numeric in D23144 / R23144C4: got 'n.a.'
## Warning: Expecting numeric in D23145 / R23145C4: got 'n.a.'
## Warning: Expecting numeric in D23146 / R23146C4: got 'n.a.'
## Warning: Expecting numeric in D23147 / R23147C4: got 'n.a.'
## Warning: Expecting numeric in D23148 / R23148C4: got 'n.a.'
## Warning: Expecting numeric in D23149 / R23149C4: got 'n.a.'
## Warning: Expecting numeric in D23150 / R23150C4: got 'n.a.'
## Warning: Expecting numeric in D23151 / R23151C4: got 'n.a.'
## Warning: Expecting numeric in D23152 / R23152C4: got 'n.a.'
## Warning: Expecting numeric in D23153 / R23153C4: got 'n.a.'
## Warning: Expecting numeric in D23154 / R23154C4: got 'n.a.'
## Warning: Expecting numeric in D23155 / R23155C4: got 'n.a.'
## Warning: Expecting numeric in D23156 / R23156C4: got 'n.a.'
## Warning: Expecting numeric in D23157 / R23157C4: got 'n.a.'
## Warning: Expecting numeric in D23158 / R23158C4: got 'n.a.'
## Warning: Expecting numeric in D23159 / R23159C4: got 'n.a.'
## Warning: Expecting numeric in D23160 / R23160C4: got 'n.a.'
## Warning: Expecting numeric in D23161 / R23161C4: got 'n.a.'
## Warning: Expecting numeric in D23162 / R23162C4: got 'n.a.'
## Warning: Expecting numeric in D23163 / R23163C4: got 'n.a.'
## Warning: Expecting numeric in D23164 / R23164C4: got 'n.a.'
## Warning: Expecting numeric in D23165 / R23165C4: got 'n.a.'
## Warning: Expecting numeric in D23166 / R23166C4: got 'n.a.'
## Warning: Expecting numeric in D23167 / R23167C4: got 'n.a.'
## Warning: Expecting numeric in D23168 / R23168C4: got 'n.a.'
## Warning: Expecting numeric in D23169 / R23169C4: got 'n.a.'
## Warning: Expecting numeric in D23170 / R23170C4: got 'n.a.'
## Warning: Expecting numeric in D23171 / R23171C4: got 'n.a.'
## Warning: Expecting numeric in D23172 / R23172C4: got 'n.a.'
## Warning: Expecting numeric in D23173 / R23173C4: got 'n.a.'
## Warning: Expecting numeric in D23174 / R23174C4: got 'n.a.'
## Warning: Expecting numeric in D23175 / R23175C4: got 'n.a.'
## Warning: Expecting numeric in D23176 / R23176C4: got 'n.a.'
## Warning: Expecting numeric in D23177 / R23177C4: got 'n.a.'
## Warning: Expecting numeric in D23178 / R23178C4: got 'n.a.'
## Warning: Expecting numeric in D23179 / R23179C4: got 'n.a.'
## Warning: Expecting numeric in D23180 / R23180C4: got 'n.a.'
## Warning: Expecting numeric in D23181 / R23181C4: got 'n.a.'
## Warning: Expecting numeric in D23182 / R23182C4: got 'n.a.'
## Warning: Expecting numeric in D23183 / R23183C4: got 'n.a.'
## Warning: Expecting numeric in D23184 / R23184C4: got 'n.a.'
## Warning: Expecting numeric in D23185 / R23185C4: got 'n.a.'
## Warning: Expecting numeric in D23186 / R23186C4: got 'n.a.'
## Warning: Expecting numeric in D23187 / R23187C4: got 'n.a.'
## Warning: Expecting numeric in D23188 / R23188C4: got 'n.a.'
## Warning: Expecting numeric in D23189 / R23189C4: got 'n.a.'
## Warning: Expecting numeric in D23190 / R23190C4: got 'n.a.'
## Warning: Expecting numeric in D23191 / R23191C4: got 'n.a.'
## Warning: Expecting numeric in D23192 / R23192C4: got 'n.a.'
## Warning: Expecting numeric in D23193 / R23193C4: got 'n.a.'
## Warning: Expecting numeric in D23194 / R23194C4: got 'n.a.'
## Warning: Expecting numeric in D23195 / R23195C4: got 'n.a.'
## Warning: Expecting numeric in D23196 / R23196C4: got 'n.a.'
## Warning: Expecting numeric in D23197 / R23197C4: got 'n.a.'
## Warning: Expecting numeric in D23198 / R23198C4: got 'n.a.'
## Warning: Expecting numeric in D23199 / R23199C4: got 'n.a.'
## Warning: Expecting numeric in D23200 / R23200C4: got 'n.a.'
## Warning: Expecting numeric in D23201 / R23201C4: got 'n.a.'
## Warning: Expecting numeric in D23202 / R23202C4: got 'n.a.'
## Warning: Expecting numeric in D23203 / R23203C4: got 'n.a.'
## Warning: Expecting numeric in D23204 / R23204C4: got 'n.a.'
## Warning: Expecting numeric in D23205 / R23205C4: got 'n.a.'
## Warning: Expecting numeric in D23206 / R23206C4: got 'n.a.'
## Warning: Expecting numeric in D23207 / R23207C4: got 'n.a.'
## Warning: Expecting numeric in D23208 / R23208C4: got 'n.a.'
## Warning: Expecting numeric in D23209 / R23209C4: got 'n.a.'
## Warning: Expecting numeric in D23210 / R23210C4: got 'n.a.'
## Warning: Expecting numeric in D23211 / R23211C4: got 'n.a.'
## Warning: Expecting numeric in D23212 / R23212C4: got 'n.a.'
## Warning: Expecting numeric in D23213 / R23213C4: got 'n.a.'
## Warning: Expecting numeric in D23214 / R23214C4: got 'n.a.'
## Warning: Expecting numeric in D23215 / R23215C4: got 'n.a.'
## Warning: Expecting numeric in D23216 / R23216C4: got 'n.a.'
## Warning: Expecting numeric in D23217 / R23217C4: got 'n.a.'
## Warning: Expecting numeric in D23218 / R23218C4: got 'n.a.'
## Warning: Expecting numeric in D23219 / R23219C4: got 'n.a.'
## Warning: Expecting numeric in D23220 / R23220C4: got 'n.a.'
## Warning: Expecting numeric in D23221 / R23221C4: got 'n.a.'
## Warning: Expecting numeric in D23222 / R23222C4: got 'n.a.'
## Warning: Expecting numeric in D23223 / R23223C4: got 'n.a.'
## Warning: Expecting numeric in D23224 / R23224C4: got 'n.a.'
## Warning: Expecting numeric in D23225 / R23225C4: got 'n.a.'
## Warning: Expecting numeric in D23226 / R23226C4: got 'n.a.'
## Warning: Expecting numeric in D23227 / R23227C4: got 'n.a.'
## Warning: Expecting numeric in D23228 / R23228C4: got 'n.a.'
## Warning: Expecting numeric in D23229 / R23229C4: got 'n.a.'
## Warning: Expecting numeric in D23230 / R23230C4: got 'n.a.'
## Warning: Expecting numeric in D23231 / R23231C4: got 'n.a.'
## Warning: Expecting numeric in D23232 / R23232C4: got 'n.a.'
## Warning: Expecting numeric in D23233 / R23233C4: got 'n.a.'
## Warning: Expecting numeric in D23234 / R23234C4: got 'n.a.'
## Warning: Expecting numeric in D23235 / R23235C4: got 'n.a.'
## Warning: Expecting numeric in D23236 / R23236C4: got 'n.a.'
## Warning: Expecting numeric in D23237 / R23237C4: got 'n.a.'
## Warning: Expecting numeric in D23238 / R23238C4: got 'n.a.'
## Warning: Expecting numeric in D23239 / R23239C4: got 'n.a.'
## Warning: Expecting numeric in D23240 / R23240C4: got 'n.a.'
## Warning: Expecting numeric in D23241 / R23241C4: got 'n.a.'
## Warning: Expecting numeric in D23242 / R23242C4: got 'n.a.'
## Warning: Expecting numeric in D23243 / R23243C4: got 'n.a.'
## Warning: Expecting numeric in D23244 / R23244C4: got 'n.a.'
## Warning: Expecting numeric in D23245 / R23245C4: got 'n.a.'
## Warning: Expecting numeric in D23246 / R23246C4: got 'n.a.'
## Warning: Expecting numeric in D23247 / R23247C4: got 'n.a.'
## Warning: Expecting numeric in D23248 / R23248C4: got 'n.a.'
## Warning: Expecting numeric in D23249 / R23249C4: got 'n.a.'
## Warning: Expecting numeric in D23250 / R23250C4: got 'n.a.'
## Warning: Expecting numeric in D23251 / R23251C4: got 'n.a.'
## Warning: Expecting numeric in D23252 / R23252C4: got 'n.a.'
## Warning: Expecting numeric in D23253 / R23253C4: got 'n.a.'
## Warning: Expecting numeric in D23254 / R23254C4: got 'n.a.'
## Warning: Expecting numeric in D23255 / R23255C4: got 'n.a.'
## Warning: Expecting numeric in D23256 / R23256C4: got 'n.a.'
## Warning: Expecting numeric in D23257 / R23257C4: got 'n.a.'
## Warning: Expecting numeric in D23258 / R23258C4: got 'n.a.'
## Warning: Expecting numeric in D23259 / R23259C4: got 'n.a.'
## Warning: Expecting numeric in D23260 / R23260C4: got 'n.a.'
## Warning: Expecting numeric in D23261 / R23261C4: got 'n.a.'
## Warning: Expecting numeric in D23262 / R23262C4: got 'n.a.'
## Warning: Expecting numeric in D23263 / R23263C4: got 'n.a.'
## Warning: Expecting numeric in D23264 / R23264C4: got 'n.a.'
## Warning: Expecting numeric in D23265 / R23265C4: got 'n.a.'
## Warning: Expecting numeric in D23266 / R23266C4: got 'n.a.'
## Warning: Expecting numeric in D23267 / R23267C4: got 'n.a.'
## Warning: Expecting numeric in D23268 / R23268C4: got 'n.a.'
## Warning: Expecting numeric in D23269 / R23269C4: got 'n.a.'
## Warning: Expecting numeric in D23270 / R23270C4: got 'n.a.'
## Warning: Expecting numeric in D23271 / R23271C4: got 'n.a.'
## Warning: Expecting numeric in D23272 / R23272C4: got 'n.a.'
## Warning: Expecting numeric in D23273 / R23273C4: got 'n.a.'
## Warning: Expecting numeric in D23274 / R23274C4: got 'n.a.'
## Warning: Expecting numeric in D23275 / R23275C4: got 'n.a.'
## Warning: Expecting numeric in D23276 / R23276C4: got 'n.a.'
## Warning: Expecting numeric in D23277 / R23277C4: got 'n.a.'
## Warning: Expecting numeric in D23278 / R23278C4: got 'n.a.'
## Warning: Expecting numeric in D23279 / R23279C4: got 'n.a.'
## Warning: Expecting numeric in D23280 / R23280C4: got 'n.a.'
## Warning: Expecting numeric in D23281 / R23281C4: got 'n.a.'
## Warning: Expecting numeric in D23282 / R23282C4: got 'n.a.'
## Warning: Expecting numeric in D23283 / R23283C4: got 'n.a.'
## Warning: Expecting numeric in D23284 / R23284C4: got 'n.a.'
## Warning: Expecting numeric in D23285 / R23285C4: got 'n.a.'
## Warning: Expecting numeric in D23286 / R23286C4: got 'n.a.'
## Warning: Expecting numeric in D23287 / R23287C4: got 'n.a.'
## Warning: Expecting numeric in D23288 / R23288C4: got 'n.a.'
## Warning: Expecting numeric in D23289 / R23289C4: got 'n.a.'
## Warning: Expecting numeric in D23290 / R23290C4: got 'n.a.'
## Warning: Expecting numeric in D23291 / R23291C4: got 'n.a.'
## Warning: Expecting numeric in D23292 / R23292C4: got 'n.a.'
## Warning: Expecting numeric in D23293 / R23293C4: got 'n.a.'
## Warning: Expecting numeric in D23294 / R23294C4: got 'n.a.'
## Warning: Expecting numeric in D23295 / R23295C4: got 'n.a.'
## Warning: Expecting numeric in D23296 / R23296C4: got 'n.a.'
## Warning: Expecting numeric in D23297 / R23297C4: got 'n.a.'
## Warning: Expecting numeric in D23298 / R23298C4: got 'n.a.'
## Warning: Expecting numeric in D23299 / R23299C4: got 'n.a.'
## Warning: Expecting numeric in D23300 / R23300C4: got 'n.a.'
## Warning: Expecting numeric in D23301 / R23301C4: got 'n.a.'
## Warning: Expecting numeric in D23302 / R23302C4: got 'n.a.'
## Warning: Expecting numeric in D23303 / R23303C4: got 'n.a.'
## Warning: Expecting numeric in D23304 / R23304C4: got 'n.a.'
## Warning: Expecting numeric in D23305 / R23305C4: got 'n.a.'
## Warning: Expecting numeric in D23306 / R23306C4: got 'n.a.'
## Warning: Expecting numeric in D23307 / R23307C4: got 'n.a.'
## Warning: Expecting numeric in D23308 / R23308C4: got 'n.a.'
## Warning: Expecting numeric in D23309 / R23309C4: got 'n.a.'
## Warning: Expecting numeric in D23310 / R23310C4: got 'n.a.'
## Warning: Expecting numeric in D23311 / R23311C4: got 'n.a.'
## Warning: Expecting numeric in D23312 / R23312C4: got 'n.a.'
## Warning: Expecting numeric in D23313 / R23313C4: got 'n.a.'
## Warning: Expecting numeric in D23314 / R23314C4: got 'n.a.'
## Warning: Expecting numeric in D23315 / R23315C4: got 'n.a.'
## Warning: Expecting numeric in D23316 / R23316C4: got 'n.a.'
## Warning: Expecting numeric in D23317 / R23317C4: got 'n.a.'
## Warning: Expecting numeric in D23318 / R23318C4: got 'n.a.'
## Warning: Expecting numeric in D23319 / R23319C4: got 'n.a.'
## Warning: Expecting numeric in D23320 / R23320C4: got 'n.a.'
## Warning: Expecting numeric in D23321 / R23321C4: got 'n.a.'
## Warning: Expecting numeric in D23322 / R23322C4: got 'n.a.'
## Warning: Expecting numeric in D23323 / R23323C4: got 'n.a.'
## Warning: Expecting numeric in D23324 / R23324C4: got 'n.a.'
## Warning: Expecting numeric in D23325 / R23325C4: got 'n.a.'
## Warning: Expecting numeric in D23326 / R23326C4: got 'n.a.'
## Warning: Expecting numeric in D23327 / R23327C4: got 'n.a.'
## Warning: Expecting numeric in D23328 / R23328C4: got 'n.a.'
## Warning: Expecting numeric in D23329 / R23329C4: got 'n.a.'
## Warning: Expecting numeric in D23330 / R23330C4: got 'n.a.'
## Warning: Expecting numeric in D23331 / R23331C4: got 'n.a.'
## Warning: Expecting numeric in D23332 / R23332C4: got 'n.a.'
## Warning: Expecting numeric in D23333 / R23333C4: got 'n.a.'
## Warning: Expecting numeric in D23334 / R23334C4: got 'n.a.'
## Warning: Expecting numeric in D23335 / R23335C4: got 'n.a.'
## Warning: Expecting numeric in D23336 / R23336C4: got 'n.a.'
## Warning: Expecting numeric in D23337 / R23337C4: got 'n.a.'
## Warning: Expecting numeric in D23338 / R23338C4: got 'n.a.'
## Warning: Expecting numeric in D23339 / R23339C4: got 'n.a.'
## Warning: Expecting numeric in D23340 / R23340C4: got 'n.a.'
## Warning: Expecting numeric in D23341 / R23341C4: got 'n.a.'
## Warning: Expecting numeric in D23342 / R23342C4: got 'n.a.'
## Warning: Expecting numeric in D23343 / R23343C4: got 'n.a.'
## Warning: Expecting numeric in D23344 / R23344C4: got 'n.a.'
## Warning: Expecting numeric in D23345 / R23345C4: got 'n.a.'
## Warning: Expecting numeric in D23346 / R23346C4: got 'n.a.'
## Warning: Expecting numeric in D23347 / R23347C4: got 'n.a.'
## Warning: Expecting numeric in D23348 / R23348C4: got 'n.a.'
## Warning: Expecting numeric in D23349 / R23349C4: got 'n.a.'
## Warning: Expecting numeric in D23350 / R23350C4: got 'n.a.'
## Warning: Expecting numeric in D23351 / R23351C4: got 'n.a.'
## Warning: Expecting numeric in D23352 / R23352C4: got 'n.a.'
## Warning: Expecting numeric in D23353 / R23353C4: got 'n.a.'
## Warning: Expecting numeric in D23354 / R23354C4: got 'n.a.'
## Warning: Expecting numeric in D23355 / R23355C4: got 'n.a.'
## Warning: Expecting numeric in D23356 / R23356C4: got 'n.a.'
## Warning: Expecting numeric in D23357 / R23357C4: got 'n.a.'
## Warning: Expecting numeric in D23358 / R23358C4: got 'n.a.'
## Warning: Expecting numeric in D23359 / R23359C4: got 'n.a.'
## Warning: Expecting numeric in D23360 / R23360C4: got 'n.a.'
## Warning: Expecting numeric in D23361 / R23361C4: got 'n.a.'
## Warning: Expecting numeric in D23362 / R23362C4: got 'n.a.'
## Warning: Expecting numeric in D23363 / R23363C4: got 'n.a.'
## Warning: Expecting numeric in D23364 / R23364C4: got 'n.a.'
## Warning: Expecting numeric in D23365 / R23365C4: got 'n.a.'
## Warning: Expecting numeric in D23366 / R23366C4: got 'n.a.'
## Warning: Expecting numeric in D23367 / R23367C4: got 'n.a.'
## Warning: Expecting numeric in D23368 / R23368C4: got 'n.a.'
## Warning: Expecting numeric in D23369 / R23369C4: got 'n.a.'
## Warning: Expecting numeric in D23370 / R23370C4: got 'n.a.'
## Warning: Expecting numeric in D23371 / R23371C4: got 'n.a.'
## Warning: Expecting numeric in D23372 / R23372C4: got 'n.a.'
## Warning: Expecting numeric in D23373 / R23373C4: got 'n.a.'
## Warning: Expecting numeric in D23374 / R23374C4: got 'n.a.'
## Warning: Expecting numeric in D23375 / R23375C4: got 'n.a.'
## Warning: Expecting numeric in D23376 / R23376C4: got 'n.a.'
## Warning: Expecting numeric in D23377 / R23377C4: got 'n.a.'
## Warning: Expecting numeric in D23378 / R23378C4: got 'n.a.'
## Warning: Expecting numeric in D23379 / R23379C4: got 'n.a.'
## Warning: Expecting numeric in D23380 / R23380C4: got 'n.a.'
## Warning: Expecting numeric in D23381 / R23381C4: got 'n.a.'
## Warning: Expecting numeric in D23382 / R23382C4: got 'n.a.'
## Warning: Expecting numeric in D23383 / R23383C4: got 'n.a.'
## Warning: Expecting numeric in D23384 / R23384C4: got 'n.a.'
## Warning: Expecting numeric in D23385 / R23385C4: got 'n.a.'
## Warning: Expecting numeric in D23386 / R23386C4: got 'n.a.'
## Warning: Expecting numeric in D23387 / R23387C4: got 'n.a.'
## Warning: Expecting numeric in D23388 / R23388C4: got 'n.a.'
## Warning: Expecting numeric in D23389 / R23389C4: got 'n.a.'
## Warning: Expecting numeric in D23390 / R23390C4: got 'n.a.'
## Warning: Expecting numeric in D23391 / R23391C4: got 'n.a.'
## Warning: Expecting numeric in D23392 / R23392C4: got 'n.a.'
## Warning: Expecting numeric in D23393 / R23393C4: got 'n.a.'
## Warning: Expecting numeric in D23394 / R23394C4: got 'n.a.'
## Warning: Expecting numeric in D23395 / R23395C4: got 'n.a.'
## Warning: Expecting numeric in D23396 / R23396C4: got 'n.a.'
## Warning: Expecting numeric in D23397 / R23397C4: got 'n.a.'
## Warning: Expecting numeric in D23398 / R23398C4: got 'n.a.'
## Warning: Expecting numeric in D23399 / R23399C4: got 'n.a.'
## Warning: Expecting numeric in D23400 / R23400C4: got 'n.a.'
## Warning: Expecting numeric in D23401 / R23401C4: got 'n.a.'
## Warning: Expecting numeric in D23402 / R23402C4: got 'n.a.'
## Warning: Expecting numeric in D23403 / R23403C4: got 'n.a.'
## Warning: Expecting numeric in D23404 / R23404C4: got 'n.a.'
## Warning: Expecting numeric in D23405 / R23405C4: got 'n.a.'
## Warning: Expecting numeric in D23406 / R23406C4: got 'n.a.'
## Warning: Expecting numeric in D23407 / R23407C4: got 'n.a.'
## Warning: Expecting numeric in D23408 / R23408C4: got 'n.a.'
## Warning: Expecting numeric in D23409 / R23409C4: got 'n.a.'
## Warning: Expecting numeric in D23410 / R23410C4: got 'n.a.'
## Warning: Expecting numeric in D23411 / R23411C4: got 'n.a.'
## Warning: Expecting numeric in D23412 / R23412C4: got 'n.a.'
## Warning: Expecting numeric in D23413 / R23413C4: got 'n.a.'
## Warning: Expecting numeric in D23414 / R23414C4: got 'n.a.'
## Warning: Expecting numeric in D23415 / R23415C4: got 'n.a.'
## Warning: Expecting numeric in D23416 / R23416C4: got 'n.a.'
## Warning: Expecting numeric in D23417 / R23417C4: got 'n.a.'
## Warning: Expecting numeric in D23418 / R23418C4: got 'n.a.'
## Warning: Expecting numeric in D23419 / R23419C4: got 'n.a.'
## Warning: Expecting numeric in D23420 / R23420C4: got 'n.a.'
## Warning: Expecting numeric in D23421 / R23421C4: got 'n.a.'
## Warning: Expecting numeric in D23422 / R23422C4: got 'n.a.'
## Warning: Expecting numeric in D23423 / R23423C4: got 'n.a.'
## Warning: Expecting numeric in D23424 / R23424C4: got 'n.a.'
## Warning: Expecting numeric in D23425 / R23425C4: got 'n.a.'
## Warning: Expecting numeric in D23426 / R23426C4: got 'n.a.'
## Warning: Expecting numeric in D23427 / R23427C4: got 'n.a.'
## Warning: Expecting numeric in D23428 / R23428C4: got 'n.a.'
## Warning: Expecting numeric in D23429 / R23429C4: got 'n.a.'
## Warning: Expecting numeric in D23430 / R23430C4: got 'n.a.'
## Warning: Expecting numeric in D23431 / R23431C4: got 'n.a.'
## Warning: Expecting numeric in D23432 / R23432C4: got 'n.a.'
## Warning: Expecting numeric in D23433 / R23433C4: got 'n.a.'
## Warning: Expecting numeric in D23434 / R23434C4: got 'n.a.'
## Warning: Expecting numeric in D23435 / R23435C4: got 'n.a.'
## Warning: Expecting numeric in D23436 / R23436C4: got 'n.a.'
## Warning: Expecting numeric in D23437 / R23437C4: got 'n.a.'
## Warning: Expecting numeric in D23438 / R23438C4: got 'n.a.'
## Warning: Expecting numeric in D23439 / R23439C4: got 'n.a.'
## Warning: Expecting numeric in D23440 / R23440C4: got 'n.a.'
## Warning: Expecting numeric in D23441 / R23441C4: got 'n.a.'
## Warning: Expecting numeric in D23442 / R23442C4: got 'n.a.'
## Warning: Expecting numeric in D23443 / R23443C4: got 'n.a.'
## Warning: Expecting numeric in D23444 / R23444C4: got 'n.a.'
## Warning: Expecting numeric in D23445 / R23445C4: got 'n.a.'
## Warning: Expecting numeric in D23446 / R23446C4: got 'n.a.'
## Warning: Expecting numeric in D23447 / R23447C4: got 'n.a.'
## Warning: Expecting numeric in D23448 / R23448C4: got 'n.a.'
## Warning: Expecting numeric in D23449 / R23449C4: got 'n.a.'
## Warning: Expecting numeric in D23450 / R23450C4: got 'n.a.'
## Warning: Expecting numeric in D23451 / R23451C4: got 'n.a.'
## Warning: Expecting numeric in D23452 / R23452C4: got 'n.a.'
## Warning: Expecting numeric in D23453 / R23453C4: got 'n.a.'
## Warning: Expecting numeric in D23454 / R23454C4: got 'n.a.'
## Warning: Expecting numeric in D23455 / R23455C4: got 'n.a.'
## Warning: Expecting numeric in D23456 / R23456C4: got 'n.a.'
## Warning: Expecting numeric in D23457 / R23457C4: got 'n.a.'
## Warning: Expecting numeric in D23458 / R23458C4: got 'n.a.'
## Warning: Expecting numeric in D23459 / R23459C4: got 'n.a.'
## Warning: Expecting numeric in D23460 / R23460C4: got 'n.a.'
## Warning: Expecting numeric in D23461 / R23461C4: got 'n.a.'
## Warning: Expecting numeric in D23462 / R23462C4: got 'n.a.'
## Warning: Expecting numeric in D23463 / R23463C4: got 'n.a.'
## Warning: Expecting numeric in D23464 / R23464C4: got 'n.a.'
## Warning: Expecting numeric in D23465 / R23465C4: got 'n.a.'
## Warning: Expecting numeric in D23466 / R23466C4: got 'n.a.'
## Warning: Expecting numeric in D23467 / R23467C4: got 'n.a.'
## Warning: Expecting numeric in D23468 / R23468C4: got 'n.a.'
## Warning: Expecting numeric in D23469 / R23469C4: got 'n.a.'
## Warning: Expecting numeric in D23470 / R23470C4: got 'n.a.'
## Warning: Expecting numeric in D23471 / R23471C4: got 'n.a.'
## Warning: Expecting numeric in D23472 / R23472C4: got 'n.a.'
## Warning: Expecting numeric in D23473 / R23473C4: got 'n.a.'
## Warning: Expecting numeric in D23474 / R23474C4: got 'n.a.'
## Warning: Expecting numeric in D23475 / R23475C4: got 'n.a.'
## Warning: Expecting numeric in D23476 / R23476C4: got 'n.a.'
## Warning: Expecting numeric in D23477 / R23477C4: got 'n.a.'
## Warning: Expecting numeric in D23478 / R23478C4: got 'n.a.'
## Warning: Expecting numeric in D23479 / R23479C4: got 'n.a.'
## Warning: Expecting numeric in D23480 / R23480C4: got 'n.a.'
## Warning: Expecting numeric in D23481 / R23481C4: got 'n.a.'
## Warning: Expecting numeric in D23482 / R23482C4: got 'n.a.'
## Warning: Expecting numeric in D23483 / R23483C4: got 'n.a.'
## Warning: Expecting numeric in D23484 / R23484C4: got 'n.a.'
## Warning: Expecting numeric in D23485 / R23485C4: got 'n.a.'
## Warning: Expecting numeric in D23486 / R23486C4: got 'n.a.'
## Warning: Expecting numeric in D23487 / R23487C4: got 'n.a.'
## Warning: Expecting numeric in D23488 / R23488C4: got 'n.a.'
## Warning: Expecting numeric in D23489 / R23489C4: got 'n.a.'
## Warning: Expecting numeric in D23490 / R23490C4: got 'n.a.'
## Warning: Expecting numeric in D23491 / R23491C4: got 'n.a.'
## Warning: Expecting numeric in D23492 / R23492C4: got 'n.a.'
## Warning: Expecting numeric in D23493 / R23493C4: got 'n.a.'
## Warning: Expecting numeric in D23494 / R23494C4: got 'n.a.'
## Warning: Expecting numeric in D23495 / R23495C4: got 'n.a.'
## Warning: Expecting numeric in D23496 / R23496C4: got 'n.a.'
## Warning: Expecting numeric in D23497 / R23497C4: got 'n.a.'
## Warning: Expecting numeric in D23498 / R23498C4: got 'n.a.'
## Warning: Expecting numeric in D23499 / R23499C4: got 'n.a.'
## Warning: Expecting numeric in D23500 / R23500C4: got 'n.a.'
## Warning: Expecting numeric in D23501 / R23501C4: got 'n.a.'
## Warning: Expecting numeric in D23502 / R23502C4: got 'n.a.'
## Warning: Expecting numeric in D23503 / R23503C4: got 'n.a.'
## Warning: Expecting numeric in D23504 / R23504C4: got 'n.a.'
## Warning: Expecting numeric in D23505 / R23505C4: got 'n.a.'
## Warning: Expecting numeric in D23506 / R23506C4: got 'n.a.'
## Warning: Expecting numeric in D23507 / R23507C4: got 'n.a.'
## Warning: Expecting numeric in D23508 / R23508C4: got 'n.a.'
## Warning: Expecting numeric in D23509 / R23509C4: got 'n.a.'
## Warning: Expecting numeric in D23510 / R23510C4: got 'n.a.'
## Warning: Expecting numeric in D23511 / R23511C4: got 'n.a.'
## Warning: Expecting numeric in D23512 / R23512C4: got 'n.a.'
## Warning: Expecting numeric in D23513 / R23513C4: got 'n.a.'
## Warning: Expecting numeric in D23514 / R23514C4: got 'n.a.'
## Warning: Expecting numeric in D23515 / R23515C4: got 'n.a.'
## Warning: Expecting numeric in D23516 / R23516C4: got 'n.a.'
## Warning: Expecting numeric in D23517 / R23517C4: got 'n.a.'
## Warning: Expecting numeric in D23518 / R23518C4: got 'n.a.'
## Warning: Expecting numeric in D23519 / R23519C4: got 'n.a.'
## Warning: Expecting numeric in D23520 / R23520C4: got 'n.a.'
## Warning: Expecting numeric in D23521 / R23521C4: got 'n.a.'
## Warning: Expecting numeric in D23522 / R23522C4: got 'n.a.'
## Warning: Expecting numeric in D23523 / R23523C4: got 'n.a.'
## Warning: Expecting numeric in D23524 / R23524C4: got 'n.a.'
## Warning: Expecting numeric in D23525 / R23525C4: got 'n.a.'
## Warning: Expecting numeric in D23526 / R23526C4: got 'n.a.'
## Warning: Expecting numeric in D23527 / R23527C4: got 'n.a.'
## Warning: Expecting numeric in D23528 / R23528C4: got 'n.a.'
## Warning: Expecting numeric in D23529 / R23529C4: got 'n.a.'
## Warning: Expecting numeric in D23530 / R23530C4: got 'n.a.'
## Warning: Expecting numeric in D23531 / R23531C4: got 'n.a.'
## Warning: Expecting numeric in D23532 / R23532C4: got 'n.a.'
## Warning: Expecting numeric in D23533 / R23533C4: got 'n.a.'
## Warning: Expecting numeric in D23534 / R23534C4: got 'n.a.'
## Warning: Expecting numeric in D23535 / R23535C4: got 'n.a.'
## Warning: Expecting numeric in D23536 / R23536C4: got 'n.a.'
## Warning: Expecting numeric in D23537 / R23537C4: got 'n.a.'
## Warning: Expecting numeric in D23538 / R23538C4: got 'n.a.'
## Warning: Expecting numeric in D23539 / R23539C4: got 'n.a.'
## Warning: Expecting numeric in D23540 / R23540C4: got 'n.a.'
## Warning: Expecting numeric in D23541 / R23541C4: got 'n.a.'
## Warning: Expecting numeric in D23542 / R23542C4: got 'n.a.'
## Warning: Expecting numeric in D23543 / R23543C4: got 'n.a.'
## Warning: Expecting numeric in D23544 / R23544C4: got 'n.a.'
## Warning: Expecting numeric in D23545 / R23545C4: got 'n.a.'
## Warning: Expecting numeric in D23546 / R23546C4: got 'n.a.'
## Warning: Expecting numeric in D23547 / R23547C4: got 'n.a.'
## Warning: Expecting numeric in D23548 / R23548C4: got 'n.a.'
## Warning: Expecting numeric in D23549 / R23549C4: got 'n.a.'
## Warning: Expecting numeric in D23550 / R23550C4: got 'n.a.'
## Warning: Expecting numeric in D23551 / R23551C4: got 'n.a.'
## Warning: Expecting numeric in D23552 / R23552C4: got 'n.a.'
## Warning: Expecting numeric in D23553 / R23553C4: got 'n.a.'
## Warning: Expecting numeric in D23554 / R23554C4: got 'n.a.'
## Warning: Expecting numeric in D23555 / R23555C4: got 'n.a.'
## Warning: Expecting numeric in D23556 / R23556C4: got 'n.a.'
## Warning: Expecting numeric in D23557 / R23557C4: got 'n.a.'
## Warning: Expecting numeric in D23558 / R23558C4: got 'n.a.'
## Warning: Expecting numeric in D23559 / R23559C4: got 'n.a.'
## Warning: Expecting numeric in D23560 / R23560C4: got 'n.a.'
## Warning: Expecting numeric in D23561 / R23561C4: got 'n.a.'
## Warning: Expecting numeric in D23562 / R23562C4: got 'n.a.'
## Warning: Expecting numeric in D23563 / R23563C4: got 'n.a.'
## Warning: Expecting numeric in D23564 / R23564C4: got 'n.a.'
## Warning: Expecting numeric in D23565 / R23565C4: got 'n.a.'
## Warning: Expecting numeric in D23566 / R23566C4: got 'n.a.'
## Warning: Expecting numeric in D23567 / R23567C4: got 'n.a.'
## Warning: Expecting numeric in D23568 / R23568C4: got 'n.a.'
## Warning: Expecting numeric in D23569 / R23569C4: got 'n.a.'
## Warning: Expecting numeric in D23570 / R23570C4: got 'n.a.'
## Warning: Expecting numeric in D23571 / R23571C4: got 'n.a.'
## Warning: Expecting numeric in D23572 / R23572C4: got 'n.a.'
## Warning: Expecting numeric in D23573 / R23573C4: got 'n.a.'
## Warning: Expecting numeric in D23574 / R23574C4: got 'n.a.'
## Warning: Expecting numeric in D23575 / R23575C4: got 'n.a.'
## Warning: Expecting numeric in D23576 / R23576C4: got 'n.a.'
## Warning: Expecting numeric in D23577 / R23577C4: got 'n.a.'
## Warning: Expecting numeric in D23578 / R23578C4: got 'n.a.'
## Warning: Expecting numeric in D23579 / R23579C4: got 'n.a.'
## Warning: Expecting numeric in D23580 / R23580C4: got 'n.a.'
## Warning: Expecting numeric in D23581 / R23581C4: got 'n.a.'
## Warning: Expecting numeric in D23582 / R23582C4: got 'n.a.'
## Warning: Expecting numeric in D23583 / R23583C4: got 'n.a.'
## Warning: Expecting numeric in D23584 / R23584C4: got 'n.a.'
## Warning: Expecting numeric in D23585 / R23585C4: got 'n.a.'
## Warning: Expecting numeric in D23586 / R23586C4: got 'n.a.'
## Warning: Expecting numeric in D23587 / R23587C4: got 'n.a.'
## Warning: Expecting numeric in D23588 / R23588C4: got 'n.a.'
## Warning: Expecting numeric in D23589 / R23589C4: got 'n.a.'
## Warning: Expecting numeric in D23590 / R23590C4: got 'n.a.'
## Warning: Expecting numeric in D23591 / R23591C4: got 'n.a.'
## Warning: Expecting numeric in D23592 / R23592C4: got 'n.a.'
## Warning: Expecting numeric in D23593 / R23593C4: got 'n.a.'
## Warning: Expecting numeric in D23594 / R23594C4: got 'n.a.'
## Warning: Expecting numeric in D23595 / R23595C4: got 'n.a.'
## Warning: Expecting numeric in D23596 / R23596C4: got 'n.a.'
## Warning: Expecting numeric in D23597 / R23597C4: got 'n.a.'
## Warning: Expecting numeric in D23598 / R23598C4: got 'n.a.'
## Warning: Expecting numeric in D23599 / R23599C4: got 'n.a.'
## Warning: Expecting numeric in D23600 / R23600C4: got 'n.a.'
## Warning: Expecting numeric in D23601 / R23601C4: got 'n.a.'
## Warning: Expecting numeric in D23602 / R23602C4: got 'n.a.'
## Warning: Expecting numeric in D23603 / R23603C4: got 'n.a.'
## Warning: Expecting numeric in D23604 / R23604C4: got 'n.a.'
## Warning: Expecting numeric in D23605 / R23605C4: got 'n.a.'
## Warning: Expecting numeric in D23606 / R23606C4: got 'n.a.'
## Warning: Expecting numeric in D23607 / R23607C4: got 'n.a.'
## Warning: Expecting numeric in D23608 / R23608C4: got 'n.a.'
## Warning: Expecting numeric in D23609 / R23609C4: got 'n.a.'
## Warning: Expecting numeric in D23610 / R23610C4: got 'n.a.'
## Warning: Expecting numeric in D23611 / R23611C4: got 'n.a.'
## Warning: Expecting numeric in D23612 / R23612C4: got 'n.a.'
## Warning: Expecting numeric in D23613 / R23613C4: got 'n.a.'
## Warning: Expecting numeric in D23614 / R23614C4: got 'n.a.'
## Warning: Expecting numeric in D23615 / R23615C4: got 'n.a.'
## Warning: Expecting numeric in D23616 / R23616C4: got 'n.a.'
## Warning: Expecting numeric in D23617 / R23617C4: got 'n.a.'
## Warning: Expecting numeric in D23618 / R23618C4: got 'n.a.'
## Warning: Expecting numeric in D23619 / R23619C4: got 'n.a.'
## Warning: Expecting numeric in D23620 / R23620C4: got 'n.a.'
## Warning: Expecting numeric in D23621 / R23621C4: got 'n.a.'
## Warning: Expecting numeric in D23622 / R23622C4: got 'n.a.'
## Warning: Expecting numeric in D23623 / R23623C4: got 'n.a.'
## Warning: Expecting numeric in D23624 / R23624C4: got 'n.a.'
## Warning: Expecting numeric in D23625 / R23625C4: got 'n.a.'
## Warning: Expecting numeric in D23626 / R23626C4: got 'n.a.'
## Warning: Expecting numeric in D23627 / R23627C4: got 'n.a.'
## Warning: Expecting numeric in D23628 / R23628C4: got 'n.a.'
## Warning: Expecting numeric in D23629 / R23629C4: got 'n.a.'
## Warning: Expecting numeric in D23630 / R23630C4: got 'n.a.'
## Warning: Expecting numeric in D23631 / R23631C4: got 'n.a.'
## Warning: Expecting numeric in D23632 / R23632C4: got 'n.a.'
## Warning: Expecting numeric in D23633 / R23633C4: got 'n.a.'
## Warning: Expecting numeric in D23634 / R23634C4: got 'n.a.'
## Warning: Expecting numeric in D23635 / R23635C4: got 'n.a.'
## Warning: Expecting numeric in D23636 / R23636C4: got 'n.a.'
## Warning: Expecting numeric in D23637 / R23637C4: got 'n.a.'
## Warning: Expecting numeric in D23638 / R23638C4: got 'n.a.'
## Warning: Expecting numeric in D23639 / R23639C4: got 'n.a.'
## Warning: Expecting numeric in D23640 / R23640C4: got 'n.a.'
## Warning: Expecting numeric in D23641 / R23641C4: got 'n.a.'
## Warning: Expecting numeric in D23642 / R23642C4: got 'n.a.'
## Warning: Expecting numeric in D23643 / R23643C4: got 'n.a.'
## Warning: Expecting numeric in D23644 / R23644C4: got 'n.a.'
## Warning: Expecting numeric in D23645 / R23645C4: got 'n.a.'
## Warning: Expecting numeric in D23646 / R23646C4: got 'n.a.'
## Warning: Expecting numeric in D23647 / R23647C4: got 'n.a.'
## Warning: Expecting numeric in D23648 / R23648C4: got 'n.a.'
## Warning: Expecting numeric in D23649 / R23649C4: got 'n.a.'
## Warning: Expecting numeric in D23650 / R23650C4: got 'n.a.'
## Warning: Expecting numeric in D23651 / R23651C4: got 'n.a.'
## Warning: Expecting numeric in D23652 / R23652C4: got 'n.a.'
## Warning: Expecting numeric in D23653 / R23653C4: got 'n.a.'
## Warning: Expecting numeric in D23654 / R23654C4: got 'n.a.'
## Warning: Expecting numeric in D23655 / R23655C4: got 'n.a.'
## Warning: Expecting numeric in D23656 / R23656C4: got 'n.a.'
## Warning: Expecting numeric in D23657 / R23657C4: got 'n.a.'
## Warning: Expecting numeric in D23658 / R23658C4: got 'n.a.'
## Warning: Expecting numeric in D23659 / R23659C4: got 'n.a.'
## Warning: Expecting numeric in D23660 / R23660C4: got 'n.a.'
## Warning: Expecting numeric in D23661 / R23661C4: got 'n.a.'
## Warning: Expecting numeric in D23662 / R23662C4: got 'n.a.'
## Warning: Expecting numeric in D23663 / R23663C4: got 'n.a.'
## Warning: Expecting numeric in D23664 / R23664C4: got 'n.a.'
## Warning: Expecting numeric in D23665 / R23665C4: got 'n.a.'
## Warning: Expecting numeric in D23666 / R23666C4: got 'n.a.'
## Warning: Expecting numeric in D23667 / R23667C4: got 'n.a.'
## Warning: Expecting numeric in D23668 / R23668C4: got 'n.a.'
## Warning: Expecting numeric in D23669 / R23669C4: got 'n.a.'
## Warning: Expecting numeric in D23670 / R23670C4: got 'n.a.'
## Warning: Expecting numeric in D23671 / R23671C4: got 'n.a.'
## Warning: Expecting numeric in D23672 / R23672C4: got 'n.a.'
## Warning: Expecting numeric in D23673 / R23673C4: got 'n.a.'
## Warning: Expecting numeric in D23674 / R23674C4: got 'n.a.'
## Warning: Expecting numeric in D23675 / R23675C4: got 'n.a.'
## Warning: Expecting numeric in D23676 / R23676C4: got 'n.a.'
## Warning: Expecting numeric in D23677 / R23677C4: got 'n.a.'
## Warning: Expecting numeric in D23678 / R23678C4: got 'n.a.'
## Warning: Expecting numeric in D23679 / R23679C4: got 'n.a.'
## Warning: Expecting numeric in D23680 / R23680C4: got 'n.a.'
## Warning: Expecting numeric in D23681 / R23681C4: got 'n.a.'
## Warning: Expecting numeric in D23682 / R23682C4: got 'n.a.'
## Warning: Expecting numeric in D23683 / R23683C4: got 'n.a.'
## Warning: Expecting numeric in D23684 / R23684C4: got 'n.a.'
## Warning: Expecting numeric in D23685 / R23685C4: got 'n.a.'
## Warning: Expecting numeric in D23686 / R23686C4: got 'n.a.'
## Warning: Expecting numeric in D23687 / R23687C4: got 'n.a.'
## Warning: Expecting numeric in D23688 / R23688C4: got 'n.a.'
## Warning: Expecting numeric in D23689 / R23689C4: got 'n.a.'
## Warning: Expecting numeric in D23690 / R23690C4: got 'n.a.'
## Warning: Expecting numeric in D23691 / R23691C4: got 'n.a.'
## Warning: Expecting numeric in D23692 / R23692C4: got 'n.a.'
## Warning: Expecting numeric in D23693 / R23693C4: got 'n.a.'
## Warning: Expecting numeric in D23694 / R23694C4: got 'n.a.'
## Warning: Expecting numeric in D23695 / R23695C4: got 'n.a.'
## Warning: Expecting numeric in D23696 / R23696C4: got 'n.a.'
## Warning: Expecting numeric in D23697 / R23697C4: got 'n.a.'
## Warning: Expecting numeric in D23698 / R23698C4: got 'n.a.'
## Warning: Expecting numeric in D23699 / R23699C4: got 'n.a.'
## Warning: Expecting numeric in D23700 / R23700C4: got 'n.a.'
## Warning: Expecting numeric in D23701 / R23701C4: got 'n.a.'
## Warning: Expecting numeric in D23702 / R23702C4: got 'n.a.'
## Warning: Expecting numeric in D23703 / R23703C4: got 'n.a.'
## Warning: Expecting numeric in D23704 / R23704C4: got 'n.a.'
## Warning: Expecting numeric in D23705 / R23705C4: got 'n.a.'
## Warning: Expecting numeric in D23706 / R23706C4: got 'n.a.'
## Warning: Expecting numeric in D23707 / R23707C4: got 'n.a.'
## Warning: Expecting numeric in D23708 / R23708C4: got 'n.a.'
## Warning: Expecting numeric in D23709 / R23709C4: got 'n.a.'
## Warning: Expecting numeric in D23710 / R23710C4: got 'n.a.'
## Warning: Expecting numeric in D23711 / R23711C4: got 'n.a.'
## Warning: Expecting numeric in D23712 / R23712C4: got 'n.a.'
## Warning: Expecting numeric in D23713 / R23713C4: got 'n.a.'
## Warning: Expecting numeric in D23714 / R23714C4: got 'n.a.'
## Warning: Expecting numeric in D23715 / R23715C4: got 'n.a.'
## Warning: Expecting numeric in D23716 / R23716C4: got 'n.a.'
## Warning: Expecting numeric in D23717 / R23717C4: got 'n.a.'
## Warning: Expecting numeric in D23718 / R23718C4: got 'n.a.'
## Warning: Expecting numeric in D23719 / R23719C4: got 'n.a.'
## Warning: Expecting numeric in D23720 / R23720C4: got 'n.a.'
## Warning: Expecting numeric in D23721 / R23721C4: got 'n.a.'
## Warning: Expecting numeric in D23722 / R23722C4: got 'n.a.'
## Warning: Expecting numeric in D23723 / R23723C4: got 'n.a.'
## Warning: Expecting numeric in D23724 / R23724C4: got 'n.a.'
## Warning: Expecting numeric in D23725 / R23725C4: got 'n.a.'
## Warning: Expecting numeric in D23726 / R23726C4: got 'n.a.'
## Warning: Expecting numeric in D23727 / R23727C4: got 'n.a.'
## Warning: Expecting numeric in D23728 / R23728C4: got 'n.a.'
## Warning: Expecting numeric in D23729 / R23729C4: got 'n.a.'
## Warning: Expecting numeric in D23730 / R23730C4: got 'n.a.'
## Warning: Expecting numeric in D23731 / R23731C4: got 'n.a.'
## Warning: Expecting numeric in D23732 / R23732C4: got 'n.a.'
## Warning: Expecting numeric in D23733 / R23733C4: got 'n.a.'
## Warning: Expecting numeric in D23734 / R23734C4: got 'n.a.'
## Warning: Expecting numeric in D23735 / R23735C4: got 'n.a.'
## Warning: Expecting numeric in D23736 / R23736C4: got 'n.a.'
## Warning: Expecting numeric in D23737 / R23737C4: got 'n.a.'
## Warning: Expecting numeric in D23738 / R23738C4: got 'n.a.'
## Warning: Expecting numeric in D23739 / R23739C4: got 'n.a.'
## Warning: Expecting numeric in D23740 / R23740C4: got 'n.a.'
## Warning: Expecting numeric in D23741 / R23741C4: got 'n.a.'
## Warning: Expecting numeric in D23742 / R23742C4: got 'n.a.'
## Warning: Expecting numeric in D23743 / R23743C4: got 'n.a.'
## Warning: Expecting numeric in D23744 / R23744C4: got 'n.a.'
## Warning: Expecting numeric in D23745 / R23745C4: got 'n.a.'
## Warning: Expecting numeric in D23746 / R23746C4: got 'n.a.'
## Warning: Expecting numeric in D23747 / R23747C4: got 'n.a.'
## Warning: Expecting numeric in D23748 / R23748C4: got 'n.a.'
## Warning: Expecting numeric in D23749 / R23749C4: got 'n.a.'
## Warning: Expecting numeric in D23750 / R23750C4: got 'n.a.'
## Warning: Expecting numeric in D23751 / R23751C4: got 'n.a.'
## Warning: Expecting numeric in D23752 / R23752C4: got 'n.a.'
## Warning: Expecting numeric in D23753 / R23753C4: got 'n.a.'
## Warning: Expecting numeric in D23754 / R23754C4: got 'n.a.'
## Warning: Expecting numeric in D23755 / R23755C4: got 'n.a.'
## Warning: Expecting numeric in D23756 / R23756C4: got 'n.a.'
## Warning: Expecting numeric in D23757 / R23757C4: got 'n.a.'
## Warning: Expecting numeric in D23758 / R23758C4: got 'n.a.'
## Warning: Expecting numeric in D23759 / R23759C4: got 'n.a.'
## Warning: Expecting numeric in D23760 / R23760C4: got 'n.a.'
## Warning: Expecting numeric in D23761 / R23761C4: got 'n.a.'
## Warning: Expecting numeric in D23762 / R23762C4: got 'n.a.'
## Warning: Expecting numeric in D23763 / R23763C4: got 'n.a.'
## Warning: Expecting numeric in D23764 / R23764C4: got 'n.a.'
## Warning: Expecting numeric in D23765 / R23765C4: got 'n.a.'
## Warning: Expecting numeric in D23766 / R23766C4: got 'n.a.'
## Warning: Expecting numeric in D23767 / R23767C4: got 'n.a.'
## Warning: Expecting numeric in D23768 / R23768C4: got 'n.a.'
## Warning: Expecting numeric in D23769 / R23769C4: got 'n.a.'
## Warning: Expecting numeric in D23770 / R23770C4: got 'n.a.'
## Warning: Expecting numeric in D23771 / R23771C4: got 'n.a.'
## Warning: Expecting numeric in D23772 / R23772C4: got 'n.a.'
## Warning: Expecting numeric in D23773 / R23773C4: got 'n.a.'
## Warning: Expecting numeric in D23774 / R23774C4: got 'n.a.'
## Warning: Expecting numeric in D23775 / R23775C4: got 'n.a.'
## Warning: Expecting numeric in D23776 / R23776C4: got 'n.a.'
## Warning: Expecting numeric in D23777 / R23777C4: got 'n.a.'
## Warning: Expecting numeric in D23778 / R23778C4: got 'n.a.'
## Warning: Expecting numeric in D23779 / R23779C4: got 'n.a.'
## Warning: Expecting numeric in D23780 / R23780C4: got 'n.a.'
## Warning: Expecting numeric in D23781 / R23781C4: got 'n.a.'
## Warning: Expecting numeric in D23782 / R23782C4: got 'n.a.'
## Warning: Expecting numeric in D23783 / R23783C4: got 'n.a.'
## Warning: Expecting numeric in D23784 / R23784C4: got 'n.a.'
## Warning: Expecting numeric in D23785 / R23785C4: got 'n.a.'
## Warning: Expecting numeric in D23786 / R23786C4: got 'n.a.'
## Warning: Expecting numeric in D23787 / R23787C4: got 'n.a.'
## Warning: Expecting numeric in D23788 / R23788C4: got 'n.a.'
## Warning: Expecting numeric in D23789 / R23789C4: got 'n.a.'
## Warning: Expecting numeric in D23790 / R23790C4: got 'n.a.'
## Warning: Expecting numeric in D23791 / R23791C4: got 'n.a.'
## Warning: Expecting numeric in D23792 / R23792C4: got 'n.a.'
## Warning: Expecting numeric in D23793 / R23793C4: got 'n.a.'
## Warning: Expecting numeric in D23794 / R23794C4: got 'n.a.'
## Warning: Expecting numeric in D23795 / R23795C4: got 'n.a.'
## Warning: Expecting numeric in D23796 / R23796C4: got 'n.a.'
## Warning: Expecting numeric in D23797 / R23797C4: got 'n.a.'
## Warning: Expecting numeric in D23798 / R23798C4: got 'n.a.'
## Warning: Expecting numeric in D23799 / R23799C4: got 'n.a.'
## Warning: Expecting numeric in D23800 / R23800C4: got 'n.a.'
## Warning: Expecting numeric in D23801 / R23801C4: got 'n.a.'
## Warning: Expecting numeric in D23802 / R23802C4: got 'n.a.'
## Warning: Expecting numeric in D23803 / R23803C4: got 'n.a.'
## Warning: Expecting numeric in D23804 / R23804C4: got 'n.a.'
## Warning: Expecting numeric in D23805 / R23805C4: got 'n.a.'
## Warning: Expecting numeric in D23806 / R23806C4: got 'n.a.'
## Warning: Expecting numeric in D23807 / R23807C4: got 'n.a.'
## Warning: Expecting numeric in D23808 / R23808C4: got 'n.a.'
## Warning: Expecting numeric in D23809 / R23809C4: got 'n.a.'
## Warning: Expecting numeric in D23810 / R23810C4: got 'n.a.'
## Warning: Expecting numeric in D23811 / R23811C4: got 'n.a.'
## Warning: Expecting numeric in D23812 / R23812C4: got 'n.a.'
## Warning: Expecting numeric in D23813 / R23813C4: got 'n.a.'
## Warning: Expecting numeric in D23814 / R23814C4: got 'n.a.'
## Warning: Expecting numeric in D23815 / R23815C4: got 'n.a.'
## Warning: Expecting numeric in D23816 / R23816C4: got 'n.a.'
## Warning: Expecting numeric in D23817 / R23817C4: got 'n.a.'
## Warning: Expecting numeric in D23818 / R23818C4: got 'n.a.'
## Warning: Expecting numeric in D23819 / R23819C4: got 'n.a.'
## Warning: Expecting numeric in D23820 / R23820C4: got 'n.a.'
## Warning: Expecting numeric in D23821 / R23821C4: got 'n.a.'
## Warning: Expecting numeric in D23822 / R23822C4: got 'n.a.'
## Warning: Expecting numeric in D23823 / R23823C4: got 'n.a.'
## Warning: Expecting numeric in D23824 / R23824C4: got 'n.a.'
## Warning: Expecting numeric in D23825 / R23825C4: got 'n.a.'
## Warning: Expecting numeric in D23826 / R23826C4: got 'n.a.'
## Warning: Expecting numeric in D23827 / R23827C4: got 'n.a.'
## Warning: Expecting numeric in D23828 / R23828C4: got 'n.a.'
## Warning: Expecting numeric in D23829 / R23829C4: got 'n.a.'
## Warning: Expecting numeric in D23830 / R23830C4: got 'n.a.'
## Warning: Expecting numeric in D23831 / R23831C4: got 'n.a.'
## Warning: Expecting numeric in D23832 / R23832C4: got 'n.a.'
## Warning: Expecting numeric in D23833 / R23833C4: got 'n.a.'
## Warning: Expecting numeric in D23834 / R23834C4: got 'n.a.'
## Warning: Expecting numeric in D23835 / R23835C4: got 'n.a.'
## Warning: Expecting numeric in D23836 / R23836C4: got 'n.a.'
## Warning: Expecting numeric in D23837 / R23837C4: got 'n.a.'
## Warning: Expecting numeric in D23838 / R23838C4: got 'n.a.'
## Warning: Expecting numeric in D23839 / R23839C4: got 'n.a.'
## Warning: Expecting numeric in D23840 / R23840C4: got 'n.a.'
## Warning: Expecting numeric in D23841 / R23841C4: got 'n.a.'
## Warning: Expecting numeric in D23842 / R23842C4: got 'n.a.'
## Warning: Expecting numeric in D23843 / R23843C4: got 'n.a.'
## Warning: Expecting numeric in D23844 / R23844C4: got 'n.a.'
## Warning: Expecting numeric in D23845 / R23845C4: got 'n.a.'
## Warning: Expecting numeric in D23846 / R23846C4: got 'n.a.'
## Warning: Expecting numeric in D23847 / R23847C4: got 'n.a.'
## Warning: Expecting numeric in D23848 / R23848C4: got 'n.a.'
## Warning: Expecting numeric in D23849 / R23849C4: got 'n.a.'
## Warning: Expecting numeric in D23850 / R23850C4: got 'n.a.'
## Warning: Expecting numeric in D23851 / R23851C4: got 'n.a.'
## Warning: Expecting numeric in D23852 / R23852C4: got 'n.a.'
## Warning: Expecting numeric in D23853 / R23853C4: got 'n.a.'
## Warning: Expecting numeric in D23854 / R23854C4: got 'n.a.'
## Warning: Expecting numeric in D23855 / R23855C4: got 'n.a.'
## Warning: Expecting numeric in D23856 / R23856C4: got 'n.a.'
## Warning: Expecting numeric in D23857 / R23857C4: got 'n.a.'
## Warning: Expecting numeric in D23858 / R23858C4: got 'n.a.'
## Warning: Expecting numeric in D23859 / R23859C4: got 'n.a.'
## Warning: Expecting numeric in D23860 / R23860C4: got 'n.a.'
## Warning: Expecting numeric in D23861 / R23861C4: got 'n.a.'
## Warning: Expecting numeric in D23862 / R23862C4: got 'n.a.'
## Warning: Expecting numeric in D23863 / R23863C4: got 'n.a.'
## Warning: Expecting numeric in D23864 / R23864C4: got 'n.a.'
## Warning: Expecting numeric in D23865 / R23865C4: got 'n.a.'
## Warning: Expecting numeric in D23866 / R23866C4: got 'n.a.'
## Warning: Expecting numeric in D23867 / R23867C4: got 'n.a.'
## Warning: Expecting numeric in D23868 / R23868C4: got 'n.a.'
## Warning: Expecting numeric in D23869 / R23869C4: got 'n.a.'
## Warning: Expecting numeric in D23870 / R23870C4: got 'n.a.'
## Warning: Expecting numeric in D23871 / R23871C4: got 'n.a.'
## Warning: Expecting numeric in D23872 / R23872C4: got 'n.a.'
## Warning: Expecting numeric in D23873 / R23873C4: got 'n.a.'
## Warning: Expecting numeric in D23874 / R23874C4: got 'n.a.'
## Warning: Expecting numeric in D23875 / R23875C4: got 'n.a.'
## Warning: Expecting numeric in D23876 / R23876C4: got 'n.a.'
## Warning: Expecting numeric in D23877 / R23877C4: got 'n.a.'
## Warning: Expecting numeric in D23878 / R23878C4: got 'n.a.'
## Warning: Expecting numeric in D23879 / R23879C4: got 'n.a.'
## Warning: Expecting numeric in D23880 / R23880C4: got 'n.a.'
## Warning: Expecting numeric in D23881 / R23881C4: got 'n.a.'
## Warning: Expecting numeric in D23882 / R23882C4: got 'n.a.'
## Warning: Expecting numeric in D23883 / R23883C4: got 'n.a.'
## Warning: Expecting numeric in D23884 / R23884C4: got 'n.a.'
## Warning: Expecting numeric in D23885 / R23885C4: got 'n.a.'
## Warning: Expecting numeric in D23886 / R23886C4: got 'n.a.'
## Warning: Expecting numeric in D23887 / R23887C4: got 'n.a.'
## Warning: Expecting numeric in D23888 / R23888C4: got 'n.a.'
## Warning: Expecting numeric in D23889 / R23889C4: got 'n.a.'
## Warning: Expecting numeric in D23890 / R23890C4: got 'n.a.'
## Warning: Expecting numeric in D23891 / R23891C4: got 'n.a.'
## Warning: Expecting numeric in D23892 / R23892C4: got 'n.a.'
## Warning: Expecting numeric in D23893 / R23893C4: got 'n.a.'
## Warning: Expecting numeric in D23894 / R23894C4: got 'n.a.'
## Warning: Expecting numeric in D23895 / R23895C4: got 'n.a.'
## Warning: Expecting numeric in D23896 / R23896C4: got 'n.a.'
## Warning: Expecting numeric in D23897 / R23897C4: got 'n.a.'
## Warning: Expecting numeric in D23898 / R23898C4: got 'n.a.'
## Warning: Expecting numeric in D23899 / R23899C4: got 'n.a.'
## Warning: Expecting numeric in D23900 / R23900C4: got 'n.a.'
## Warning: Expecting numeric in D23901 / R23901C4: got 'n.a.'
## Warning: Expecting numeric in D23902 / R23902C4: got 'n.a.'
## Warning: Expecting numeric in D23903 / R23903C4: got 'n.a.'
## Warning: Expecting numeric in D23904 / R23904C4: got 'n.a.'
## Warning: Expecting numeric in D23905 / R23905C4: got 'n.a.'
## Warning: Expecting numeric in D23906 / R23906C4: got 'n.a.'
## Warning: Expecting numeric in D23907 / R23907C4: got 'n.a.'
## Warning: Expecting numeric in D23908 / R23908C4: got 'n.a.'
## Warning: Expecting numeric in D23909 / R23909C4: got 'n.a.'
## Warning: Expecting numeric in D23910 / R23910C4: got 'n.a.'
## Warning: Expecting numeric in D23911 / R23911C4: got 'n.a.'
## Warning: Expecting numeric in D23912 / R23912C4: got 'n.a.'
## Warning: Expecting numeric in D23913 / R23913C4: got 'n.a.'
## Warning: Expecting numeric in D23914 / R23914C4: got 'n.a.'
## Warning: Expecting numeric in D23915 / R23915C4: got 'n.a.'
## Warning: Expecting numeric in D23916 / R23916C4: got 'n.a.'
## Warning: Expecting numeric in D23917 / R23917C4: got 'n.a.'
## Warning: Expecting numeric in D23918 / R23918C4: got 'n.a.'
## Warning: Expecting numeric in D23919 / R23919C4: got 'n.a.'
## Warning: Expecting numeric in D23920 / R23920C4: got 'n.a.'
## Warning: Expecting numeric in D23921 / R23921C4: got 'n.a.'
## Warning: Expecting numeric in D23922 / R23922C4: got 'n.a.'
## Warning: Expecting numeric in D23923 / R23923C4: got 'n.a.'
## Warning: Expecting numeric in D23924 / R23924C4: got 'n.a.'
## Warning: Expecting numeric in D23925 / R23925C4: got 'n.a.'
## Warning: Expecting numeric in D23926 / R23926C4: got 'n.a.'
## Warning: Expecting numeric in D23927 / R23927C4: got 'n.a.'
## Warning: Expecting numeric in D23928 / R23928C4: got 'n.a.'
## Warning: Expecting numeric in D23929 / R23929C4: got 'n.a.'
## Warning: Expecting numeric in D23930 / R23930C4: got 'n.a.'
## Warning: Expecting numeric in D23931 / R23931C4: got 'n.a.'
## Warning: Expecting numeric in D23932 / R23932C4: got 'n.a.'
## Warning: Expecting numeric in D23933 / R23933C4: got 'n.a.'
## Warning: Expecting numeric in D23934 / R23934C4: got 'n.a.'
## Warning: Expecting numeric in D23935 / R23935C4: got 'n.a.'
## Warning: Expecting numeric in D23936 / R23936C4: got 'n.a.'
## Warning: Expecting numeric in D23937 / R23937C4: got 'n.a.'
## Warning: Expecting numeric in D23938 / R23938C4: got 'n.a.'
## Warning: Expecting numeric in D23939 / R23939C4: got 'n.a.'
## Warning: Expecting numeric in D23940 / R23940C4: got 'n.a.'
## Warning: Expecting numeric in D23941 / R23941C4: got 'n.a.'
## Warning: Expecting numeric in D23942 / R23942C4: got 'n.a.'
## Warning: Expecting numeric in D23943 / R23943C4: got 'n.a.'
## Warning: Expecting numeric in D23944 / R23944C4: got 'n.a.'
## Warning: Expecting numeric in D23945 / R23945C4: got 'n.a.'
## Warning: Expecting numeric in D23946 / R23946C4: got 'n.a.'
## Warning: Expecting numeric in D23947 / R23947C4: got 'n.a.'
## Warning: Expecting numeric in D23948 / R23948C4: got 'n.a.'
## Warning: Expecting numeric in D23949 / R23949C4: got 'n.a.'
## Warning: Expecting numeric in D23950 / R23950C4: got 'n.a.'
## Warning: Expecting numeric in D23951 / R23951C4: got 'n.a.'
## Warning: Expecting numeric in D23952 / R23952C4: got 'n.a.'
## Warning: Expecting numeric in D23953 / R23953C4: got 'n.a.'
## Warning: Expecting numeric in D23954 / R23954C4: got 'n.a.'
## Warning: Expecting numeric in D23955 / R23955C4: got 'n.a.'
## Warning: Expecting numeric in D23956 / R23956C4: got 'n.a.'
## Warning: Expecting numeric in D23957 / R23957C4: got 'n.a.'
## Warning: Expecting numeric in D23958 / R23958C4: got 'n.a.'
## Warning: Expecting numeric in D23959 / R23959C4: got 'n.a.'
## Warning: Expecting numeric in D23960 / R23960C4: got 'n.a.'
## Warning: Expecting numeric in D23961 / R23961C4: got 'n.a.'
## Warning: Expecting numeric in D23962 / R23962C4: got 'n.a.'
## Warning: Expecting numeric in D23963 / R23963C4: got 'n.a.'
## Warning: Expecting numeric in D23964 / R23964C4: got 'n.a.'
## Warning: Expecting numeric in D23965 / R23965C4: got 'n.a.'
## Warning: Expecting numeric in D23966 / R23966C4: got 'n.a.'
## Warning: Expecting numeric in D23967 / R23967C4: got 'n.a.'
## Warning: Expecting numeric in D23968 / R23968C4: got 'n.a.'
## Warning: Expecting numeric in D23969 / R23969C4: got 'n.a.'
## Warning: Expecting numeric in D23970 / R23970C4: got 'n.a.'
## Warning: Expecting numeric in D23971 / R23971C4: got 'n.a.'
## Warning: Expecting numeric in D23972 / R23972C4: got 'n.a.'
## Warning: Expecting numeric in D23973 / R23973C4: got 'n.a.'
## Warning: Expecting numeric in D23974 / R23974C4: got 'n.a.'
## Warning: Expecting numeric in D23975 / R23975C4: got 'n.a.'
## Warning: Expecting numeric in D23976 / R23976C4: got 'n.a.'
## Warning: Expecting numeric in D23977 / R23977C4: got 'n.a.'
## Warning: Expecting numeric in D23978 / R23978C4: got 'n.a.'
## Warning: Expecting numeric in D23979 / R23979C4: got 'n.a.'
## Warning: Expecting numeric in D23980 / R23980C4: got 'n.a.'
## Warning: Expecting numeric in D23981 / R23981C4: got 'n.a.'
## Warning: Expecting numeric in D23982 / R23982C4: got 'n.a.'
## Warning: Expecting numeric in D23983 / R23983C4: got 'n.a.'
## Warning: Expecting numeric in D23984 / R23984C4: got 'n.a.'
## Warning: Expecting numeric in D23985 / R23985C4: got 'n.a.'
## Warning: Expecting numeric in D23986 / R23986C4: got 'n.a.'
## Warning: Expecting numeric in D23987 / R23987C4: got 'n.a.'
## Warning: Expecting numeric in D23988 / R23988C4: got 'n.a.'
## Warning: Expecting numeric in D23989 / R23989C4: got 'n.a.'
## Warning: Expecting numeric in D23990 / R23990C4: got 'n.a.'
## Warning: Expecting numeric in D23991 / R23991C4: got 'n.a.'
## Warning: Expecting numeric in D23992 / R23992C4: got 'n.a.'
## Warning: Expecting numeric in D23993 / R23993C4: got 'n.a.'
## Warning: Expecting numeric in D23994 / R23994C4: got 'n.a.'
## Warning: Expecting numeric in D23995 / R23995C4: got 'n.a.'
## Warning: Expecting numeric in D23996 / R23996C4: got 'n.a.'
## Warning: Expecting numeric in D23997 / R23997C4: got 'n.a.'
## Warning: Expecting numeric in D23998 / R23998C4: got 'n.a.'
## Warning: Expecting numeric in D23999 / R23999C4: got 'n.a.'
## Warning: Expecting numeric in D24000 / R24000C4: got 'n.a.'
## Warning: Expecting numeric in D24001 / R24001C4: got 'n.a.'
## Warning: Expecting numeric in D24002 / R24002C4: got 'n.a.'
## Warning: Expecting numeric in D24003 / R24003C4: got 'n.a.'
## Warning: Expecting numeric in D24004 / R24004C4: got 'n.a.'
## Warning: Expecting numeric in D24005 / R24005C4: got 'n.a.'
## Warning: Expecting numeric in D24006 / R24006C4: got 'n.a.'
## Warning: Expecting numeric in D24007 / R24007C4: got 'n.a.'
## Warning: Expecting numeric in D24008 / R24008C4: got 'n.a.'
## Warning: Expecting numeric in D24009 / R24009C4: got 'n.a.'
## Warning: Expecting numeric in D24010 / R24010C4: got 'n.a.'
## Warning: Expecting numeric in D24011 / R24011C4: got 'n.a.'
## Warning: Expecting numeric in D24012 / R24012C4: got 'n.a.'
## Warning: Expecting numeric in D24013 / R24013C4: got 'n.a.'
## Warning: Expecting numeric in D24014 / R24014C4: got 'n.a.'
## Warning: Expecting numeric in D24015 / R24015C4: got 'n.a.'
## Warning: Expecting numeric in D24016 / R24016C4: got 'n.a.'
## Warning: Expecting numeric in D24017 / R24017C4: got 'n.a.'
## Warning: Expecting numeric in D24018 / R24018C4: got 'n.a.'
## Warning: Expecting numeric in D24019 / R24019C4: got 'n.a.'
## Warning: Expecting numeric in D24020 / R24020C4: got 'n.a.'
## Warning: Expecting numeric in D24021 / R24021C4: got 'n.a.'
## Warning: Expecting numeric in D24022 / R24022C4: got 'n.a.'
## Warning: Expecting numeric in D24023 / R24023C4: got 'n.a.'
## Warning: Expecting numeric in D24024 / R24024C4: got 'n.a.'
## Warning: Expecting numeric in D24025 / R24025C4: got 'n.a.'
## Warning: Expecting numeric in D24026 / R24026C4: got 'n.a.'
## Warning: Expecting numeric in D24027 / R24027C4: got 'n.a.'
## Warning: Expecting numeric in D24028 / R24028C4: got 'n.a.'
## Warning: Expecting numeric in D24029 / R24029C4: got 'n.a.'
## Warning: Expecting numeric in D24030 / R24030C4: got 'n.a.'
## Warning: Expecting numeric in D24031 / R24031C4: got 'n.a.'
## Warning: Expecting numeric in D24032 / R24032C4: got 'n.a.'
## Warning: Expecting numeric in D24033 / R24033C4: got 'n.a.'
## Warning: Expecting numeric in D24034 / R24034C4: got 'n.a.'
## Warning: Expecting numeric in D24035 / R24035C4: got 'n.a.'
## Warning: Expecting numeric in D24036 / R24036C4: got 'n.a.'
## Warning: Expecting numeric in D24037 / R24037C4: got 'n.a.'
## Warning: Expecting numeric in D24038 / R24038C4: got 'n.a.'
## Warning: Expecting numeric in D24039 / R24039C4: got 'n.a.'
## Warning: Expecting numeric in D24040 / R24040C4: got 'n.a.'
## Warning: Expecting numeric in D24041 / R24041C4: got 'n.a.'
## Warning: Expecting numeric in D24042 / R24042C4: got 'n.a.'
## Warning: Expecting numeric in D24043 / R24043C4: got 'n.a.'
## Warning: Expecting numeric in D24044 / R24044C4: got 'n.a.'
## Warning: Expecting numeric in D24045 / R24045C4: got 'n.a.'
## Warning: Expecting numeric in D24046 / R24046C4: got 'n.a.'
## Warning: Expecting numeric in D24047 / R24047C4: got 'n.a.'
## Warning: Expecting numeric in D24048 / R24048C4: got 'n.a.'
## Warning: Expecting numeric in D24049 / R24049C4: got 'n.a.'
## Warning: Expecting numeric in D24050 / R24050C4: got 'n.a.'
## Warning: Expecting numeric in D24051 / R24051C4: got 'n.a.'
## Warning: Expecting numeric in D24052 / R24052C4: got 'n.a.'
## Warning: Expecting numeric in D24053 / R24053C4: got 'n.a.'
## Warning: Expecting numeric in D24054 / R24054C4: got 'n.a.'
## Warning: Expecting numeric in D24055 / R24055C4: got 'n.a.'
## Warning: Expecting numeric in D24056 / R24056C4: got 'n.a.'
## Warning: Expecting numeric in D24057 / R24057C4: got 'n.a.'
## Warning: Expecting numeric in D24058 / R24058C4: got 'n.a.'
## Warning: Expecting numeric in D24059 / R24059C4: got 'n.a.'
## Warning: Expecting numeric in D24060 / R24060C4: got 'n.a.'
## Warning: Expecting numeric in D24061 / R24061C4: got 'n.a.'
## Warning: Expecting numeric in D24062 / R24062C4: got 'n.a.'
## Warning: Expecting numeric in D24063 / R24063C4: got 'n.a.'
## Warning: Expecting numeric in D24064 / R24064C4: got 'n.a.'
## Warning: Expecting numeric in D24065 / R24065C4: got 'n.a.'
## Warning: Expecting numeric in D24066 / R24066C4: got 'n.a.'
## Warning: Expecting numeric in D24067 / R24067C4: got 'n.a.'
## Warning: Expecting numeric in D24068 / R24068C4: got 'n.a.'
## Warning: Expecting numeric in D24069 / R24069C4: got 'n.a.'
## Warning: Expecting numeric in D24070 / R24070C4: got 'n.a.'
## Warning: Expecting numeric in D24071 / R24071C4: got 'n.a.'
## Warning: Expecting numeric in D24072 / R24072C4: got 'n.a.'
## Warning: Expecting numeric in D24073 / R24073C4: got 'n.a.'
## Warning: Expecting numeric in D24074 / R24074C4: got 'n.a.'
## Warning: Expecting numeric in D24075 / R24075C4: got 'n.a.'
## Warning: Expecting numeric in D24076 / R24076C4: got 'n.a.'
## Warning: Expecting numeric in D24077 / R24077C4: got 'n.a.'
## Warning: Expecting numeric in D24078 / R24078C4: got 'n.a.'
## Warning: Expecting numeric in D24079 / R24079C4: got 'n.a.'
## Warning: Expecting numeric in D24080 / R24080C4: got 'n.a.'
## Warning: Expecting numeric in D24081 / R24081C4: got 'n.a.'
## Warning: Expecting numeric in D24082 / R24082C4: got 'n.a.'
## Warning: Expecting numeric in D24083 / R24083C4: got 'n.a.'
## Warning: Expecting numeric in D24084 / R24084C4: got 'n.a.'
## Warning: Expecting numeric in D24085 / R24085C4: got 'n.a.'
## Warning: Expecting numeric in D24086 / R24086C4: got 'n.a.'
## Warning: Expecting numeric in D24087 / R24087C4: got 'n.a.'
## Warning: Expecting numeric in D24088 / R24088C4: got 'n.a.'
## Warning: Expecting numeric in D24089 / R24089C4: got 'n.a.'
## Warning: Expecting numeric in D24090 / R24090C4: got 'n.a.'
## Warning: Expecting numeric in D24091 / R24091C4: got 'n.a.'
## Warning: Expecting numeric in D24092 / R24092C4: got 'n.a.'
## Warning: Expecting numeric in D24093 / R24093C4: got 'n.a.'
## Warning: Expecting numeric in D24094 / R24094C4: got 'n.a.'
## Warning: Expecting numeric in D24095 / R24095C4: got 'n.a.'
## Warning: Expecting numeric in D24096 / R24096C4: got 'n.a.'
## Warning: Expecting numeric in D24097 / R24097C4: got 'n.a.'
## Warning: Expecting numeric in D24098 / R24098C4: got 'n.a.'
## Warning: Expecting numeric in D24099 / R24099C4: got 'n.a.'
## Warning: Expecting numeric in D24100 / R24100C4: got 'n.a.'
## Warning: Expecting numeric in D24101 / R24101C4: got 'n.a.'
## Warning: Expecting numeric in D24102 / R24102C4: got 'n.a.'
## Warning: Expecting numeric in D24103 / R24103C4: got 'n.a.'
## Warning: Expecting numeric in D24104 / R24104C4: got 'n.a.'
## Warning: Expecting numeric in D24105 / R24105C4: got 'n.a.'
## Warning: Expecting numeric in D24106 / R24106C4: got 'n.a.'
## Warning: Expecting numeric in D24107 / R24107C4: got 'n.a.'
## Warning: Expecting numeric in D24108 / R24108C4: got 'n.a.'
## Warning: Expecting numeric in D24109 / R24109C4: got 'n.a.'
## Warning: Expecting numeric in D24110 / R24110C4: got 'n.a.'
## Warning: Expecting numeric in D24111 / R24111C4: got 'n.a.'
## Warning: Expecting numeric in D24112 / R24112C4: got 'n.a.'
## Warning: Expecting numeric in D24113 / R24113C4: got 'n.a.'
## Warning: Expecting numeric in D24114 / R24114C4: got 'n.a.'
## Warning: Expecting numeric in D24115 / R24115C4: got 'n.a.'
## Warning: Expecting numeric in D24116 / R24116C4: got 'n.a.'
## Warning: Expecting numeric in D24117 / R24117C4: got 'n.a.'
## Warning: Expecting numeric in D24118 / R24118C4: got 'n.a.'
## Warning: Expecting numeric in D24119 / R24119C4: got 'n.a.'
## Warning: Expecting numeric in D24120 / R24120C4: got 'n.a.'
## Warning: Expecting numeric in D24121 / R24121C4: got 'n.a.'
## Warning: Expecting numeric in D24122 / R24122C4: got 'n.a.'
## Warning: Expecting numeric in D24123 / R24123C4: got 'n.a.'
## Warning: Expecting numeric in D24124 / R24124C4: got 'n.a.'
## Warning: Expecting numeric in D24125 / R24125C4: got 'n.a.'
## Warning: Expecting numeric in D24126 / R24126C4: got 'n.a.'
## Warning: Expecting numeric in D24127 / R24127C4: got 'n.a.'
## Warning: Expecting numeric in D24128 / R24128C4: got 'n.a.'
## Warning: Expecting numeric in D24129 / R24129C4: got 'n.a.'
## Warning: Expecting numeric in D24130 / R24130C4: got 'n.a.'
## Warning: Expecting numeric in D24131 / R24131C4: got 'n.a.'
## Warning: Expecting numeric in D24132 / R24132C4: got 'n.a.'
## Warning: Expecting numeric in D24133 / R24133C4: got 'n.a.'
## Warning: Expecting numeric in D24134 / R24134C4: got 'n.a.'
## Warning: Expecting numeric in D24135 / R24135C4: got 'n.a.'
## Warning: Expecting numeric in D24136 / R24136C4: got 'n.a.'
## Warning: Expecting numeric in D24137 / R24137C4: got 'n.a.'
## Warning: Expecting numeric in D24138 / R24138C4: got 'n.a.'
## Warning: Expecting numeric in D24139 / R24139C4: got 'n.a.'
## Warning: Expecting numeric in D24140 / R24140C4: got 'n.a.'
## Warning: Expecting numeric in D24141 / R24141C4: got 'n.a.'
## Warning: Expecting numeric in D24142 / R24142C4: got 'n.a.'
## Warning: Expecting numeric in D24143 / R24143C4: got 'n.a.'
## Warning: Expecting numeric in D24144 / R24144C4: got 'n.a.'
## Warning: Expecting numeric in D24145 / R24145C4: got 'n.a.'
## Warning: Expecting numeric in D24146 / R24146C4: got 'n.a.'
## Warning: Expecting numeric in D24147 / R24147C4: got 'n.a.'
## Warning: Expecting numeric in D24148 / R24148C4: got 'n.a.'
## Warning: Expecting numeric in D24149 / R24149C4: got 'n.a.'
## Warning: Expecting numeric in D24150 / R24150C4: got 'n.a.'
## Warning: Expecting numeric in D24151 / R24151C4: got 'n.a.'
## Warning: Expecting numeric in D24152 / R24152C4: got 'n.a.'
## Warning: Expecting numeric in D24153 / R24153C4: got 'n.a.'
## Warning: Expecting numeric in D24154 / R24154C4: got 'n.a.'
## Warning: Expecting numeric in D24155 / R24155C4: got 'n.a.'
## Warning: Expecting numeric in D24156 / R24156C4: got 'n.a.'
## Warning: Expecting numeric in D24157 / R24157C4: got 'n.a.'
## Warning: Expecting numeric in D24158 / R24158C4: got 'n.a.'
## Warning: Expecting numeric in D24159 / R24159C4: got 'n.a.'
## Warning: Expecting numeric in D24160 / R24160C4: got 'n.a.'
## Warning: Expecting numeric in D24161 / R24161C4: got 'n.a.'
## Warning: Expecting numeric in D24162 / R24162C4: got 'n.a.'
## Warning: Expecting numeric in D24163 / R24163C4: got 'n.a.'
## Warning: Expecting numeric in D24164 / R24164C4: got 'n.a.'
## Warning: Expecting numeric in D24165 / R24165C4: got 'n.a.'
## Warning: Expecting numeric in D24166 / R24166C4: got 'n.a.'
## Warning: Expecting numeric in D24167 / R24167C4: got 'n.a.'
## Warning: Expecting numeric in D24168 / R24168C4: got 'n.a.'
## Warning: Expecting numeric in D24169 / R24169C4: got 'n.a.'
## Warning: Expecting numeric in D24170 / R24170C4: got 'n.a.'
## Warning: Expecting numeric in D24171 / R24171C4: got 'n.a.'
## Warning: Expecting numeric in D24172 / R24172C4: got 'n.a.'
## Warning: Expecting numeric in D24173 / R24173C4: got 'n.a.'
## Warning: Expecting numeric in D24174 / R24174C4: got 'n.a.'
## Warning: Expecting numeric in D24175 / R24175C4: got 'n.a.'
## Warning: Expecting numeric in D24176 / R24176C4: got 'n.a.'
## Warning: Expecting numeric in D24177 / R24177C4: got 'n.a.'
## Warning: Expecting numeric in D24178 / R24178C4: got 'n.a.'
## Warning: Expecting numeric in D24179 / R24179C4: got 'n.a.'
## Warning: Expecting numeric in D24180 / R24180C4: got 'n.a.'
## Warning: Expecting numeric in D24181 / R24181C4: got 'n.a.'
## Warning: Expecting numeric in D24182 / R24182C4: got 'n.a.'
## Warning: Expecting numeric in D24183 / R24183C4: got 'n.a.'
## Warning: Expecting numeric in D24184 / R24184C4: got 'n.a.'
## Warning: Expecting numeric in D24185 / R24185C4: got 'n.a.'
## Warning: Expecting numeric in D24186 / R24186C4: got 'n.a.'
## Warning: Expecting numeric in D24187 / R24187C4: got 'n.a.'
## Warning: Expecting numeric in D24188 / R24188C4: got 'n.a.'
## Warning: Expecting numeric in D24189 / R24189C4: got 'n.a.'
## Warning: Expecting numeric in D24190 / R24190C4: got 'n.a.'
## Warning: Expecting numeric in D24191 / R24191C4: got 'n.a.'
## Warning: Expecting numeric in D24192 / R24192C4: got 'n.a.'
## Warning: Expecting numeric in D24193 / R24193C4: got 'n.a.'
## Warning: Expecting numeric in D24194 / R24194C4: got 'n.a.'
## Warning: Expecting numeric in D24195 / R24195C4: got 'n.a.'
## Warning: Expecting numeric in D24196 / R24196C4: got 'n.a.'
## Warning: Expecting numeric in D24197 / R24197C4: got 'n.a.'
## Warning: Expecting numeric in D24198 / R24198C4: got 'n.a.'
## Warning: Expecting numeric in D24199 / R24199C4: got 'n.a.'
## Warning: Expecting numeric in D24200 / R24200C4: got 'n.a.'
## Warning: Expecting numeric in D24201 / R24201C4: got 'n.a.'
## Warning: Expecting numeric in D24202 / R24202C4: got 'n.a.'
## Warning: Expecting numeric in D24203 / R24203C4: got 'n.a.'
## Warning: Expecting numeric in D24204 / R24204C4: got 'n.a.'
## Warning: Expecting numeric in D24205 / R24205C4: got 'n.a.'
## Warning: Expecting numeric in D24206 / R24206C4: got 'n.a.'
## Warning: Expecting numeric in D24207 / R24207C4: got 'n.a.'
## Warning: Expecting numeric in D24208 / R24208C4: got 'n.a.'
## Warning: Expecting numeric in D24209 / R24209C4: got 'n.a.'
## Warning: Expecting numeric in D24210 / R24210C4: got 'n.a.'
## Warning: Expecting numeric in D24211 / R24211C4: got 'n.a.'
## Warning: Expecting numeric in D24212 / R24212C4: got 'n.a.'
## Warning: Expecting numeric in D24213 / R24213C4: got 'n.a.'
## Warning: Expecting numeric in D24214 / R24214C4: got 'n.a.'
## Warning: Expecting numeric in D24215 / R24215C4: got 'n.a.'
## Warning: Expecting numeric in D24216 / R24216C4: got 'n.a.'
## Warning: Expecting numeric in D24217 / R24217C4: got 'n.a.'
## Warning: Expecting numeric in D24218 / R24218C4: got 'n.a.'
## Warning: Expecting numeric in D24219 / R24219C4: got 'n.a.'
## Warning: Expecting numeric in D24220 / R24220C4: got 'n.a.'
## Warning: Expecting numeric in D24221 / R24221C4: got 'n.a.'
## Warning: Expecting numeric in D24222 / R24222C4: got 'n.a.'
## Warning: Expecting numeric in D24223 / R24223C4: got 'n.a.'
## Warning: Expecting numeric in D24224 / R24224C4: got 'n.a.'
## Warning: Expecting numeric in D24225 / R24225C4: got 'n.a.'
## Warning: Expecting numeric in D24226 / R24226C4: got 'n.a.'
## Warning: Expecting numeric in D24227 / R24227C4: got 'n.a.'
## Warning: Expecting numeric in D24228 / R24228C4: got 'n.a.'
## Warning: Expecting numeric in D24229 / R24229C4: got 'n.a.'
## Warning: Expecting numeric in D24230 / R24230C4: got 'n.a.'
## Warning: Expecting numeric in D24231 / R24231C4: got 'n.a.'
## Warning: Expecting numeric in D24232 / R24232C4: got 'n.a.'
## Warning: Expecting numeric in D24233 / R24233C4: got 'n.a.'
## Warning: Expecting numeric in D24234 / R24234C4: got 'n.a.'
## Warning: Expecting numeric in D24235 / R24235C4: got 'n.a.'
## Warning: Expecting numeric in D24236 / R24236C4: got 'n.a.'
## Warning: Expecting numeric in D24237 / R24237C4: got 'n.a.'
## Warning: Expecting numeric in D24238 / R24238C4: got 'n.a.'
## Warning: Expecting numeric in D24239 / R24239C4: got 'n.a.'
## Warning: Expecting numeric in D24240 / R24240C4: got 'n.a.'
## Warning: Expecting numeric in D24241 / R24241C4: got 'n.a.'
## Warning: Expecting numeric in D24242 / R24242C4: got 'n.a.'
## Warning: Expecting numeric in D24243 / R24243C4: got 'n.a.'
## Warning: Expecting numeric in D24244 / R24244C4: got 'n.a.'
## Warning: Expecting numeric in D24245 / R24245C4: got 'n.a.'
## Warning: Expecting numeric in D24246 / R24246C4: got 'n.a.'
## Warning: Expecting numeric in D24247 / R24247C4: got 'n.a.'
## Warning: Expecting numeric in D24248 / R24248C4: got 'n.a.'
## Warning: Expecting numeric in D24249 / R24249C4: got 'n.a.'
## Warning: Expecting numeric in D24250 / R24250C4: got 'n.a.'
## Warning: Expecting numeric in D24251 / R24251C4: got 'n.a.'
## Warning: Expecting numeric in D24252 / R24252C4: got 'n.a.'
## Warning: Expecting numeric in D24253 / R24253C4: got 'n.a.'
## Warning: Expecting numeric in D24254 / R24254C4: got 'n.a.'
## Warning: Expecting numeric in D24255 / R24255C4: got 'n.a.'
## Warning: Expecting numeric in D24256 / R24256C4: got 'n.a.'
## Warning: Expecting numeric in D24257 / R24257C4: got 'n.a.'
## Warning: Expecting numeric in D24258 / R24258C4: got 'n.a.'
## Warning: Expecting numeric in D24259 / R24259C4: got 'n.a.'
## Warning: Expecting numeric in D24260 / R24260C4: got 'n.a.'
## Warning: Expecting numeric in D24261 / R24261C4: got 'n.a.'
## Warning: Expecting numeric in D24262 / R24262C4: got 'n.a.'
## Warning: Expecting numeric in D24263 / R24263C4: got 'n.a.'
## Warning: Expecting numeric in D24264 / R24264C4: got 'n.a.'
## Warning: Expecting numeric in D24265 / R24265C4: got 'n.a.'
## Warning: Expecting numeric in D24266 / R24266C4: got 'n.a.'
## Warning: Expecting numeric in D24267 / R24267C4: got 'n.a.'
## Warning: Expecting numeric in D24268 / R24268C4: got 'n.a.'
## Warning: Expecting numeric in D24269 / R24269C4: got 'n.a.'
## Warning: Expecting numeric in D24270 / R24270C4: got 'n.a.'
## Warning: Expecting numeric in D24271 / R24271C4: got 'n.a.'
## Warning: Expecting numeric in D24272 / R24272C4: got 'n.a.'
## Warning: Expecting numeric in D24273 / R24273C4: got 'n.a.'
## Warning: Expecting numeric in D24274 / R24274C4: got 'n.a.'
## Warning: Expecting numeric in D24275 / R24275C4: got 'n.a.'
## Warning: Expecting numeric in D24276 / R24276C4: got 'n.a.'
## Warning: Expecting numeric in D24277 / R24277C4: got 'n.a.'
## Warning: Expecting numeric in D24278 / R24278C4: got 'n.a.'
## Warning: Expecting numeric in D24279 / R24279C4: got 'n.a.'
## Warning: Expecting numeric in D24280 / R24280C4: got 'n.a.'
## Warning: Expecting numeric in D24281 / R24281C4: got 'n.a.'
## Warning: Expecting numeric in D24282 / R24282C4: got 'n.a.'
## Warning: Expecting numeric in D24283 / R24283C4: got 'n.a.'
## Warning: Expecting numeric in D24284 / R24284C4: got 'n.a.'
## Warning: Expecting numeric in D24285 / R24285C4: got 'n.a.'
## Warning: Expecting numeric in D24286 / R24286C4: got 'n.a.'
## Warning: Expecting numeric in D24287 / R24287C4: got 'n.a.'
## Warning: Expecting numeric in D24288 / R24288C4: got 'n.a.'
## Warning: Expecting numeric in D24289 / R24289C4: got 'n.a.'
## Warning: Expecting numeric in D24290 / R24290C4: got 'n.a.'
## Warning: Expecting numeric in D24291 / R24291C4: got 'n.a.'
## Warning: Expecting numeric in D24292 / R24292C4: got 'n.a.'
## Warning: Expecting numeric in D24293 / R24293C4: got 'n.a.'
## Warning: Expecting numeric in D24294 / R24294C4: got 'n.a.'
## Warning: Expecting numeric in D24295 / R24295C4: got 'n.a.'
## Warning: Expecting numeric in D24296 / R24296C4: got 'n.a.'
## Warning: Expecting numeric in D24297 / R24297C4: got 'n.a.'
## Warning: Expecting numeric in D24298 / R24298C4: got 'n.a.'
## Warning: Expecting numeric in D24299 / R24299C4: got 'n.a.'
## Warning: Expecting numeric in D24300 / R24300C4: got 'n.a.'
## Warning: Expecting numeric in D24301 / R24301C4: got 'n.a.'
## Warning: Expecting numeric in D24302 / R24302C4: got 'n.a.'
## Warning: Expecting numeric in D24303 / R24303C4: got 'n.a.'
## Warning: Expecting numeric in D24304 / R24304C4: got 'n.a.'
## Warning: Expecting numeric in D24305 / R24305C4: got 'n.a.'
## Warning: Expecting numeric in D24306 / R24306C4: got 'n.a.'
## Warning: Expecting numeric in D24307 / R24307C4: got 'n.a.'
## Warning: Expecting numeric in D24308 / R24308C4: got 'n.a.'
## Warning: Expecting numeric in D24309 / R24309C4: got 'n.a.'
## Warning: Expecting numeric in D24310 / R24310C4: got 'n.a.'
## Warning: Expecting numeric in D24311 / R24311C4: got 'n.a.'
## Warning: Expecting numeric in D24312 / R24312C4: got 'n.a.'
## Warning: Expecting numeric in D24313 / R24313C4: got 'n.a.'
## Warning: Expecting numeric in D24314 / R24314C4: got 'n.a.'
## Warning: Expecting numeric in D24315 / R24315C4: got 'n.a.'
## Warning: Expecting numeric in D24316 / R24316C4: got 'n.a.'
## Warning: Expecting numeric in D24317 / R24317C4: got 'n.a.'
## Warning: Expecting numeric in D24318 / R24318C4: got 'n.a.'
## Warning: Expecting numeric in D24319 / R24319C4: got 'n.a.'
## Warning: Expecting numeric in D24320 / R24320C4: got 'n.a.'
## Warning: Expecting numeric in D24321 / R24321C4: got 'n.a.'
## Warning: Expecting numeric in D24322 / R24322C4: got 'n.a.'
## Warning: Expecting numeric in D24323 / R24323C4: got 'n.a.'
## Warning: Expecting numeric in D24324 / R24324C4: got 'n.a.'
## Warning: Expecting numeric in D24325 / R24325C4: got 'n.a.'
## Warning: Expecting numeric in D24326 / R24326C4: got 'n.a.'
## Warning: Expecting numeric in D24327 / R24327C4: got 'n.a.'
## Warning: Expecting numeric in D24328 / R24328C4: got 'n.a.'
## Warning: Expecting numeric in D24329 / R24329C4: got 'n.a.'
## Warning: Expecting numeric in D24330 / R24330C4: got 'n.a.'
## Warning: Expecting numeric in D24331 / R24331C4: got 'n.a.'
## Warning: Expecting numeric in D24332 / R24332C4: got 'n.a.'
## Warning: Expecting numeric in D24333 / R24333C4: got 'n.a.'
## Warning: Expecting numeric in D24334 / R24334C4: got 'n.a.'
## Warning: Expecting numeric in D24335 / R24335C4: got 'n.a.'
## Warning: Expecting numeric in D24336 / R24336C4: got 'n.a.'
## Warning: Expecting numeric in D24337 / R24337C4: got 'n.a.'
## Warning: Expecting numeric in D24338 / R24338C4: got 'n.a.'
## Warning: Expecting numeric in D24339 / R24339C4: got 'n.a.'
## Warning: Expecting numeric in D24340 / R24340C4: got 'n.a.'
## Warning: Expecting numeric in D24341 / R24341C4: got 'n.a.'
## Warning: Expecting numeric in D24342 / R24342C4: got 'n.a.'
## Warning: Expecting numeric in D24343 / R24343C4: got 'n.a.'
## Warning: Expecting numeric in D24344 / R24344C4: got 'n.a.'
## Warning: Expecting numeric in D24345 / R24345C4: got 'n.a.'
## Warning: Expecting numeric in D24346 / R24346C4: got 'n.a.'
## Warning: Expecting numeric in D24347 / R24347C4: got 'n.a.'
## Warning: Expecting numeric in D24348 / R24348C4: got 'n.a.'
## Warning: Expecting numeric in D24349 / R24349C4: got 'n.a.'
## Warning: Expecting numeric in D24350 / R24350C4: got 'n.a.'
## Warning: Expecting numeric in D24351 / R24351C4: got 'n.a.'
## Warning: Expecting numeric in D24352 / R24352C4: got 'n.a.'
## Warning: Expecting numeric in D24353 / R24353C4: got 'n.a.'
## Warning: Expecting numeric in D24354 / R24354C4: got 'n.a.'
## Warning: Expecting numeric in D24355 / R24355C4: got 'n.a.'
## Warning: Expecting numeric in D24356 / R24356C4: got 'n.a.'
## Warning: Expecting numeric in D24357 / R24357C4: got 'n.a.'
## Warning: Expecting numeric in D24358 / R24358C4: got 'n.a.'
## Warning: Expecting numeric in D24359 / R24359C4: got 'n.a.'
## Warning: Expecting numeric in D24360 / R24360C4: got 'n.a.'
## Warning: Expecting numeric in D24361 / R24361C4: got 'n.a.'
## Warning: Expecting numeric in D24362 / R24362C4: got 'n.a.'
## Warning: Expecting numeric in D24363 / R24363C4: got 'n.a.'
## Warning: Expecting numeric in D24364 / R24364C4: got 'n.a.'
## Warning: Expecting numeric in D24365 / R24365C4: got 'n.a.'
## Warning: Expecting numeric in D24366 / R24366C4: got 'n.a.'
## Warning: Expecting numeric in D24367 / R24367C4: got 'n.a.'
## Warning: Expecting numeric in D24368 / R24368C4: got 'n.a.'
## Warning: Expecting numeric in D24369 / R24369C4: got 'n.a.'
## Warning: Expecting numeric in D24370 / R24370C4: got 'n.a.'
## Warning: Expecting numeric in D24371 / R24371C4: got 'n.a.'
## Warning: Expecting numeric in D24372 / R24372C4: got 'n.a.'
## Warning: Expecting numeric in D24373 / R24373C4: got 'n.a.'
## Warning: Expecting numeric in D24374 / R24374C4: got 'n.a.'
## Warning: Expecting numeric in D24375 / R24375C4: got 'n.a.'
## Warning: Expecting numeric in D24376 / R24376C4: got 'n.a.'
## Warning: Expecting numeric in D24377 / R24377C4: got 'n.a.'
## Warning: Expecting numeric in D24378 / R24378C4: got 'n.a.'
## Warning: Expecting numeric in D24379 / R24379C4: got 'n.a.'
## Warning: Expecting numeric in D24380 / R24380C4: got 'n.a.'
## Warning: Expecting numeric in D24381 / R24381C4: got 'n.a.'
## Warning: Expecting numeric in D24382 / R24382C4: got 'n.a.'
## Warning: Expecting numeric in D24383 / R24383C4: got 'n.a.'
## Warning: Expecting numeric in D24384 / R24384C4: got 'n.a.'
## Warning: Expecting numeric in D24385 / R24385C4: got 'n.a.'
## Warning: Expecting numeric in D24386 / R24386C4: got 'n.a.'
## Warning: Expecting numeric in D24387 / R24387C4: got 'n.a.'
## Warning: Expecting numeric in D24388 / R24388C4: got 'n.a.'
## Warning: Expecting numeric in D24389 / R24389C4: got 'n.a.'
## Warning: Expecting numeric in D24390 / R24390C4: got 'n.a.'
## Warning: Expecting numeric in D24391 / R24391C4: got 'n.a.'
## Warning: Expecting numeric in D24392 / R24392C4: got 'n.a.'
## Warning: Expecting numeric in D24393 / R24393C4: got 'n.a.'
## Warning: Expecting numeric in D24394 / R24394C4: got 'n.a.'
## Warning: Expecting numeric in D24395 / R24395C4: got 'n.a.'
## Warning: Expecting numeric in D24396 / R24396C4: got 'n.a.'
## Warning: Expecting numeric in D24397 / R24397C4: got 'n.a.'
## Warning: Expecting numeric in D24398 / R24398C4: got 'n.a.'
## Warning: Expecting numeric in D24399 / R24399C4: got 'n.a.'
## Warning: Expecting numeric in D24400 / R24400C4: got 'n.a.'
## Warning: Expecting numeric in D24401 / R24401C4: got 'n.a.'
## Warning: Expecting numeric in D24402 / R24402C4: got 'n.a.'
## Warning: Expecting numeric in D24403 / R24403C4: got 'n.a.'
## Warning: Expecting numeric in D24404 / R24404C4: got 'n.a.'
## Warning: Expecting numeric in D24405 / R24405C4: got 'n.a.'
## Warning: Expecting numeric in D24406 / R24406C4: got 'n.a.'
## Warning: Expecting numeric in D24407 / R24407C4: got 'n.a.'
## Warning: Expecting numeric in D24408 / R24408C4: got 'n.a.'
## Warning: Expecting numeric in D24409 / R24409C4: got 'n.a.'
## Warning: Expecting numeric in D24410 / R24410C4: got 'n.a.'
## Warning: Expecting numeric in D24411 / R24411C4: got 'n.a.'
## Warning: Expecting numeric in D24412 / R24412C4: got 'n.a.'
## Warning: Expecting numeric in D24413 / R24413C4: got 'n.a.'
## Warning: Expecting numeric in D24414 / R24414C4: got 'n.a.'
## Warning: Expecting numeric in D24415 / R24415C4: got 'n.a.'
## Warning: Expecting numeric in D24416 / R24416C4: got 'n.a.'
## Warning: Expecting numeric in D24417 / R24417C4: got 'n.a.'
## Warning: Expecting numeric in D24418 / R24418C4: got 'n.a.'
## Warning: Expecting numeric in D24419 / R24419C4: got 'n.a.'
## Warning: Expecting numeric in D24420 / R24420C4: got 'n.a.'
## Warning: Expecting numeric in D24421 / R24421C4: got 'n.a.'
## Warning: Expecting numeric in D24422 / R24422C4: got 'n.a.'
## Warning: Expecting numeric in D24423 / R24423C4: got 'n.a.'
## Warning: Expecting numeric in D24424 / R24424C4: got 'n.a.'
## Warning: Expecting numeric in D24425 / R24425C4: got 'n.a.'
## Warning: Expecting numeric in D24426 / R24426C4: got 'n.a.'
## Warning: Expecting numeric in D24427 / R24427C4: got 'n.a.'
## Warning: Expecting numeric in D24428 / R24428C4: got 'n.a.'
## Warning: Expecting numeric in D24429 / R24429C4: got 'n.a.'
## Warning: Expecting numeric in D24430 / R24430C4: got 'n.a.'
## Warning: Expecting numeric in D24431 / R24431C4: got 'n.a.'
## Warning: Expecting numeric in D24432 / R24432C4: got 'n.a.'
## Warning: Expecting numeric in D24433 / R24433C4: got 'n.a.'
## Warning: Expecting numeric in D24434 / R24434C4: got 'n.a.'
## Warning: Expecting numeric in D24435 / R24435C4: got 'n.a.'
## Warning: Expecting numeric in D24436 / R24436C4: got 'n.a.'
## Warning: Expecting numeric in D24437 / R24437C4: got 'n.a.'
## Warning: Expecting numeric in D24438 / R24438C4: got 'n.a.'
## Warning: Expecting numeric in D24439 / R24439C4: got 'n.a.'
## Warning: Expecting numeric in D24440 / R24440C4: got 'n.a.'
## Warning: Expecting numeric in D24441 / R24441C4: got 'n.a.'
## Warning: Expecting numeric in D24442 / R24442C4: got 'n.a.'
## Warning: Expecting numeric in D24443 / R24443C4: got 'n.a.'
## Warning: Expecting numeric in D24444 / R24444C4: got 'n.a.'
## Warning: Expecting numeric in D24445 / R24445C4: got 'n.a.'
## Warning: Expecting numeric in D24446 / R24446C4: got 'n.a.'
## Warning: Expecting numeric in D24447 / R24447C4: got 'n.a.'
## Warning: Expecting numeric in D24448 / R24448C4: got 'n.a.'
## Warning: Expecting numeric in D24449 / R24449C4: got 'n.a.'
## Warning: Expecting numeric in D24450 / R24450C4: got 'n.a.'
## Warning: Expecting numeric in D24451 / R24451C4: got 'n.a.'
## Warning: Expecting numeric in D24452 / R24452C4: got 'n.a.'
## Warning: Expecting numeric in D24453 / R24453C4: got 'n.a.'
## Warning: Expecting numeric in D24454 / R24454C4: got 'n.a.'
## Warning: Expecting numeric in D24455 / R24455C4: got 'n.a.'
## Warning: Expecting numeric in D24456 / R24456C4: got 'n.a.'
## Warning: Expecting numeric in D24457 / R24457C4: got 'n.a.'
## Warning: Expecting numeric in D24458 / R24458C4: got 'n.a.'
## Warning: Expecting numeric in D24459 / R24459C4: got 'n.a.'
## Warning: Expecting numeric in D24460 / R24460C4: got 'n.a.'
## Warning: Expecting numeric in D24461 / R24461C4: got 'n.a.'
## Warning: Expecting numeric in D24462 / R24462C4: got 'n.a.'
## Warning: Expecting numeric in D24463 / R24463C4: got 'n.a.'
## Warning: Expecting numeric in D24464 / R24464C4: got 'n.a.'
## Warning: Expecting numeric in D24465 / R24465C4: got 'n.a.'
## Warning: Expecting numeric in D24466 / R24466C4: got 'n.a.'
## Warning: Expecting numeric in D24467 / R24467C4: got 'n.a.'
## Warning: Expecting numeric in D24468 / R24468C4: got 'n.a.'
## Warning: Expecting numeric in D24469 / R24469C4: got 'n.a.'
## Warning: Expecting numeric in D24470 / R24470C4: got 'n.a.'
## Warning: Expecting numeric in D24471 / R24471C4: got 'n.a.'
## Warning: Expecting numeric in D24472 / R24472C4: got 'n.a.'
## Warning: Expecting numeric in D24473 / R24473C4: got 'n.a.'
## Warning: Expecting numeric in D24474 / R24474C4: got 'n.a.'
## Warning: Expecting numeric in D24475 / R24475C4: got 'n.a.'
## Warning: Expecting numeric in D24476 / R24476C4: got 'n.a.'
## Warning: Expecting numeric in D24477 / R24477C4: got 'n.a.'
## Warning: Expecting numeric in D24478 / R24478C4: got 'n.a.'
## Warning: Expecting numeric in D24479 / R24479C4: got 'n.a.'
## Warning: Expecting numeric in D24480 / R24480C4: got 'n.a.'
## Warning: Expecting numeric in D24481 / R24481C4: got 'n.a.'
## Warning: Expecting numeric in D24482 / R24482C4: got 'n.a.'
## Warning: Expecting numeric in D24483 / R24483C4: got 'n.a.'
## Warning: Expecting numeric in D24484 / R24484C4: got 'n.a.'
## Warning: Expecting numeric in D24485 / R24485C4: got 'n.a.'
## Warning: Expecting numeric in D24486 / R24486C4: got 'n.a.'
## Warning: Expecting numeric in D24487 / R24487C4: got 'n.a.'
## Warning: Expecting numeric in D24488 / R24488C4: got 'n.a.'
## Warning: Expecting numeric in D24489 / R24489C4: got 'n.a.'
## Warning: Expecting numeric in D24490 / R24490C4: got 'n.a.'
## Warning: Expecting numeric in D24491 / R24491C4: got 'n.a.'
## Warning: Expecting numeric in D24492 / R24492C4: got 'n.a.'
## Warning: Expecting numeric in D24493 / R24493C4: got 'n.a.'
## Warning: Expecting numeric in D24494 / R24494C4: got 'n.a.'
## Warning: Expecting numeric in D24495 / R24495C4: got 'n.a.'
## Warning: Expecting numeric in D24496 / R24496C4: got 'n.a.'
## Warning: Expecting numeric in D24497 / R24497C4: got 'n.a.'
## Warning: Expecting numeric in D24498 / R24498C4: got 'n.a.'
## Warning: Expecting numeric in D24499 / R24499C4: got 'n.a.'
## Warning: Expecting numeric in D24500 / R24500C4: got 'n.a.'
## Warning: Expecting numeric in D24501 / R24501C4: got 'n.a.'
## Warning: Expecting numeric in D24502 / R24502C4: got 'n.a.'
## Warning: Expecting numeric in D24503 / R24503C4: got 'n.a.'
## Warning: Expecting numeric in D24504 / R24504C4: got 'n.a.'
## Warning: Expecting numeric in D24505 / R24505C4: got 'n.a.'
## Warning: Expecting numeric in D24506 / R24506C4: got 'n.a.'
## Warning: Expecting numeric in D24507 / R24507C4: got 'n.a.'
## Warning: Expecting numeric in D24508 / R24508C4: got 'n.a.'
## Warning: Expecting numeric in D24509 / R24509C4: got 'n.a.'
## Warning: Expecting numeric in D24510 / R24510C4: got 'n.a.'
## Warning: Expecting numeric in D24511 / R24511C4: got 'n.a.'
## Warning: Expecting numeric in D24512 / R24512C4: got 'n.a.'
## Warning: Expecting numeric in D24513 / R24513C4: got 'n.a.'
## Warning: Expecting numeric in D24514 / R24514C4: got 'n.a.'
## Warning: Expecting numeric in D24515 / R24515C4: got 'n.a.'
## Warning: Expecting numeric in D24516 / R24516C4: got 'n.a.'
## Warning: Expecting numeric in D24517 / R24517C4: got 'n.a.'
## Warning: Expecting numeric in D24518 / R24518C4: got 'n.a.'
## Warning: Expecting numeric in D24519 / R24519C4: got 'n.a.'
## Warning: Expecting numeric in D24520 / R24520C4: got 'n.a.'
## Warning: Expecting numeric in D24521 / R24521C4: got 'n.a.'
## Warning: Expecting numeric in D24522 / R24522C4: got 'n.a.'
## Warning: Expecting numeric in D24523 / R24523C4: got 'n.a.'
## Warning: Expecting numeric in D24524 / R24524C4: got 'n.a.'
## Warning: Expecting numeric in D24525 / R24525C4: got 'n.a.'
## Warning: Expecting numeric in D24526 / R24526C4: got 'n.a.'
## Warning: Expecting numeric in D24527 / R24527C4: got 'n.a.'
## Warning: Expecting numeric in D24528 / R24528C4: got 'n.a.'
## Warning: Expecting numeric in D24529 / R24529C4: got 'n.a.'
## Warning: Expecting numeric in D24530 / R24530C4: got 'n.a.'
## Warning: Expecting numeric in D24531 / R24531C4: got 'n.a.'
## Warning: Expecting numeric in D24532 / R24532C4: got 'n.a.'
## Warning: Expecting numeric in D24533 / R24533C4: got 'n.a.'
## Warning: Expecting numeric in D24534 / R24534C4: got 'n.a.'
## Warning: Expecting numeric in D24535 / R24535C4: got 'n.a.'
## Warning: Expecting numeric in D24536 / R24536C4: got 'n.a.'
## Warning: Expecting numeric in D24537 / R24537C4: got 'n.a.'
## Warning: Expecting numeric in D24538 / R24538C4: got 'n.a.'
## Warning: Expecting numeric in D24539 / R24539C4: got 'n.a.'
## Warning: Expecting numeric in D24540 / R24540C4: got 'n.a.'
## Warning: Expecting numeric in D24541 / R24541C4: got 'n.a.'
## Warning: Expecting numeric in D24542 / R24542C4: got 'n.a.'
## Warning: Expecting numeric in D24543 / R24543C4: got 'n.a.'
## Warning: Expecting numeric in D24544 / R24544C4: got 'n.a.'
## Warning: Expecting numeric in D24545 / R24545C4: got 'n.a.'
## Warning: Expecting numeric in D24546 / R24546C4: got 'n.a.'
## Warning: Expecting numeric in D24547 / R24547C4: got 'n.a.'
## Warning: Expecting numeric in D24548 / R24548C4: got 'n.a.'
## Warning: Expecting numeric in D24549 / R24549C4: got 'n.a.'
## Warning: Expecting numeric in D24550 / R24550C4: got 'n.a.'
## Warning: Expecting numeric in D24551 / R24551C4: got 'n.a.'
## Warning: Expecting numeric in D24552 / R24552C4: got 'n.a.'
## Warning: Expecting numeric in D24553 / R24553C4: got 'n.a.'
## Warning: Expecting numeric in D24554 / R24554C4: got 'n.a.'
## Warning: Expecting numeric in D24555 / R24555C4: got 'n.a.'
## Warning: Expecting numeric in D24556 / R24556C4: got 'n.a.'
## Warning: Expecting numeric in D24557 / R24557C4: got 'n.a.'
## Warning: Expecting numeric in D24558 / R24558C4: got 'n.a.'
## Warning: Expecting numeric in D24559 / R24559C4: got 'n.a.'
## Warning: Expecting numeric in D24560 / R24560C4: got 'n.a.'
## Warning: Expecting numeric in D24561 / R24561C4: got 'n.a.'
## Warning: Expecting numeric in D24562 / R24562C4: got 'n.a.'
## Warning: Expecting numeric in D24563 / R24563C4: got 'n.a.'
## Warning: Expecting numeric in D24564 / R24564C4: got 'n.a.'
## Warning: Expecting numeric in D24565 / R24565C4: got 'n.a.'
## Warning: Expecting numeric in D24566 / R24566C4: got 'n.a.'
## Warning: Expecting numeric in D24567 / R24567C4: got 'n.a.'
## Warning: Expecting numeric in D24568 / R24568C4: got 'n.a.'
## Warning: Expecting numeric in D24569 / R24569C4: got 'n.a.'
## Warning: Expecting numeric in D24570 / R24570C4: got 'n.a.'
## Warning: Expecting numeric in D24571 / R24571C4: got 'n.a.'
## Warning: Expecting numeric in D24572 / R24572C4: got 'n.a.'
## Warning: Expecting numeric in D24573 / R24573C4: got 'n.a.'
## Warning: Expecting numeric in D24574 / R24574C4: got 'n.a.'
## Warning: Expecting numeric in D24575 / R24575C4: got 'n.a.'
## Warning: Expecting numeric in D24576 / R24576C4: got 'n.a.'
## Warning: Expecting numeric in D24577 / R24577C4: got 'n.a.'
## Warning: Expecting numeric in D24578 / R24578C4: got 'n.a.'
## Warning: Expecting numeric in D24579 / R24579C4: got 'n.a.'
## Warning: Expecting numeric in D24580 / R24580C4: got 'n.a.'
## Warning: Expecting numeric in D24581 / R24581C4: got 'n.a.'
## Warning: Expecting numeric in D24582 / R24582C4: got 'n.a.'
## Warning: Expecting numeric in D24583 / R24583C4: got 'n.a.'
## Warning: Expecting numeric in D24584 / R24584C4: got 'n.a.'
## Warning: Expecting numeric in D24585 / R24585C4: got 'n.a.'
## Warning: Expecting numeric in D24586 / R24586C4: got 'n.a.'
## Warning: Expecting numeric in D24587 / R24587C4: got 'n.a.'
## Warning: Expecting numeric in D24588 / R24588C4: got 'n.a.'
## Warning: Expecting numeric in D24589 / R24589C4: got 'n.a.'
## Warning: Expecting numeric in D24590 / R24590C4: got 'n.a.'
## Warning: Expecting numeric in D24591 / R24591C4: got 'n.a.'
## Warning: Expecting numeric in D24592 / R24592C4: got 'n.a.'
## Warning: Expecting numeric in D24593 / R24593C4: got 'n.a.'
## Warning: Expecting numeric in D24594 / R24594C4: got 'n.a.'
## Warning: Expecting numeric in D24595 / R24595C4: got 'n.a.'
## Warning: Expecting numeric in D24596 / R24596C4: got 'n.a.'
## Warning: Expecting numeric in D24597 / R24597C4: got 'n.a.'
## Warning: Expecting numeric in D24598 / R24598C4: got 'n.a.'
## Warning: Expecting numeric in D24599 / R24599C4: got 'n.a.'
## Warning: Expecting numeric in D24600 / R24600C4: got 'n.a.'
## Warning: Expecting numeric in D24601 / R24601C4: got 'n.a.'
## Warning: Expecting numeric in D24602 / R24602C4: got 'n.a.'
## Warning: Expecting numeric in D24603 / R24603C4: got 'n.a.'
## Warning: Expecting numeric in D24604 / R24604C4: got 'n.a.'
## Warning: Expecting numeric in D24605 / R24605C4: got 'n.a.'
## Warning: Expecting numeric in D24606 / R24606C4: got 'n.a.'
## Warning: Expecting numeric in D24607 / R24607C4: got 'n.a.'
## Warning: Expecting numeric in D24608 / R24608C4: got 'n.a.'
## Warning: Expecting numeric in D24609 / R24609C4: got 'n.a.'
## Warning: Expecting numeric in D24610 / R24610C4: got 'n.a.'
## Warning: Expecting numeric in D24611 / R24611C4: got 'n.a.'
## Warning: Expecting numeric in D24612 / R24612C4: got 'n.a.'
## Warning: Expecting numeric in D24613 / R24613C4: got 'n.a.'
## Warning: Expecting numeric in D24614 / R24614C4: got 'n.a.'
## Warning: Expecting numeric in D24615 / R24615C4: got 'n.a.'
## Warning: Expecting numeric in D24616 / R24616C4: got 'n.a.'
## Warning: Expecting numeric in D24617 / R24617C4: got 'n.a.'
## Warning: Expecting numeric in D24618 / R24618C4: got 'n.a.'
## Warning: Expecting numeric in D24619 / R24619C4: got 'n.a.'
## Warning: Expecting numeric in D24620 / R24620C4: got 'n.a.'
## Warning: Expecting numeric in D24621 / R24621C4: got 'n.a.'
## Warning: Expecting numeric in D24622 / R24622C4: got 'n.a.'
## Warning: Expecting numeric in D24623 / R24623C4: got 'n.a.'
## Warning: Expecting numeric in D24624 / R24624C4: got 'n.a.'
## Warning: Expecting numeric in D24625 / R24625C4: got 'n.a.'
## Warning: Expecting numeric in D24626 / R24626C4: got 'n.a.'
## Warning: Expecting numeric in D24627 / R24627C4: got 'n.a.'
## Warning: Expecting numeric in D24628 / R24628C4: got 'n.a.'
## Warning: Expecting numeric in D24629 / R24629C4: got 'n.a.'
## Warning: Expecting numeric in D24630 / R24630C4: got 'n.a.'
## Warning: Expecting numeric in D24631 / R24631C4: got 'n.a.'
## Warning: Expecting numeric in D24632 / R24632C4: got 'n.a.'
## Warning: Expecting numeric in D24633 / R24633C4: got 'n.a.'
## Warning: Expecting numeric in D24634 / R24634C4: got 'n.a.'
## Warning: Expecting numeric in D24635 / R24635C4: got 'n.a.'
## Warning: Expecting numeric in D24636 / R24636C4: got 'n.a.'
## Warning: Expecting numeric in D24637 / R24637C4: got 'n.a.'
## Warning: Expecting numeric in D24638 / R24638C4: got 'n.a.'
## Warning: Expecting numeric in D24639 / R24639C4: got 'n.a.'
## Warning: Expecting numeric in D24640 / R24640C4: got 'n.a.'
## Warning: Expecting numeric in D24641 / R24641C4: got 'n.a.'
## Warning: Expecting numeric in D24642 / R24642C4: got 'n.a.'
## Warning: Expecting numeric in D24643 / R24643C4: got 'n.a.'
## Warning: Expecting numeric in D24644 / R24644C4: got 'n.a.'
## Warning: Expecting numeric in D24645 / R24645C4: got 'n.a.'
## Warning: Expecting numeric in D24646 / R24646C4: got 'n.a.'
## Warning: Expecting numeric in D24647 / R24647C4: got 'n.a.'
## Warning: Expecting numeric in D24648 / R24648C4: got 'n.a.'
## Warning: Expecting numeric in D24649 / R24649C4: got 'n.a.'
## Warning: Expecting numeric in D24650 / R24650C4: got 'n.a.'
## Warning: Expecting numeric in D24651 / R24651C4: got 'n.a.'
## Warning: Expecting numeric in D24652 / R24652C4: got 'n.a.'
## Warning: Expecting numeric in D24653 / R24653C4: got 'n.a.'
## Warning: Expecting numeric in D24654 / R24654C4: got 'n.a.'
## Warning: Expecting numeric in D24655 / R24655C4: got 'n.a.'
## Warning: Expecting numeric in D24656 / R24656C4: got 'n.a.'
## Warning: Expecting numeric in D24657 / R24657C4: got 'n.a.'
## Warning: Expecting numeric in D24658 / R24658C4: got 'n.a.'
## Warning: Expecting numeric in D24659 / R24659C4: got 'n.a.'
## Warning: Expecting numeric in D24660 / R24660C4: got 'n.a.'
## Warning: Expecting numeric in D24661 / R24661C4: got 'n.a.'
## Warning: Expecting numeric in D24662 / R24662C4: got 'n.a.'
## Warning: Expecting numeric in D24663 / R24663C4: got 'n.a.'
## Warning: Expecting numeric in D24664 / R24664C4: got 'n.a.'
## Warning: Expecting numeric in D24665 / R24665C4: got 'n.a.'
## Warning: Expecting numeric in D24666 / R24666C4: got 'n.a.'
## Warning: Expecting numeric in D24667 / R24667C4: got 'n.a.'
## Warning: Expecting numeric in D24668 / R24668C4: got 'n.a.'
## Warning: Expecting numeric in D24669 / R24669C4: got 'n.a.'
## Warning: Expecting numeric in D24670 / R24670C4: got 'n.a.'
## Warning: Expecting numeric in D24671 / R24671C4: got 'n.a.'
## Warning: Expecting numeric in D24672 / R24672C4: got 'n.a.'
## Warning: Expecting numeric in D24673 / R24673C4: got 'n.a.'
## Warning: Expecting numeric in D24674 / R24674C4: got 'n.a.'
## Warning: Expecting numeric in D24675 / R24675C4: got 'n.a.'
## Warning: Expecting numeric in D24676 / R24676C4: got 'n.a.'
## Warning: Expecting numeric in D24677 / R24677C4: got 'n.a.'
## Warning: Expecting numeric in D24678 / R24678C4: got 'n.a.'
## Warning: Expecting numeric in D24679 / R24679C4: got 'n.a.'
## Warning: Expecting numeric in D24680 / R24680C4: got 'n.a.'
## Warning: Expecting numeric in D24681 / R24681C4: got 'n.a.'
## Warning: Expecting numeric in D24682 / R24682C4: got 'n.a.'
## Warning: Expecting numeric in D24683 / R24683C4: got 'n.a.'
## Warning: Expecting numeric in D24684 / R24684C4: got 'n.a.'
## Warning: Expecting numeric in D24685 / R24685C4: got 'n.a.'
## Warning: Expecting numeric in D24686 / R24686C4: got 'n.a.'
## Warning: Expecting numeric in D24687 / R24687C4: got 'n.a.'
## Warning: Expecting numeric in D24688 / R24688C4: got 'n.a.'
## Warning: Expecting numeric in D24689 / R24689C4: got 'n.a.'
## Warning: Expecting numeric in D24690 / R24690C4: got 'n.a.'
## Warning: Expecting numeric in D24691 / R24691C4: got 'n.a.'
## Warning: Expecting numeric in D24692 / R24692C4: got 'n.a.'
## Warning: Expecting numeric in D24693 / R24693C4: got 'n.a.'
## Warning: Expecting numeric in D24694 / R24694C4: got 'n.a.'
## Warning: Expecting numeric in D24695 / R24695C4: got 'n.a.'
## Warning: Expecting numeric in D24696 / R24696C4: got 'n.a.'
## Warning: Expecting numeric in D24697 / R24697C4: got 'n.a.'
## Warning: Expecting numeric in D24698 / R24698C4: got 'n.a.'
## Warning: Expecting numeric in D24699 / R24699C4: got 'n.a.'
## Warning: Expecting numeric in D24700 / R24700C4: got 'n.a.'
## Warning: Expecting numeric in D24701 / R24701C4: got 'n.a.'
## Warning: Expecting numeric in D24702 / R24702C4: got 'n.a.'
## Warning: Expecting numeric in D24703 / R24703C4: got 'n.a.'
## Warning: Expecting numeric in D24704 / R24704C4: got 'n.a.'
## Warning: Expecting numeric in D24705 / R24705C4: got 'n.a.'
## Warning: Expecting numeric in D24706 / R24706C4: got 'n.a.'
## Warning: Expecting numeric in D24707 / R24707C4: got 'n.a.'
## Warning: Expecting numeric in D24708 / R24708C4: got 'n.a.'
## Warning: Expecting numeric in D24709 / R24709C4: got 'n.a.'
## Warning: Expecting numeric in D24710 / R24710C4: got 'n.a.'
## Warning: Expecting numeric in D24711 / R24711C4: got 'n.a.'
## Warning: Expecting numeric in D24712 / R24712C4: got 'n.a.'
## Warning: Expecting numeric in D24713 / R24713C4: got 'n.a.'
## Warning: Expecting numeric in D24714 / R24714C4: got 'n.a.'
## Warning: Expecting numeric in D24715 / R24715C4: got 'n.a.'
## Warning: Expecting numeric in D24716 / R24716C4: got 'n.a.'
## Warning: Expecting numeric in D24717 / R24717C4: got 'n.a.'
## Warning: Expecting numeric in D24718 / R24718C4: got 'n.a.'
## Warning: Expecting numeric in D24719 / R24719C4: got 'n.a.'
## Warning: Expecting numeric in D24720 / R24720C4: got 'n.a.'
## Warning: Expecting numeric in D24721 / R24721C4: got 'n.a.'
## Warning: Expecting numeric in D24722 / R24722C4: got 'n.a.'
## Warning: Expecting numeric in D24723 / R24723C4: got 'n.a.'
## Warning: Expecting numeric in D24724 / R24724C4: got 'n.a.'
## Warning: Expecting numeric in D24725 / R24725C4: got 'n.a.'
## Warning: Expecting numeric in D24726 / R24726C4: got 'n.a.'
## Warning: Expecting numeric in D24727 / R24727C4: got 'n.a.'
## Warning: Expecting numeric in D24728 / R24728C4: got 'n.a.'
## Warning: Expecting numeric in D24729 / R24729C4: got 'n.a.'
## Warning: Expecting numeric in D24730 / R24730C4: got 'n.a.'
## Warning: Expecting numeric in D24731 / R24731C4: got 'n.a.'
## Warning: Expecting numeric in D24732 / R24732C4: got 'n.a.'
## Warning: Expecting numeric in D24733 / R24733C4: got 'n.a.'
## Warning: Expecting numeric in D24734 / R24734C4: got 'n.a.'
## Warning: Expecting numeric in D24735 / R24735C4: got 'n.a.'
## Warning: Expecting numeric in D24736 / R24736C4: got 'n.a.'
## Warning: Expecting numeric in D24737 / R24737C4: got 'n.a.'
## Warning: Expecting numeric in D24738 / R24738C4: got 'n.a.'
## Warning: Expecting numeric in D24739 / R24739C4: got 'n.a.'
## Warning: Expecting numeric in D24740 / R24740C4: got 'n.a.'
## Warning: Expecting numeric in D24741 / R24741C4: got 'n.a.'
## Warning: Expecting numeric in D24742 / R24742C4: got 'n.a.'
## Warning: Expecting numeric in D24743 / R24743C4: got 'n.a.'
## Warning: Expecting numeric in D24744 / R24744C4: got 'n.a.'
## Warning: Expecting numeric in D24745 / R24745C4: got 'n.a.'
## Warning: Expecting numeric in D24746 / R24746C4: got 'n.a.'
## Warning: Expecting numeric in D24747 / R24747C4: got 'n.a.'
## Warning: Expecting numeric in D24748 / R24748C4: got 'n.a.'
## Warning: Expecting numeric in D24749 / R24749C4: got 'n.a.'
## Warning: Expecting numeric in D24750 / R24750C4: got 'n.a.'
## Warning: Expecting numeric in D24751 / R24751C4: got 'n.a.'
## Warning: Expecting numeric in D24752 / R24752C4: got 'n.a.'
## Warning: Expecting numeric in D24753 / R24753C4: got 'n.a.'
## Warning: Expecting numeric in D24754 / R24754C4: got 'n.a.'
## Warning: Expecting numeric in D24755 / R24755C4: got 'n.a.'
## Warning: Expecting numeric in D24756 / R24756C4: got 'n.a.'
## Warning: Expecting numeric in D24757 / R24757C4: got 'n.a.'
## Warning: Expecting numeric in D24758 / R24758C4: got 'n.a.'
## Warning: Expecting numeric in D24759 / R24759C4: got 'n.a.'
## Warning: Expecting numeric in D24760 / R24760C4: got 'n.a.'
## Warning: Expecting numeric in D24761 / R24761C4: got 'n.a.'
## Warning: Expecting numeric in D24762 / R24762C4: got 'n.a.'
## Warning: Expecting numeric in D24763 / R24763C4: got 'n.a.'
## Warning: Expecting numeric in D24764 / R24764C4: got 'n.a.'
## Warning: Expecting numeric in D24765 / R24765C4: got 'n.a.'
## Warning: Expecting numeric in D24766 / R24766C4: got 'n.a.'
## Warning: Expecting numeric in D24767 / R24767C4: got 'n.a.'
## Warning: Expecting numeric in D24768 / R24768C4: got 'n.a.'
## Warning: Expecting numeric in D24769 / R24769C4: got 'n.a.'
## Warning: Expecting numeric in D24770 / R24770C4: got 'n.a.'
## Warning: Expecting numeric in D24771 / R24771C4: got 'n.a.'
## Warning: Expecting numeric in D24772 / R24772C4: got 'n.a.'
## Warning: Expecting numeric in D24773 / R24773C4: got 'n.a.'
## Warning: Expecting numeric in D24774 / R24774C4: got 'n.a.'
## Warning: Expecting numeric in D24775 / R24775C4: got 'n.a.'
## Warning: Expecting numeric in D24776 / R24776C4: got 'n.a.'
## Warning: Expecting numeric in D24777 / R24777C4: got 'n.a.'
## Warning: Expecting numeric in D24778 / R24778C4: got 'n.a.'
## Warning: Expecting numeric in D24779 / R24779C4: got 'n.a.'
## Warning: Expecting numeric in D24780 / R24780C4: got 'n.a.'
## Warning: Expecting numeric in D24781 / R24781C4: got 'n.a.'
## Warning: Expecting numeric in D24782 / R24782C4: got 'n.a.'
## Warning: Expecting numeric in D24783 / R24783C4: got 'n.a.'
## Warning: Expecting numeric in D24784 / R24784C4: got 'n.a.'
## Warning: Expecting numeric in D24785 / R24785C4: got 'n.a.'
## Warning: Expecting numeric in D24786 / R24786C4: got 'n.a.'
## Warning: Expecting numeric in D24787 / R24787C4: got 'n.a.'
## Warning: Expecting numeric in D24788 / R24788C4: got 'n.a.'
## Warning: Expecting numeric in D24789 / R24789C4: got 'n.a.'
## Warning: Expecting numeric in D24790 / R24790C4: got 'n.a.'
## Warning: Expecting numeric in D24791 / R24791C4: got 'n.a.'
## Warning: Expecting numeric in D24792 / R24792C4: got 'n.a.'
## Warning: Expecting numeric in D24793 / R24793C4: got 'n.a.'
## Warning: Expecting numeric in D24794 / R24794C4: got 'n.a.'
## Warning: Expecting numeric in D24795 / R24795C4: got 'n.a.'
## Warning: Expecting numeric in D24796 / R24796C4: got 'n.a.'
## Warning: Expecting numeric in D24797 / R24797C4: got 'n.a.'
## Warning: Expecting numeric in D24798 / R24798C4: got 'n.a.'
## Warning: Expecting numeric in D24799 / R24799C4: got 'n.a.'
## Warning: Expecting numeric in D24800 / R24800C4: got 'n.a.'
## Warning: Expecting numeric in D24801 / R24801C4: got 'n.a.'
## Warning: Expecting numeric in D24802 / R24802C4: got 'n.a.'
## Warning: Expecting numeric in D24803 / R24803C4: got 'n.a.'
## Warning: Expecting numeric in D24804 / R24804C4: got 'n.a.'
## Warning: Expecting numeric in D24805 / R24805C4: got 'n.a.'
## Warning: Expecting numeric in D24806 / R24806C4: got 'n.a.'
## Warning: Expecting numeric in D24807 / R24807C4: got 'n.a.'
## Warning: Expecting numeric in D24808 / R24808C4: got 'n.a.'
## Warning: Expecting numeric in D24809 / R24809C4: got 'n.a.'
## Warning: Expecting numeric in D24810 / R24810C4: got 'n.a.'
## Warning: Expecting numeric in D24811 / R24811C4: got 'n.a.'
## Warning: Expecting numeric in D24812 / R24812C4: got 'n.a.'
## Warning: Expecting numeric in D24813 / R24813C4: got 'n.a.'
## Warning: Expecting numeric in D24814 / R24814C4: got 'n.a.'
## Warning: Expecting numeric in D24815 / R24815C4: got 'n.a.'
## Warning: Expecting numeric in D24816 / R24816C4: got 'n.a.'
## Warning: Expecting numeric in D24817 / R24817C4: got 'n.a.'
## Warning: Expecting numeric in D24818 / R24818C4: got 'n.a.'
## Warning: Expecting numeric in D24819 / R24819C4: got 'n.a.'
## Warning: Expecting numeric in D24820 / R24820C4: got 'n.a.'
## Warning: Expecting numeric in D24821 / R24821C4: got 'n.a.'
## Warning: Expecting numeric in D24822 / R24822C4: got 'n.a.'
## Warning: Expecting numeric in D24823 / R24823C4: got 'n.a.'
## Warning: Expecting numeric in D24824 / R24824C4: got 'n.a.'
## Warning: Expecting numeric in D24825 / R24825C4: got 'n.a.'
## Warning: Expecting numeric in D24826 / R24826C4: got 'n.a.'
## Warning: Expecting numeric in D24827 / R24827C4: got 'n.a.'
## Warning: Expecting numeric in D24828 / R24828C4: got 'n.a.'
## Warning: Expecting numeric in D24829 / R24829C4: got 'n.a.'
## Warning: Expecting numeric in D24830 / R24830C4: got 'n.a.'
## Warning: Expecting numeric in D24831 / R24831C4: got 'n.a.'
## Warning: Expecting numeric in D24832 / R24832C4: got 'n.a.'
## Warning: Expecting numeric in D24833 / R24833C4: got 'n.a.'
## Warning: Expecting numeric in D24834 / R24834C4: got 'n.a.'
## Warning: Expecting numeric in D24835 / R24835C4: got 'n.a.'
## Warning: Expecting numeric in D24836 / R24836C4: got 'n.a.'
## Warning: Expecting numeric in D24837 / R24837C4: got 'n.a.'
## Warning: Expecting numeric in D24838 / R24838C4: got 'n.a.'
## Warning: Expecting numeric in D24839 / R24839C4: got 'n.a.'
## Warning: Expecting numeric in D24840 / R24840C4: got 'n.a.'
## Warning: Expecting numeric in D24841 / R24841C4: got 'n.a.'
## Warning: Expecting numeric in D24842 / R24842C4: got 'n.a.'
## Warning: Expecting numeric in D24843 / R24843C4: got 'n.a.'
## Warning: Expecting numeric in D24844 / R24844C4: got 'n.a.'
## Warning: Expecting numeric in D24845 / R24845C4: got 'n.a.'
## Warning: Expecting numeric in D24846 / R24846C4: got 'n.a.'
## Warning: Expecting numeric in D24847 / R24847C4: got 'n.a.'
## Warning: Expecting numeric in D24848 / R24848C4: got 'n.a.'
## Warning: Expecting numeric in D24849 / R24849C4: got 'n.a.'
## Warning: Expecting numeric in D24850 / R24850C4: got 'n.a.'
## Warning: Expecting numeric in D24851 / R24851C4: got 'n.a.'
## Warning: Expecting numeric in D24852 / R24852C4: got 'n.a.'
## Warning: Expecting numeric in D24853 / R24853C4: got 'n.a.'
## Warning: Expecting numeric in D24854 / R24854C4: got 'n.a.'
## Warning: Expecting numeric in D24855 / R24855C4: got 'n.a.'
## Warning: Expecting numeric in D24856 / R24856C4: got 'n.a.'
## Warning: Expecting numeric in D24857 / R24857C4: got 'n.a.'
## Warning: Expecting numeric in D24858 / R24858C4: got 'n.a.'
## Warning: Expecting numeric in D24859 / R24859C4: got 'n.a.'
## Warning: Expecting numeric in D24860 / R24860C4: got 'n.a.'
## Warning: Expecting numeric in D24861 / R24861C4: got 'n.a.'
## Warning: Expecting numeric in D24862 / R24862C4: got 'n.a.'
## Warning: Expecting numeric in D24863 / R24863C4: got 'n.a.'
## Warning: Expecting numeric in D24864 / R24864C4: got 'n.a.'
## Warning: Expecting numeric in D24865 / R24865C4: got 'n.a.'
## Warning: Expecting numeric in D24866 / R24866C4: got 'n.a.'
## Warning: Expecting numeric in D24867 / R24867C4: got 'n.a.'
## Warning: Expecting numeric in D24868 / R24868C4: got 'n.a.'
## Warning: Expecting numeric in D24869 / R24869C4: got 'n.a.'
## Warning: Expecting numeric in D24870 / R24870C4: got 'n.a.'
## Warning: Expecting numeric in D24871 / R24871C4: got 'n.a.'
## Warning: Expecting numeric in D24872 / R24872C4: got 'n.a.'
## Warning: Expecting numeric in D24873 / R24873C4: got 'n.a.'
## Warning: Expecting numeric in D24874 / R24874C4: got 'n.a.'
## Warning: Expecting numeric in D24875 / R24875C4: got 'n.a.'
## Warning: Expecting numeric in D24876 / R24876C4: got 'n.a.'
## Warning: Expecting numeric in D24877 / R24877C4: got 'n.a.'
## Warning: Expecting numeric in D24878 / R24878C4: got 'n.a.'
## Warning: Expecting numeric in D24879 / R24879C4: got 'n.a.'
## Warning: Expecting numeric in D24880 / R24880C4: got 'n.a.'
## Warning: Expecting numeric in D24881 / R24881C4: got 'n.a.'
## Warning: Expecting numeric in D24882 / R24882C4: got 'n.a.'
## Warning: Expecting numeric in D24883 / R24883C4: got 'n.a.'
## Warning: Expecting numeric in D24884 / R24884C4: got 'n.a.'
## Warning: Expecting numeric in D24885 / R24885C4: got 'n.a.'
## Warning: Expecting numeric in D24886 / R24886C4: got 'n.a.'
## Warning: Expecting numeric in D24887 / R24887C4: got 'n.a.'
## Warning: Expecting numeric in D24888 / R24888C4: got 'n.a.'
## Warning: Expecting numeric in D24889 / R24889C4: got 'n.a.'
## Warning: Expecting numeric in D24890 / R24890C4: got 'n.a.'
## Warning: Expecting numeric in D24891 / R24891C4: got 'n.a.'
## Warning: Expecting numeric in D24892 / R24892C4: got 'n.a.'
## Warning: Expecting numeric in D24893 / R24893C4: got 'n.a.'
## Warning: Expecting numeric in D24894 / R24894C4: got 'n.a.'
## Warning: Expecting numeric in D24895 / R24895C4: got 'n.a.'
## Warning: Expecting numeric in D24896 / R24896C4: got 'n.a.'
## Warning: Expecting numeric in D24897 / R24897C4: got 'n.a.'
## Warning: Expecting numeric in D24898 / R24898C4: got 'n.a.'
## Warning: Expecting numeric in D24899 / R24899C4: got 'n.a.'
## Warning: Expecting numeric in D24900 / R24900C4: got 'n.a.'
## Warning: Expecting numeric in D24901 / R24901C4: got 'n.a.'
## Warning: Expecting numeric in D24902 / R24902C4: got 'n.a.'
## Warning: Expecting numeric in D24903 / R24903C4: got 'n.a.'
## Warning: Expecting numeric in D24904 / R24904C4: got 'n.a.'
## Warning: Expecting numeric in D24905 / R24905C4: got 'n.a.'
## Warning: Expecting numeric in D24906 / R24906C4: got 'n.a.'
## Warning: Expecting numeric in D24907 / R24907C4: got 'n.a.'
## Warning: Expecting numeric in D24908 / R24908C4: got 'n.a.'
## Warning: Expecting numeric in D24909 / R24909C4: got 'n.a.'
## Warning: Expecting numeric in D24910 / R24910C4: got 'n.a.'
## Warning: Expecting numeric in D24911 / R24911C4: got 'n.a.'
## Warning: Expecting numeric in D24912 / R24912C4: got 'n.a.'
## Warning: Expecting numeric in D24913 / R24913C4: got 'n.a.'
## Warning: Expecting numeric in D24914 / R24914C4: got 'n.a.'
## Warning: Expecting numeric in D24915 / R24915C4: got 'n.a.'
## Warning: Expecting numeric in D24916 / R24916C4: got 'n.a.'
## Warning: Expecting numeric in D24917 / R24917C4: got 'n.a.'
## Warning: Expecting numeric in D24918 / R24918C4: got 'n.a.'
## Warning: Expecting numeric in D24919 / R24919C4: got 'n.a.'
## Warning: Expecting numeric in D24920 / R24920C4: got 'n.a.'
## Warning: Expecting numeric in D24921 / R24921C4: got 'n.a.'
## Warning: Expecting numeric in D24922 / R24922C4: got 'n.a.'
## Warning: Expecting numeric in D24923 / R24923C4: got 'n.a.'
## Warning: Expecting numeric in D24924 / R24924C4: got 'n.a.'
## Warning: Expecting numeric in D24925 / R24925C4: got 'n.a.'
## Warning: Expecting numeric in D24926 / R24926C4: got 'n.a.'
## Warning: Expecting numeric in D24927 / R24927C4: got 'n.a.'
## Warning: Expecting numeric in D24928 / R24928C4: got 'n.a.'
## Warning: Expecting numeric in D24929 / R24929C4: got 'n.a.'
## Warning: Expecting numeric in D24930 / R24930C4: got 'n.a.'
## Warning: Expecting numeric in D24931 / R24931C4: got 'n.a.'
## Warning: Expecting numeric in D24932 / R24932C4: got 'n.a.'
## Warning: Expecting numeric in D24933 / R24933C4: got 'n.a.'
## Warning: Expecting numeric in D24934 / R24934C4: got 'n.a.'
## Warning: Expecting numeric in D24935 / R24935C4: got 'n.a.'
## Warning: Expecting numeric in D24936 / R24936C4: got 'n.a.'
## Warning: Expecting numeric in D24937 / R24937C4: got 'n.a.'
## Warning: Expecting numeric in D24938 / R24938C4: got 'n.a.'
## Warning: Expecting numeric in D24939 / R24939C4: got 'n.a.'
## Warning: Expecting numeric in D24940 / R24940C4: got 'n.a.'
## Warning: Expecting numeric in D24941 / R24941C4: got 'n.a.'
## Warning: Expecting numeric in D24942 / R24942C4: got 'n.a.'
## Warning: Expecting numeric in D24943 / R24943C4: got 'n.a.'
## Warning: Expecting numeric in D24944 / R24944C4: got 'n.a.'
## Warning: Expecting numeric in D24945 / R24945C4: got 'n.a.'
## Warning: Expecting numeric in D24946 / R24946C4: got 'n.a.'
## Warning: Expecting numeric in D24947 / R24947C4: got 'n.a.'
## Warning: Expecting numeric in D24948 / R24948C4: got 'n.a.'
## Warning: Expecting numeric in D24949 / R24949C4: got 'n.a.'
## Warning: Expecting numeric in D24950 / R24950C4: got 'n.a.'
## Warning: Expecting numeric in D24951 / R24951C4: got 'n.a.'
## Warning: Expecting numeric in D24952 / R24952C4: got 'n.a.'
## Warning: Expecting numeric in D24953 / R24953C4: got 'n.a.'
## Warning: Expecting numeric in D24954 / R24954C4: got 'n.a.'
## Warning: Expecting numeric in D24955 / R24955C4: got 'n.a.'
## Warning: Expecting numeric in D24956 / R24956C4: got 'n.a.'
## Warning: Expecting numeric in D24957 / R24957C4: got 'n.a.'
## Warning: Expecting numeric in D24958 / R24958C4: got 'n.a.'
## Warning: Expecting numeric in D24959 / R24959C4: got 'n.a.'
## Warning: Expecting numeric in D24960 / R24960C4: got 'n.a.'
## Warning: Expecting numeric in D24961 / R24961C4: got 'n.a.'
## Warning: Expecting numeric in D24962 / R24962C4: got 'n.a.'
## Warning: Expecting numeric in D24963 / R24963C4: got 'n.a.'
## Warning: Expecting numeric in D24964 / R24964C4: got 'n.a.'
## Warning: Expecting numeric in D24965 / R24965C4: got 'n.a.'
## Warning: Expecting numeric in D24966 / R24966C4: got 'n.a.'
## Warning: Expecting numeric in D24967 / R24967C4: got 'n.a.'
## Warning: Expecting numeric in D24968 / R24968C4: got 'n.a.'
## Warning: Expecting numeric in D24969 / R24969C4: got 'n.a.'
## Warning: Expecting numeric in D24970 / R24970C4: got 'n.a.'
## Warning: Expecting numeric in D24971 / R24971C4: got 'n.a.'
## Warning: Expecting numeric in D24972 / R24972C4: got 'n.a.'
## Warning: Expecting numeric in D24973 / R24973C4: got 'n.a.'
## Warning: Expecting numeric in D24974 / R24974C4: got 'n.a.'
## Warning: Expecting numeric in D24975 / R24975C4: got 'n.a.'
## Warning: Expecting numeric in D24976 / R24976C4: got 'n.a.'
## Warning: Expecting numeric in D24977 / R24977C4: got 'n.a.'
## Warning: Expecting numeric in D24978 / R24978C4: got 'n.a.'
## Warning: Expecting numeric in D24979 / R24979C4: got 'n.a.'
## Warning: Expecting numeric in D24980 / R24980C4: got 'n.a.'
## Warning: Expecting numeric in D24981 / R24981C4: got 'n.a.'
## Warning: Expecting numeric in D24982 / R24982C4: got 'n.a.'
## Warning: Expecting numeric in D24983 / R24983C4: got 'n.a.'
## Warning: Expecting numeric in D24984 / R24984C4: got 'n.a.'
## Warning: Expecting numeric in D24985 / R24985C4: got 'n.a.'
## Warning: Expecting numeric in D24986 / R24986C4: got 'n.a.'
## Warning: Expecting numeric in D24987 / R24987C4: got 'n.a.'
## Warning: Expecting numeric in D24988 / R24988C4: got 'n.a.'
## Warning: Expecting numeric in D24989 / R24989C4: got 'n.a.'
## Warning: Expecting numeric in D24990 / R24990C4: got 'n.a.'
## Warning: Expecting numeric in D24991 / R24991C4: got 'n.a.'
## Warning: Expecting numeric in D24992 / R24992C4: got 'n.a.'
## Warning: Expecting numeric in D24993 / R24993C4: got 'n.a.'
## Warning: Expecting numeric in D24994 / R24994C4: got 'n.a.'
## Warning: Expecting numeric in D24995 / R24995C4: got 'n.a.'
## Warning: Expecting numeric in D24996 / R24996C4: got 'n.a.'
## Warning: Expecting numeric in D24997 / R24997C4: got 'n.a.'
## Warning: Expecting numeric in D24998 / R24998C4: got 'n.a.'
## Warning: Expecting numeric in D24999 / R24999C4: got 'n.a.'
## Warning: Expecting numeric in D25000 / R25000C4: got 'n.a.'
## Warning: Expecting numeric in D25001 / R25001C4: got 'n.a.'
## Warning: Expecting numeric in D25002 / R25002C4: got 'n.a.'
## Warning: Expecting numeric in D25003 / R25003C4: got 'n.a.'
## Warning: Expecting numeric in D25004 / R25004C4: got 'n.a.'
## Warning: Expecting numeric in D25005 / R25005C4: got 'n.a.'
## Warning: Expecting numeric in D25006 / R25006C4: got 'n.a.'
## Warning: Expecting numeric in D25007 / R25007C4: got 'n.a.'
## Warning: Expecting numeric in D25008 / R25008C4: got 'n.a.'
## Warning: Expecting numeric in D25009 / R25009C4: got 'n.a.'
## Warning: Expecting numeric in D25010 / R25010C4: got 'n.a.'
## Warning: Expecting numeric in D25011 / R25011C4: got 'n.a.'
## Warning: Expecting numeric in D25012 / R25012C4: got 'n.a.'
## Warning: Expecting numeric in D25013 / R25013C4: got 'n.a.'
## Warning: Expecting numeric in D25014 / R25014C4: got 'n.a.'
## Warning: Expecting numeric in D25015 / R25015C4: got 'n.a.'
## Warning: Expecting numeric in D25016 / R25016C4: got 'n.a.'
## Warning: Expecting numeric in D25017 / R25017C4: got 'n.a.'
## Warning: Expecting numeric in D25018 / R25018C4: got 'n.a.'
## Warning: Expecting numeric in D25019 / R25019C4: got 'n.a.'
## Warning: Expecting numeric in D25020 / R25020C4: got 'n.a.'
## Warning: Expecting numeric in D25021 / R25021C4: got 'n.a.'
## Warning: Expecting numeric in D25022 / R25022C4: got 'n.a.'
## Warning: Expecting numeric in D25023 / R25023C4: got 'n.a.'
## Warning: Expecting numeric in D25024 / R25024C4: got 'n.a.'
## Warning: Expecting numeric in D25025 / R25025C4: got 'n.a.'
## Warning: Expecting numeric in D25026 / R25026C4: got 'n.a.'
## Warning: Expecting numeric in D25027 / R25027C4: got 'n.a.'
## Warning: Expecting numeric in D25028 / R25028C4: got 'n.a.'
## Warning: Expecting numeric in D25029 / R25029C4: got 'n.a.'
## Warning: Expecting numeric in D25030 / R25030C4: got 'n.a.'
## Warning: Expecting numeric in D25031 / R25031C4: got 'n.a.'
## Warning: Expecting numeric in D25032 / R25032C4: got 'n.a.'
## Warning: Expecting numeric in D25033 / R25033C4: got 'n.a.'
## Warning: Expecting numeric in D25034 / R25034C4: got 'n.a.'
## Warning: Expecting numeric in D25035 / R25035C4: got 'n.a.'
## Warning: Expecting numeric in D25036 / R25036C4: got 'n.a.'
## Warning: Expecting numeric in D25037 / R25037C4: got 'n.a.'
## Warning: Expecting numeric in D25038 / R25038C4: got 'n.a.'
## Warning: Expecting numeric in D25039 / R25039C4: got 'n.a.'
## Warning: Expecting numeric in D25040 / R25040C4: got 'n.a.'
## Warning: Expecting numeric in D25041 / R25041C4: got 'n.a.'
## Warning: Expecting numeric in D25042 / R25042C4: got 'n.a.'
## Warning: Expecting numeric in D25043 / R25043C4: got 'n.a.'
## Warning: Expecting numeric in D25044 / R25044C4: got 'n.a.'
## Warning: Expecting numeric in D25045 / R25045C4: got 'n.a.'
## Warning: Expecting numeric in D25046 / R25046C4: got 'n.a.'
## Warning: Expecting numeric in D25047 / R25047C4: got 'n.a.'
## Warning: Expecting numeric in D25048 / R25048C4: got 'n.a.'
## Warning: Expecting numeric in D25049 / R25049C4: got 'n.a.'
## Warning: Expecting numeric in D25050 / R25050C4: got 'n.a.'
## Warning: Expecting numeric in D25051 / R25051C4: got 'n.a.'
## Warning: Expecting numeric in D25052 / R25052C4: got 'n.a.'
## Warning: Expecting numeric in D25053 / R25053C4: got 'n.a.'
## Warning: Expecting numeric in D25054 / R25054C4: got 'n.a.'
## Warning: Expecting numeric in D25055 / R25055C4: got 'n.a.'
## Warning: Expecting numeric in D25056 / R25056C4: got 'n.a.'
## Warning: Expecting numeric in D25057 / R25057C4: got 'n.a.'
## Warning: Expecting numeric in D25058 / R25058C4: got 'n.a.'
## Warning: Expecting numeric in D25059 / R25059C4: got 'n.a.'
## Warning: Expecting numeric in D25060 / R25060C4: got 'n.a.'
## Warning: Expecting numeric in D25061 / R25061C4: got 'n.a.'
## Warning: Expecting numeric in D25062 / R25062C4: got 'n.a.'
## Warning: Expecting numeric in D25063 / R25063C4: got 'n.a.'
## Warning: Expecting numeric in D25064 / R25064C4: got 'n.a.'
## Warning: Expecting numeric in D25065 / R25065C4: got 'n.a.'
## Warning: Expecting numeric in D25066 / R25066C4: got 'n.a.'
## Warning: Expecting numeric in D25067 / R25067C4: got 'n.a.'
## Warning: Expecting numeric in D25068 / R25068C4: got 'n.a.'
## Warning: Expecting numeric in D25069 / R25069C4: got 'n.a.'
## Warning: Expecting numeric in D25070 / R25070C4: got 'n.a.'
## Warning: Expecting numeric in D25071 / R25071C4: got 'n.a.'
## Warning: Expecting numeric in D25072 / R25072C4: got 'n.a.'
## Warning: Expecting numeric in D25073 / R25073C4: got 'n.a.'
## Warning: Expecting numeric in D25074 / R25074C4: got 'n.a.'
## Warning: Expecting numeric in D25075 / R25075C4: got 'n.a.'
## Warning: Expecting numeric in D25076 / R25076C4: got 'n.a.'
## Warning: Expecting numeric in D25077 / R25077C4: got 'n.a.'
## Warning: Expecting numeric in D25078 / R25078C4: got 'n.a.'
## Warning: Expecting numeric in D25079 / R25079C4: got 'n.a.'
## Warning: Expecting numeric in D25080 / R25080C4: got 'n.a.'
## Warning: Expecting numeric in D25081 / R25081C4: got 'n.a.'
## Warning: Expecting numeric in D25082 / R25082C4: got 'n.a.'
## Warning: Expecting numeric in D25083 / R25083C4: got 'n.a.'
## Warning: Expecting numeric in D25084 / R25084C4: got 'n.a.'
## Warning: Expecting numeric in D25085 / R25085C4: got 'n.a.'
## Warning: Expecting numeric in D25086 / R25086C4: got 'n.a.'
## Warning: Expecting numeric in D25087 / R25087C4: got 'n.a.'
## Warning: Expecting numeric in D25088 / R25088C4: got 'n.a.'
## Warning: Expecting numeric in D25089 / R25089C4: got 'n.a.'
## Warning: Expecting numeric in D25090 / R25090C4: got 'n.a.'
## Warning: Expecting numeric in D25091 / R25091C4: got 'n.a.'
## Warning: Expecting numeric in D25092 / R25092C4: got 'n.a.'
## Warning: Expecting numeric in D25093 / R25093C4: got 'n.a.'
## Warning: Expecting numeric in D25094 / R25094C4: got 'n.a.'
## Warning: Expecting numeric in D25095 / R25095C4: got 'n.a.'
## Warning: Expecting numeric in D25096 / R25096C4: got 'n.a.'
## Warning: Expecting numeric in D25097 / R25097C4: got 'n.a.'
## Warning: Expecting numeric in D25098 / R25098C4: got 'n.a.'
## Warning: Expecting numeric in D25099 / R25099C4: got 'n.a.'
## Warning: Expecting numeric in D25100 / R25100C4: got 'n.a.'
## Warning: Expecting numeric in D25101 / R25101C4: got 'n.a.'
## Warning: Expecting numeric in D25102 / R25102C4: got 'n.a.'
## Warning: Expecting numeric in D25103 / R25103C4: got 'n.a.'
## Warning: Expecting numeric in D25104 / R25104C4: got 'n.a.'
## Warning: Expecting numeric in D25105 / R25105C4: got 'n.a.'
## Warning: Expecting numeric in D25106 / R25106C4: got 'n.a.'
## Warning: Expecting numeric in D25107 / R25107C4: got 'n.a.'
## Warning: Expecting numeric in D25108 / R25108C4: got 'n.a.'
## Warning: Expecting numeric in D25109 / R25109C4: got 'n.a.'
## Warning: Expecting numeric in D25110 / R25110C4: got 'n.a.'
## Warning: Expecting numeric in D25111 / R25111C4: got 'n.a.'
## Warning: Expecting numeric in D25112 / R25112C4: got 'n.a.'
## Warning: Expecting numeric in D25113 / R25113C4: got 'n.a.'
## Warning: Expecting numeric in D25114 / R25114C4: got 'n.a.'
## Warning: Expecting numeric in D25115 / R25115C4: got 'n.a.'
## Warning: Expecting numeric in D25116 / R25116C4: got 'n.a.'
## Warning: Expecting numeric in D25117 / R25117C4: got 'n.a.'
## Warning: Expecting numeric in D25118 / R25118C4: got 'n.a.'
## Warning: Expecting numeric in D25119 / R25119C4: got 'n.a.'
## Warning: Expecting numeric in D25120 / R25120C4: got 'n.a.'
## Warning: Expecting numeric in D25121 / R25121C4: got 'n.a.'
## Warning: Expecting numeric in D25122 / R25122C4: got 'n.a.'
## Warning: Expecting numeric in D25123 / R25123C4: got 'n.a.'
## Warning: Expecting numeric in D25124 / R25124C4: got 'n.a.'
## Warning: Expecting numeric in D25125 / R25125C4: got 'n.a.'
## Warning: Expecting numeric in D25126 / R25126C4: got 'n.a.'
## Warning: Expecting numeric in D25127 / R25127C4: got 'n.a.'
## Warning: Expecting numeric in D25128 / R25128C4: got 'n.a.'
## Warning: Expecting numeric in D25129 / R25129C4: got 'n.a.'
## Warning: Expecting numeric in D25130 / R25130C4: got 'n.a.'
## Warning: Expecting numeric in D25131 / R25131C4: got 'n.a.'
## Warning: Expecting numeric in D25132 / R25132C4: got 'n.a.'
## Warning: Expecting numeric in D25133 / R25133C4: got 'n.a.'
## Warning: Expecting numeric in D25134 / R25134C4: got 'n.a.'
## Warning: Expecting numeric in D25135 / R25135C4: got 'n.a.'
## Warning: Expecting numeric in D25136 / R25136C4: got 'n.a.'
## Warning: Expecting numeric in D25137 / R25137C4: got 'n.a.'
## Warning: Expecting numeric in D25138 / R25138C4: got 'n.a.'
## Warning: Expecting numeric in D25139 / R25139C4: got 'n.a.'
## Warning: Expecting numeric in D25140 / R25140C4: got 'n.a.'
## Warning: Expecting numeric in D25141 / R25141C4: got 'n.a.'
## Warning: Expecting numeric in D25142 / R25142C4: got 'n.a.'
## Warning: Expecting numeric in D25143 / R25143C4: got 'n.a.'
## Warning: Expecting numeric in D25144 / R25144C4: got 'n.a.'
## Warning: Expecting numeric in D25145 / R25145C4: got 'n.a.'
## Warning: Expecting numeric in D25146 / R25146C4: got 'n.a.'
## Warning: Expecting numeric in D25147 / R25147C4: got 'n.a.'
## Warning: Expecting numeric in D25148 / R25148C4: got 'n.a.'
## Warning: Expecting numeric in D25149 / R25149C4: got 'n.a.'
## Warning: Expecting numeric in D25150 / R25150C4: got 'n.a.'
## Warning: Expecting numeric in D25151 / R25151C4: got 'n.a.'
## Warning: Expecting numeric in D25152 / R25152C4: got 'n.a.'
## Warning: Expecting numeric in D25153 / R25153C4: got 'n.a.'
## Warning: Expecting numeric in D25154 / R25154C4: got 'n.a.'
## Warning: Expecting numeric in D25155 / R25155C4: got 'n.a.'
## Warning: Expecting numeric in D25156 / R25156C4: got 'n.a.'
## Warning: Expecting numeric in D25157 / R25157C4: got 'n.a.'
## Warning: Expecting numeric in D25158 / R25158C4: got 'n.a.'
## Warning: Expecting numeric in D25159 / R25159C4: got 'n.a.'
## Warning: Expecting numeric in D25160 / R25160C4: got 'n.a.'
## Warning: Expecting numeric in D25161 / R25161C4: got 'n.a.'
## Warning: Expecting numeric in D25162 / R25162C4: got 'n.a.'
## Warning: Expecting numeric in D25163 / R25163C4: got 'n.a.'
## Warning: Expecting numeric in D25164 / R25164C4: got 'n.a.'
## Warning: Expecting numeric in D25165 / R25165C4: got 'n.a.'
## Warning: Expecting numeric in D25166 / R25166C4: got 'n.a.'
## Warning: Expecting numeric in D25167 / R25167C4: got 'n.a.'
## Warning: Expecting numeric in D25168 / R25168C4: got 'n.a.'
## Warning: Expecting numeric in D25169 / R25169C4: got 'n.a.'
## Warning: Expecting numeric in D25170 / R25170C4: got 'n.a.'
## Warning: Expecting numeric in D25171 / R25171C4: got 'n.a.'
## Warning: Expecting numeric in D25172 / R25172C4: got 'n.a.'
## Warning: Expecting numeric in D25173 / R25173C4: got 'n.a.'
## Warning: Expecting numeric in D25174 / R25174C4: got 'n.a.'
## Warning: Expecting numeric in D25175 / R25175C4: got 'n.a.'
## Warning: Expecting numeric in D25176 / R25176C4: got 'n.a.'
## Warning: Expecting numeric in D25177 / R25177C4: got 'n.a.'
## Warning: Expecting numeric in D25178 / R25178C4: got 'n.a.'
## Warning: Expecting numeric in D25179 / R25179C4: got 'n.a.'
## Warning: Expecting numeric in D25180 / R25180C4: got 'n.a.'
## Warning: Expecting numeric in D25181 / R25181C4: got 'n.a.'
## Warning: Expecting numeric in D25182 / R25182C4: got 'n.a.'
## Warning: Expecting numeric in D25183 / R25183C4: got 'n.a.'
## Warning: Expecting numeric in D25184 / R25184C4: got 'n.a.'
## Warning: Expecting numeric in D25185 / R25185C4: got 'n.a.'
## Warning: Expecting numeric in D25186 / R25186C4: got 'n.a.'
## Warning: Expecting numeric in D25187 / R25187C4: got 'n.a.'
## Warning: Expecting numeric in D25188 / R25188C4: got 'n.a.'
## Warning: Expecting numeric in D25189 / R25189C4: got 'n.a.'
## Warning: Expecting numeric in D25190 / R25190C4: got 'n.a.'
## Warning: Expecting numeric in D25191 / R25191C4: got 'n.a.'
## Warning: Expecting numeric in D25192 / R25192C4: got 'n.a.'
## Warning: Expecting numeric in D25193 / R25193C4: got 'n.a.'
## Warning: Expecting numeric in D25194 / R25194C4: got 'n.a.'
## Warning: Expecting numeric in D25195 / R25195C4: got 'n.a.'
## Warning: Expecting numeric in D25196 / R25196C4: got 'n.a.'
## Warning: Expecting numeric in D25197 / R25197C4: got 'n.a.'
## Warning: Expecting numeric in D25198 / R25198C4: got 'n.a.'
## Warning: Expecting numeric in D25199 / R25199C4: got 'n.a.'
## Warning: Expecting numeric in D25200 / R25200C4: got 'n.a.'
## Warning: Expecting numeric in D25201 / R25201C4: got 'n.a.'
## Warning: Expecting numeric in D25202 / R25202C4: got 'n.a.'
## Warning: Expecting numeric in D25203 / R25203C4: got 'n.a.'
## Warning: Expecting numeric in D25204 / R25204C4: got 'n.a.'
## Warning: Expecting numeric in D25205 / R25205C4: got 'n.a.'
## Warning: Expecting numeric in D25206 / R25206C4: got 'n.a.'
## Warning: Expecting numeric in D25207 / R25207C4: got 'n.a.'
## Warning: Expecting numeric in D25208 / R25208C4: got 'n.a.'
## Warning: Expecting numeric in D25209 / R25209C4: got 'n.a.'
## Warning: Expecting numeric in D25210 / R25210C4: got 'n.a.'
## Warning: Expecting numeric in D25211 / R25211C4: got 'n.a.'
## Warning: Expecting numeric in D25212 / R25212C4: got 'n.a.'
## Warning: Expecting numeric in D25213 / R25213C4: got 'n.a.'
## Warning: Expecting numeric in D25214 / R25214C4: got 'n.a.'
## Warning: Expecting numeric in D25215 / R25215C4: got 'n.a.'
## Warning: Expecting numeric in D25216 / R25216C4: got 'n.a.'
## Warning: Expecting numeric in D25217 / R25217C4: got 'n.a.'
## Warning: Expecting numeric in D25218 / R25218C4: got 'n.a.'
## Warning: Expecting numeric in D25219 / R25219C4: got 'n.a.'
## Warning: Expecting numeric in D25220 / R25220C4: got 'n.a.'
## Warning: Expecting numeric in D25221 / R25221C4: got 'n.a.'
## Warning: Expecting numeric in D25222 / R25222C4: got 'n.a.'
## Warning: Expecting numeric in D25223 / R25223C4: got 'n.a.'
## Warning: Expecting numeric in D25224 / R25224C4: got 'n.a.'
## Warning: Expecting numeric in D25225 / R25225C4: got 'n.a.'
## Warning: Expecting numeric in D25226 / R25226C4: got 'n.a.'
## Warning: Expecting numeric in D25227 / R25227C4: got 'n.a.'
## Warning: Expecting numeric in D25228 / R25228C4: got 'n.a.'
## Warning: Expecting numeric in D25229 / R25229C4: got 'n.a.'
## Warning: Expecting numeric in D25230 / R25230C4: got 'n.a.'
## Warning: Expecting numeric in D25231 / R25231C4: got 'n.a.'
## Warning: Expecting numeric in D25232 / R25232C4: got 'n.a.'
## Warning: Expecting numeric in D25233 / R25233C4: got 'n.a.'
## Warning: Expecting numeric in D25234 / R25234C4: got 'n.a.'
## Warning: Expecting numeric in D25235 / R25235C4: got 'n.a.'
## Warning: Expecting numeric in D25236 / R25236C4: got 'n.a.'
## Warning: Expecting numeric in D25237 / R25237C4: got 'n.a.'
## Warning: Expecting numeric in D25238 / R25238C4: got 'n.a.'
## Warning: Expecting numeric in D25239 / R25239C4: got 'n.a.'
## Warning: Expecting numeric in D25240 / R25240C4: got 'n.a.'
## Warning: Expecting numeric in D25241 / R25241C4: got 'n.a.'
## Warning: Expecting numeric in D25242 / R25242C4: got 'n.a.'
## Warning: Expecting numeric in D25243 / R25243C4: got 'n.a.'
## Warning: Expecting numeric in D25244 / R25244C4: got 'n.a.'
## Warning: Expecting numeric in D25245 / R25245C4: got 'n.a.'
## Warning: Expecting numeric in D25246 / R25246C4: got 'n.a.'
## Warning: Expecting numeric in D25247 / R25247C4: got 'n.a.'
## Warning: Expecting numeric in D25248 / R25248C4: got 'n.a.'
## Warning: Expecting numeric in D25249 / R25249C4: got 'n.a.'
## Warning: Expecting numeric in D25250 / R25250C4: got 'n.a.'
## Warning: Expecting numeric in D25251 / R25251C4: got 'n.a.'
## Warning: Expecting numeric in D25252 / R25252C4: got 'n.a.'
## Warning: Expecting numeric in D25253 / R25253C4: got 'n.a.'
## Warning: Expecting numeric in D25254 / R25254C4: got 'n.a.'
## Warning: Expecting numeric in D25255 / R25255C4: got 'n.a.'
## Warning: Expecting numeric in D25256 / R25256C4: got 'n.a.'
## Warning: Expecting numeric in D25257 / R25257C4: got 'n.a.'
## Warning: Expecting numeric in D25258 / R25258C4: got 'n.a.'
## Warning: Expecting numeric in D25259 / R25259C4: got 'n.a.'
## Warning: Expecting numeric in D25260 / R25260C4: got 'n.a.'
## Warning: Expecting numeric in D25261 / R25261C4: got 'n.a.'
## Warning: Expecting numeric in D25262 / R25262C4: got 'n.a.'
## Warning: Expecting numeric in D25263 / R25263C4: got 'n.a.'
## Warning: Expecting numeric in D25264 / R25264C4: got 'n.a.'
## Warning: Expecting numeric in D25265 / R25265C4: got 'n.a.'
## Warning: Expecting numeric in D25266 / R25266C4: got 'n.a.'
## Warning: Expecting numeric in D25267 / R25267C4: got 'n.a.'
## Warning: Expecting numeric in D25268 / R25268C4: got 'n.a.'
## Warning: Expecting numeric in D25269 / R25269C4: got 'n.a.'
## Warning: Expecting numeric in D25270 / R25270C4: got 'n.a.'
## Warning: Expecting numeric in D25271 / R25271C4: got 'n.a.'
## Warning: Expecting numeric in D25272 / R25272C4: got 'n.a.'
## Warning: Expecting numeric in D25273 / R25273C4: got 'n.a.'
## Warning: Expecting numeric in D25274 / R25274C4: got 'n.a.'
## Warning: Expecting numeric in D25275 / R25275C4: got 'n.a.'
## Warning: Expecting numeric in D25276 / R25276C4: got 'n.a.'
## Warning: Expecting numeric in D25277 / R25277C4: got 'n.a.'
## Warning: Expecting numeric in D25278 / R25278C4: got 'n.a.'
## Warning: Expecting numeric in D25279 / R25279C4: got 'n.a.'
## Warning: Expecting numeric in D25280 / R25280C4: got 'n.a.'
## Warning: Expecting numeric in D25281 / R25281C4: got 'n.a.'
## Warning: Expecting numeric in D25282 / R25282C4: got 'n.a.'
## Warning: Expecting numeric in D25283 / R25283C4: got 'n.a.'
## Warning: Expecting numeric in D25284 / R25284C4: got 'n.a.'
## Warning: Expecting numeric in D25285 / R25285C4: got 'n.a.'
## Warning: Expecting numeric in D25286 / R25286C4: got 'n.a.'
## Warning: Expecting numeric in D25287 / R25287C4: got 'n.a.'
## Warning: Expecting numeric in D25288 / R25288C4: got 'n.a.'
## Warning: Expecting numeric in D25289 / R25289C4: got 'n.a.'
## Warning: Expecting numeric in D25290 / R25290C4: got 'n.a.'
## Warning: Expecting numeric in D25291 / R25291C4: got 'n.a.'
## Warning: Expecting numeric in D25292 / R25292C4: got 'n.a.'
## Warning: Expecting numeric in D25293 / R25293C4: got 'n.a.'
## Warning: Expecting numeric in D25294 / R25294C4: got 'n.a.'
## Warning: Expecting numeric in D25295 / R25295C4: got 'n.a.'
## Warning: Expecting numeric in D25296 / R25296C4: got 'n.a.'
## Warning: Expecting numeric in D25297 / R25297C4: got 'n.a.'
## Warning: Expecting numeric in D25298 / R25298C4: got 'n.a.'
## Warning: Expecting numeric in D25299 / R25299C4: got 'n.a.'
## Warning: Expecting numeric in D25300 / R25300C4: got 'n.a.'
## Warning: Expecting numeric in D25301 / R25301C4: got 'n.a.'
## Warning: Expecting numeric in D25302 / R25302C4: got 'n.a.'
## Warning: Expecting numeric in D25303 / R25303C4: got 'n.a.'
## Warning: Expecting numeric in D25304 / R25304C4: got 'n.a.'
## Warning: Expecting numeric in D25305 / R25305C4: got 'n.a.'
## Warning: Expecting numeric in D25306 / R25306C4: got 'n.a.'
## Warning: Expecting numeric in D25307 / R25307C4: got 'n.a.'
## Warning: Expecting numeric in D25308 / R25308C4: got 'n.a.'
## Warning: Expecting numeric in D25309 / R25309C4: got 'n.a.'
## Warning: Expecting numeric in D25310 / R25310C4: got 'n.a.'
## Warning: Expecting numeric in D25311 / R25311C4: got 'n.a.'
## Warning: Expecting numeric in D25312 / R25312C4: got 'n.a.'
## Warning: Expecting numeric in D25313 / R25313C4: got 'n.a.'
## Warning: Expecting numeric in D25314 / R25314C4: got 'n.a.'
## Warning: Expecting numeric in D25315 / R25315C4: got 'n.a.'
## Warning: Expecting numeric in D25316 / R25316C4: got 'n.a.'
## Warning: Expecting numeric in D25317 / R25317C4: got 'n.a.'
## Warning: Expecting numeric in D25318 / R25318C4: got 'n.a.'
## Warning: Expecting numeric in D25319 / R25319C4: got 'n.a.'
## Warning: Expecting numeric in D25320 / R25320C4: got 'n.a.'
## Warning: Expecting numeric in D25321 / R25321C4: got 'n.a.'
## Warning: Expecting numeric in D25322 / R25322C4: got 'n.a.'
## Warning: Expecting numeric in D25323 / R25323C4: got 'n.a.'
## Warning: Expecting numeric in D25324 / R25324C4: got 'n.a.'
## Warning: Expecting numeric in D25325 / R25325C4: got 'n.a.'
## Warning: Expecting numeric in D25326 / R25326C4: got 'n.a.'
## Warning: Expecting numeric in D25327 / R25327C4: got 'n.a.'
## Warning: Expecting numeric in D25328 / R25328C4: got 'n.a.'
## Warning: Expecting numeric in D25329 / R25329C4: got 'n.a.'
## Warning: Expecting numeric in D25330 / R25330C4: got 'n.a.'
## Warning: Expecting numeric in D25331 / R25331C4: got 'n.a.'
## Warning: Expecting numeric in D25332 / R25332C4: got 'n.a.'
## Warning: Expecting numeric in D25333 / R25333C4: got 'n.a.'
## Warning: Expecting numeric in D25334 / R25334C4: got 'n.a.'
## Warning: Expecting numeric in D25335 / R25335C4: got 'n.a.'
## Warning: Expecting numeric in D25336 / R25336C4: got 'n.a.'
## Warning: Expecting numeric in D25337 / R25337C4: got 'n.a.'
## Warning: Expecting numeric in D25338 / R25338C4: got 'n.a.'
## Warning: Expecting numeric in D25339 / R25339C4: got 'n.a.'
## Warning: Expecting numeric in D25340 / R25340C4: got 'n.a.'
## Warning: Expecting numeric in D25341 / R25341C4: got 'n.a.'
## Warning: Expecting numeric in D25342 / R25342C4: got 'n.a.'
## Warning: Expecting numeric in D25343 / R25343C4: got 'n.a.'
## Warning: Expecting numeric in D25344 / R25344C4: got 'n.a.'
## Warning: Expecting numeric in D25345 / R25345C4: got 'n.a.'
## Warning: Expecting numeric in D25346 / R25346C4: got 'n.a.'
## Warning: Expecting numeric in D25347 / R25347C4: got 'n.a.'
## Warning: Expecting numeric in D25348 / R25348C4: got 'n.a.'
## Warning: Expecting numeric in D25349 / R25349C4: got 'n.a.'
## Warning: Expecting numeric in D25350 / R25350C4: got 'n.a.'
## Warning: Expecting numeric in D25351 / R25351C4: got 'n.a.'
## Warning: Expecting numeric in D25352 / R25352C4: got 'n.a.'
## Warning: Expecting numeric in D25353 / R25353C4: got 'n.a.'
## Warning: Expecting numeric in D25354 / R25354C4: got 'n.a.'
## Warning: Expecting numeric in D25355 / R25355C4: got 'n.a.'
## Warning: Expecting numeric in D25356 / R25356C4: got 'n.a.'
## Warning: Expecting numeric in D25357 / R25357C4: got 'n.a.'
## Warning: Expecting numeric in D25358 / R25358C4: got 'n.a.'
## Warning: Expecting numeric in D25359 / R25359C4: got 'n.a.'
## Warning: Expecting numeric in D25360 / R25360C4: got 'n.a.'
## Warning: Expecting numeric in D25361 / R25361C4: got 'n.a.'
## Warning: Expecting numeric in D25362 / R25362C4: got 'n.a.'
## Warning: Expecting numeric in D25363 / R25363C4: got 'n.a.'
## Warning: Expecting numeric in D25364 / R25364C4: got 'n.a.'
## Warning: Expecting numeric in D25365 / R25365C4: got 'n.a.'
## Warning: Expecting numeric in D25366 / R25366C4: got 'n.a.'
## Warning: Expecting numeric in D25367 / R25367C4: got 'n.a.'
## Warning: Expecting numeric in D25368 / R25368C4: got 'n.a.'
## Warning: Expecting numeric in D25369 / R25369C4: got 'n.a.'
## Warning: Expecting numeric in D25370 / R25370C4: got 'n.a.'
## Warning: Expecting numeric in D25371 / R25371C4: got 'n.a.'
## Warning: Expecting numeric in D25372 / R25372C4: got 'n.a.'
## Warning: Expecting numeric in D25373 / R25373C4: got 'n.a.'
## Warning: Expecting numeric in D25374 / R25374C4: got 'n.a.'
## Warning: Expecting numeric in D25375 / R25375C4: got 'n.a.'
## Warning: Expecting numeric in D25376 / R25376C4: got 'n.a.'
## Warning: Expecting numeric in D25377 / R25377C4: got 'n.a.'
## Warning: Expecting numeric in D25378 / R25378C4: got 'n.a.'
## Warning: Expecting numeric in D25379 / R25379C4: got 'n.a.'
## Warning: Expecting numeric in D25380 / R25380C4: got 'n.a.'
## Warning: Expecting numeric in D25381 / R25381C4: got 'n.a.'
## Warning: Expecting numeric in D25382 / R25382C4: got 'n.a.'
## Warning: Expecting numeric in D25383 / R25383C4: got 'n.a.'
## Warning: Expecting numeric in D25384 / R25384C4: got 'n.a.'
## Warning: Expecting numeric in D25385 / R25385C4: got 'n.a.'
## Warning: Expecting numeric in D25386 / R25386C4: got 'n.a.'
## Warning: Expecting numeric in D25387 / R25387C4: got 'n.a.'
## Warning: Expecting numeric in D25388 / R25388C4: got 'n.a.'
## Warning: Expecting numeric in D25389 / R25389C4: got 'n.a.'
## Warning: Expecting numeric in D25390 / R25390C4: got 'n.a.'
## Warning: Expecting numeric in D25391 / R25391C4: got 'n.a.'
## Warning: Expecting numeric in D25392 / R25392C4: got 'n.a.'
## Warning: Expecting numeric in D25393 / R25393C4: got 'n.a.'
## Warning: Expecting numeric in D25394 / R25394C4: got 'n.a.'
## Warning: Expecting numeric in D25395 / R25395C4: got 'n.a.'
## Warning: Expecting numeric in D25396 / R25396C4: got 'n.a.'
## Warning: Expecting numeric in D25397 / R25397C4: got 'n.a.'
## Warning: Expecting numeric in D25398 / R25398C4: got 'n.a.'
## Warning: Expecting numeric in D25399 / R25399C4: got 'n.a.'
## Warning: Expecting numeric in D25400 / R25400C4: got 'n.a.'
## Warning: Expecting numeric in D25401 / R25401C4: got 'n.a.'
## Warning: Expecting numeric in D25402 / R25402C4: got 'n.a.'
## Warning: Expecting numeric in D25403 / R25403C4: got 'n.a.'
## Warning: Expecting numeric in D25404 / R25404C4: got 'n.a.'
## Warning: Expecting numeric in D25405 / R25405C4: got 'n.a.'
## Warning: Expecting numeric in D25406 / R25406C4: got 'n.a.'
## Warning: Expecting numeric in D25407 / R25407C4: got 'n.a.'
## Warning: Expecting numeric in D25408 / R25408C4: got 'n.a.'
## Warning: Expecting numeric in D25409 / R25409C4: got 'n.a.'
## Warning: Expecting numeric in D25410 / R25410C4: got 'n.a.'
## Warning: Expecting numeric in D25411 / R25411C4: got 'n.a.'
## Warning: Expecting numeric in D25412 / R25412C4: got 'n.a.'
## Warning: Expecting numeric in D25413 / R25413C4: got 'n.a.'
## Warning: Expecting numeric in D25414 / R25414C4: got 'n.a.'
## Warning: Expecting numeric in D25415 / R25415C4: got 'n.a.'
## Warning: Expecting numeric in D25416 / R25416C4: got 'n.a.'
## Warning: Expecting numeric in D25417 / R25417C4: got 'n.a.'
## Warning: Expecting numeric in D25418 / R25418C4: got 'n.a.'
## Warning: Expecting numeric in D25419 / R25419C4: got 'n.a.'
## Warning: Expecting numeric in D25420 / R25420C4: got 'n.a.'
## Warning: Expecting numeric in D25421 / R25421C4: got 'n.a.'
## Warning: Expecting numeric in D25422 / R25422C4: got 'n.a.'
## Warning: Expecting numeric in D25423 / R25423C4: got 'n.a.'
## Warning: Expecting numeric in D25424 / R25424C4: got 'n.a.'
## Warning: Expecting numeric in D25425 / R25425C4: got 'n.a.'
## Warning: Expecting numeric in D25426 / R25426C4: got 'n.a.'
## Warning: Expecting numeric in D25427 / R25427C4: got 'n.a.'
## Warning: Expecting numeric in D25428 / R25428C4: got 'n.a.'
## Warning: Expecting numeric in D25429 / R25429C4: got 'n.a.'
## Warning: Expecting numeric in D25430 / R25430C4: got 'n.a.'
## Warning: Expecting numeric in D25431 / R25431C4: got 'n.a.'
## Warning: Expecting numeric in D25432 / R25432C4: got 'n.a.'
## Warning: Expecting numeric in D25433 / R25433C4: got 'n.a.'
## Warning: Expecting numeric in D25434 / R25434C4: got 'n.a.'
## Warning: Expecting numeric in D25435 / R25435C4: got 'n.a.'
## Warning: Expecting numeric in D25436 / R25436C4: got 'n.a.'
## Warning: Expecting numeric in D25437 / R25437C4: got 'n.a.'
## Warning: Expecting numeric in D25438 / R25438C4: got 'n.a.'
## Warning: Expecting numeric in D25439 / R25439C4: got 'n.a.'
## Warning: Expecting numeric in D25440 / R25440C4: got 'n.a.'
## Warning: Expecting numeric in D25441 / R25441C4: got 'n.a.'
## Warning: Expecting numeric in D25442 / R25442C4: got 'n.a.'
## Warning: Expecting numeric in D25443 / R25443C4: got 'n.a.'
## Warning: Expecting numeric in D25444 / R25444C4: got 'n.a.'
## Warning: Expecting numeric in D25445 / R25445C4: got 'n.a.'
## Warning: Expecting numeric in D25446 / R25446C4: got 'n.a.'
## Warning: Expecting numeric in D25447 / R25447C4: got 'n.a.'
## Warning: Expecting numeric in D25448 / R25448C4: got 'n.a.'
## Warning: Expecting numeric in D25449 / R25449C4: got 'n.a.'
## Warning: Expecting numeric in D25450 / R25450C4: got 'n.a.'
## Warning: Expecting numeric in D25451 / R25451C4: got 'n.a.'
## Warning: Expecting numeric in D25452 / R25452C4: got 'n.a.'
## Warning: Expecting numeric in D25453 / R25453C4: got 'n.a.'
## Warning: Expecting numeric in D25454 / R25454C4: got 'n.a.'
## Warning: Expecting numeric in D25455 / R25455C4: got 'n.a.'
## Warning: Expecting numeric in D25456 / R25456C4: got 'n.a.'
## Warning: Expecting numeric in D25457 / R25457C4: got 'n.a.'
## Warning: Expecting numeric in D25458 / R25458C4: got 'n.a.'
## Warning: Expecting numeric in D25459 / R25459C4: got 'n.a.'
## Warning: Expecting numeric in D25460 / R25460C4: got 'n.a.'
## Warning: Expecting numeric in D25461 / R25461C4: got 'n.a.'
## Warning: Expecting numeric in D25462 / R25462C4: got 'n.a.'
## Warning: Expecting numeric in D25463 / R25463C4: got 'n.a.'
## Warning: Expecting numeric in D25464 / R25464C4: got 'n.a.'
## Warning: Expecting numeric in D25465 / R25465C4: got 'n.a.'
## Warning: Expecting numeric in D25466 / R25466C4: got 'n.a.'
## Warning: Expecting numeric in D25467 / R25467C4: got 'n.a.'
## Warning: Expecting numeric in D25468 / R25468C4: got 'n.a.'
## Warning: Expecting numeric in D25469 / R25469C4: got 'n.a.'
## Warning: Expecting numeric in D25470 / R25470C4: got 'n.a.'
## Warning: Expecting numeric in D25471 / R25471C4: got 'n.a.'
## Warning: Expecting numeric in D25472 / R25472C4: got 'n.a.'
## Warning: Expecting numeric in D25473 / R25473C4: got 'n.a.'
## Warning: Expecting numeric in D25474 / R25474C4: got 'n.a.'
## Warning: Expecting numeric in D25475 / R25475C4: got 'n.a.'
## Warning: Expecting numeric in D25476 / R25476C4: got 'n.a.'
## Warning: Expecting numeric in D25477 / R25477C4: got 'n.a.'
## Warning: Expecting numeric in D25478 / R25478C4: got 'n.a.'
## Warning: Expecting numeric in D25479 / R25479C4: got 'n.a.'
## Warning: Expecting numeric in D25480 / R25480C4: got 'n.a.'
## Warning: Expecting numeric in D25481 / R25481C4: got 'n.a.'
## Warning: Expecting numeric in D25482 / R25482C4: got 'n.a.'
## Warning: Expecting numeric in D25483 / R25483C4: got 'n.a.'
## Warning: Expecting numeric in D25484 / R25484C4: got 'n.a.'
## Warning: Expecting numeric in D25485 / R25485C4: got 'n.a.'
## Warning: Expecting numeric in D25486 / R25486C4: got 'n.a.'
## Warning: Expecting numeric in D25487 / R25487C4: got 'n.a.'
## Warning: Expecting numeric in D25488 / R25488C4: got 'n.a.'
## Warning: Expecting numeric in D25489 / R25489C4: got 'n.a.'
## Warning: Expecting numeric in D25490 / R25490C4: got 'n.a.'
## Warning: Expecting numeric in D25491 / R25491C4: got 'n.a.'
## Warning: Expecting numeric in D25492 / R25492C4: got 'n.a.'
## Warning: Expecting numeric in D25493 / R25493C4: got 'n.a.'
## Warning: Expecting numeric in D25494 / R25494C4: got 'n.a.'
## Warning: Expecting numeric in D25495 / R25495C4: got 'n.a.'
## Warning: Expecting numeric in D25496 / R25496C4: got 'n.a.'
## Warning: Expecting numeric in D25497 / R25497C4: got 'n.a.'
## Warning: Expecting numeric in D25498 / R25498C4: got 'n.a.'
## Warning: Expecting numeric in D25499 / R25499C4: got 'n.a.'
## Warning: Expecting numeric in D25500 / R25500C4: got 'n.a.'
## Warning: Expecting numeric in D25501 / R25501C4: got 'n.a.'
## Warning: Expecting numeric in D25502 / R25502C4: got 'n.a.'
## Warning: Expecting numeric in D25503 / R25503C4: got 'n.a.'
## Warning: Expecting numeric in D25504 / R25504C4: got 'n.a.'
## Warning: Expecting numeric in D25505 / R25505C4: got 'n.a.'
## Warning: Expecting numeric in D25506 / R25506C4: got 'n.a.'
## Warning: Expecting numeric in D25507 / R25507C4: got 'n.a.'
## Warning: Expecting numeric in D25508 / R25508C4: got 'n.a.'
## Warning: Expecting numeric in D25509 / R25509C4: got 'n.a.'
## Warning: Expecting numeric in D25510 / R25510C4: got 'n.a.'
## Warning: Expecting numeric in D25511 / R25511C4: got 'n.a.'
## Warning: Expecting numeric in D25512 / R25512C4: got 'n.a.'
## Warning: Expecting numeric in D25513 / R25513C4: got 'n.a.'
## Warning: Expecting numeric in D25514 / R25514C4: got 'n.a.'
## Warning: Expecting numeric in D25515 / R25515C4: got 'n.a.'
## Warning: Expecting numeric in D25516 / R25516C4: got 'n.a.'
## Warning: Expecting numeric in D25517 / R25517C4: got 'n.a.'
## Warning: Expecting numeric in D25518 / R25518C4: got 'n.a.'
## Warning: Expecting numeric in D25519 / R25519C4: got 'n.a.'
## Warning: Expecting numeric in D25520 / R25520C4: got 'n.a.'
## Warning: Expecting numeric in D25521 / R25521C4: got 'n.a.'
## Warning: Expecting numeric in D25522 / R25522C4: got 'n.a.'
## Warning: Expecting numeric in D25523 / R25523C4: got 'n.a.'
## Warning: Expecting numeric in D25524 / R25524C4: got 'n.a.'
## Warning: Expecting numeric in D25525 / R25525C4: got 'n.a.'
## Warning: Expecting numeric in D25526 / R25526C4: got 'n.a.'
## Warning: Expecting numeric in D25527 / R25527C4: got 'n.a.'
## Warning: Expecting numeric in D25528 / R25528C4: got 'n.a.'
## Warning: Expecting numeric in D25529 / R25529C4: got 'n.a.'
## Warning: Expecting numeric in D25530 / R25530C4: got 'n.a.'
## Warning: Expecting numeric in D25531 / R25531C4: got 'n.a.'
## Warning: Expecting numeric in D25532 / R25532C4: got 'n.a.'
## Warning: Expecting numeric in D25533 / R25533C4: got 'n.a.'
## Warning: Expecting numeric in D25534 / R25534C4: got 'n.a.'
## Warning: Expecting numeric in D25535 / R25535C4: got 'n.a.'
## Warning: Expecting numeric in D25536 / R25536C4: got 'n.a.'
## Warning: Expecting numeric in D25537 / R25537C4: got 'n.a.'
## Warning: Expecting numeric in D25538 / R25538C4: got 'n.a.'
## Warning: Expecting numeric in D25539 / R25539C4: got 'n.a.'
## Warning: Expecting numeric in D25540 / R25540C4: got 'n.a.'
## Warning: Expecting numeric in D25541 / R25541C4: got 'n.a.'
## Warning: Expecting numeric in D25542 / R25542C4: got 'n.a.'
## Warning: Expecting numeric in D25543 / R25543C4: got 'n.a.'
## Warning: Expecting numeric in D25544 / R25544C4: got 'n.a.'
## Warning: Expecting numeric in D25545 / R25545C4: got 'n.a.'
## Warning: Expecting numeric in D25546 / R25546C4: got 'n.a.'
## Warning: Expecting numeric in D25547 / R25547C4: got 'n.a.'
## Warning: Expecting numeric in D25548 / R25548C4: got 'n.a.'
## Warning: Expecting numeric in D25549 / R25549C4: got 'n.a.'
## Warning: Expecting numeric in D25550 / R25550C4: got 'n.a.'
## Warning: Expecting numeric in D25551 / R25551C4: got 'n.a.'
## Warning: Expecting numeric in D25552 / R25552C4: got 'n.a.'
## Warning: Expecting numeric in D25553 / R25553C4: got 'n.a.'
## Warning: Expecting numeric in D25554 / R25554C4: got 'n.a.'
## Warning: Expecting numeric in D25555 / R25555C4: got 'n.a.'
## Warning: Expecting numeric in D25556 / R25556C4: got 'n.a.'
## Warning: Expecting numeric in D25557 / R25557C4: got 'n.a.'
## Warning: Expecting numeric in D25558 / R25558C4: got 'n.a.'
## Warning: Expecting numeric in D25559 / R25559C4: got 'n.a.'
## Warning: Expecting numeric in D25560 / R25560C4: got 'n.a.'
## Warning: Expecting numeric in D25561 / R25561C4: got 'n.a.'
## Warning: Expecting numeric in D25562 / R25562C4: got 'n.a.'
## Warning: Expecting numeric in D25563 / R25563C4: got 'n.a.'
## Warning: Expecting numeric in D25564 / R25564C4: got 'n.a.'
## Warning: Expecting numeric in D25565 / R25565C4: got 'n.a.'
## Warning: Expecting numeric in D25566 / R25566C4: got 'n.a.'
## Warning: Expecting numeric in D25567 / R25567C4: got 'n.a.'
## Warning: Expecting numeric in D25568 / R25568C4: got 'n.a.'
## Warning: Expecting numeric in D25569 / R25569C4: got 'n.a.'
## Warning: Expecting numeric in D25570 / R25570C4: got 'n.a.'
## Warning: Expecting numeric in D25571 / R25571C4: got 'n.a.'
## Warning: Expecting numeric in D25572 / R25572C4: got 'n.a.'
## Warning: Expecting numeric in D25573 / R25573C4: got 'n.a.'
## Warning: Expecting numeric in D25574 / R25574C4: got 'n.a.'
## Warning: Expecting numeric in D25575 / R25575C4: got 'n.a.'
## Warning: Expecting numeric in D25576 / R25576C4: got 'n.a.'
## Warning: Expecting numeric in D25577 / R25577C4: got 'n.a.'
## Warning: Expecting numeric in D25578 / R25578C4: got 'n.a.'
## Warning: Expecting numeric in D25579 / R25579C4: got 'n.a.'
## Warning: Expecting numeric in D25580 / R25580C4: got 'n.a.'
## Warning: Expecting numeric in D25581 / R25581C4: got 'n.a.'
## Warning: Expecting numeric in D25582 / R25582C4: got 'n.a.'
## Warning: Expecting numeric in D25583 / R25583C4: got 'n.a.'
## Warning: Expecting numeric in D25584 / R25584C4: got 'n.a.'
## Warning: Expecting numeric in D25585 / R25585C4: got 'n.a.'
## Warning: Expecting numeric in D25586 / R25586C4: got 'n.a.'
## Warning: Expecting numeric in D25587 / R25587C4: got 'n.a.'
## Warning: Expecting numeric in D25588 / R25588C4: got 'n.a.'
## Warning: Expecting numeric in D25589 / R25589C4: got 'n.a.'
## Warning: Expecting numeric in D25590 / R25590C4: got 'n.a.'
## Warning: Expecting numeric in D25591 / R25591C4: got 'n.a.'
## Warning: Expecting numeric in D25592 / R25592C4: got 'n.a.'
## Warning: Expecting numeric in D25593 / R25593C4: got 'n.a.'
## Warning: Expecting numeric in D25594 / R25594C4: got 'n.a.'
## Warning: Expecting numeric in D25595 / R25595C4: got 'n.a.'
## Warning: Expecting numeric in D25596 / R25596C4: got 'n.a.'
## Warning: Expecting numeric in D25597 / R25597C4: got 'n.a.'
## Warning: Expecting numeric in D25598 / R25598C4: got 'n.a.'
## Warning: Expecting numeric in D25599 / R25599C4: got 'n.a.'
## Warning: Expecting numeric in D25600 / R25600C4: got 'n.a.'
## Warning: Expecting numeric in D25601 / R25601C4: got 'n.a.'
## Warning: Expecting numeric in D25602 / R25602C4: got 'n.a.'
## Warning: Expecting numeric in D25603 / R25603C4: got 'n.a.'
## Warning: Expecting numeric in D25604 / R25604C4: got 'n.a.'
## Warning: Expecting numeric in D25605 / R25605C4: got 'n.a.'
## Warning: Expecting numeric in D25606 / R25606C4: got 'n.a.'
## Warning: Expecting numeric in D25607 / R25607C4: got 'n.a.'
## Warning: Expecting numeric in D25608 / R25608C4: got 'n.a.'
## Warning: Expecting numeric in D25609 / R25609C4: got 'n.a.'
## Warning: Expecting numeric in D25610 / R25610C4: got 'n.a.'
## Warning: Expecting numeric in D25611 / R25611C4: got 'n.a.'
## Warning: Expecting numeric in D25612 / R25612C4: got 'n.a.'
## Warning: Expecting numeric in D25613 / R25613C4: got 'n.a.'
## Warning: Expecting numeric in D25614 / R25614C4: got 'n.a.'
## Warning: Expecting numeric in D25615 / R25615C4: got 'n.a.'
## Warning: Expecting numeric in D25616 / R25616C4: got 'n.a.'
## Warning: Expecting numeric in D25617 / R25617C4: got 'n.a.'
## Warning: Expecting numeric in D25618 / R25618C4: got 'n.a.'
## Warning: Expecting numeric in D25619 / R25619C4: got 'n.a.'
## Warning: Expecting numeric in D25620 / R25620C4: got 'n.a.'
## Warning: Expecting numeric in D25621 / R25621C4: got 'n.a.'
## Warning: Expecting numeric in D25622 / R25622C4: got 'n.a.'
## Warning: Expecting numeric in D25623 / R25623C4: got 'n.a.'
## Warning: Expecting numeric in D25624 / R25624C4: got 'n.a.'
## Warning: Expecting numeric in D25625 / R25625C4: got 'n.a.'
## Warning: Expecting numeric in D25626 / R25626C4: got 'n.a.'
## Warning: Expecting numeric in D25627 / R25627C4: got 'n.a.'
## Warning: Expecting numeric in D25628 / R25628C4: got 'n.a.'
## Warning: Expecting numeric in D25629 / R25629C4: got 'n.a.'
## Warning: Expecting numeric in D25630 / R25630C4: got 'n.a.'
## Warning: Expecting numeric in D25631 / R25631C4: got 'n.a.'
## Warning: Expecting numeric in D25632 / R25632C4: got 'n.a.'
## Warning: Expecting numeric in D25633 / R25633C4: got 'n.a.'
## Warning: Expecting numeric in D25634 / R25634C4: got 'n.a.'
## Warning: Expecting numeric in D25635 / R25635C4: got 'n.a.'
## Warning: Expecting numeric in D25636 / R25636C4: got 'n.a.'
## Warning: Expecting numeric in D25637 / R25637C4: got 'n.a.'
## Warning: Expecting numeric in D25638 / R25638C4: got 'n.a.'
## Warning: Expecting numeric in D25639 / R25639C4: got 'n.a.'
## Warning: Expecting numeric in D25640 / R25640C4: got 'n.a.'
## Warning: Expecting numeric in D25641 / R25641C4: got 'n.a.'
## Warning: Expecting numeric in D25642 / R25642C4: got 'n.a.'
## Warning: Expecting numeric in D25643 / R25643C4: got 'n.a.'
## Warning: Expecting numeric in D25644 / R25644C4: got 'n.a.'
## Warning: Expecting numeric in D25645 / R25645C4: got 'n.a.'
## Warning: Expecting numeric in D25646 / R25646C4: got 'n.a.'
## Warning: Expecting numeric in D25647 / R25647C4: got 'n.a.'
## Warning: Expecting numeric in D25648 / R25648C4: got 'n.a.'
## Warning: Expecting numeric in D25649 / R25649C4: got 'n.a.'
## Warning: Expecting numeric in D25650 / R25650C4: got 'n.a.'
## Warning: Expecting numeric in D25651 / R25651C4: got 'n.a.'
## Warning: Expecting numeric in D25652 / R25652C4: got 'n.a.'
## Warning: Expecting numeric in D25653 / R25653C4: got 'n.a.'
## Warning: Expecting numeric in D25654 / R25654C4: got 'n.a.'
## Warning: Expecting numeric in D25655 / R25655C4: got 'n.a.'
## Warning: Expecting numeric in D25656 / R25656C4: got 'n.a.'
## Warning: Expecting numeric in D25657 / R25657C4: got 'n.a.'
## Warning: Expecting numeric in D25658 / R25658C4: got 'n.a.'
## Warning: Expecting numeric in D25659 / R25659C4: got 'n.a.'
## Warning: Expecting numeric in D25660 / R25660C4: got 'n.a.'
## Warning: Expecting numeric in D25661 / R25661C4: got 'n.a.'
## Warning: Expecting numeric in D25662 / R25662C4: got 'n.a.'
## Warning: Expecting numeric in D25663 / R25663C4: got 'n.a.'
## Warning: Expecting numeric in D25664 / R25664C4: got 'n.a.'
## Warning: Expecting numeric in D25665 / R25665C4: got 'n.a.'
## Warning: Expecting numeric in D25666 / R25666C4: got 'n.a.'
## Warning: Expecting numeric in D25667 / R25667C4: got 'n.a.'
## Warning: Expecting numeric in D25668 / R25668C4: got 'n.a.'
## Warning: Expecting numeric in D25669 / R25669C4: got 'n.a.'
## Warning: Expecting numeric in D25670 / R25670C4: got 'n.a.'
## Warning: Expecting numeric in D25671 / R25671C4: got 'n.a.'
## Warning: Expecting numeric in D25672 / R25672C4: got 'n.a.'
## Warning: Expecting numeric in D25673 / R25673C4: got 'n.a.'
## Warning: Expecting numeric in D25674 / R25674C4: got 'n.a.'
## Warning: Expecting numeric in D25675 / R25675C4: got 'n.a.'
## Warning: Expecting numeric in D25676 / R25676C4: got 'n.a.'
## Warning: Expecting numeric in D25677 / R25677C4: got 'n.a.'
## Warning: Expecting numeric in D25678 / R25678C4: got 'n.a.'
## Warning: Expecting numeric in D25679 / R25679C4: got 'n.a.'
## Warning: Expecting numeric in D25680 / R25680C4: got 'n.a.'
## Warning: Expecting numeric in D25681 / R25681C4: got 'n.a.'
## Warning: Expecting numeric in D25682 / R25682C4: got 'n.a.'
## Warning: Expecting numeric in D25683 / R25683C4: got 'n.a.'
## Warning: Expecting numeric in D25684 / R25684C4: got 'n.a.'
## Warning: Expecting numeric in D25685 / R25685C4: got 'n.a.'
## Warning: Expecting numeric in D25686 / R25686C4: got 'n.a.'
## Warning: Expecting numeric in D25687 / R25687C4: got 'n.a.'
## Warning: Expecting numeric in D25688 / R25688C4: got 'n.a.'
## Warning: Expecting numeric in D25689 / R25689C4: got 'n.a.'
## Warning: Expecting numeric in D25690 / R25690C4: got 'n.a.'
## Warning: Expecting numeric in D25691 / R25691C4: got 'n.a.'
## Warning: Expecting numeric in D25692 / R25692C4: got 'n.a.'
## Warning: Expecting numeric in D25693 / R25693C4: got 'n.a.'
## Warning: Expecting numeric in D25694 / R25694C4: got 'n.a.'
## Warning: Expecting numeric in D25695 / R25695C4: got 'n.a.'
## Warning: Expecting numeric in D25696 / R25696C4: got 'n.a.'
## Warning: Expecting numeric in D25697 / R25697C4: got 'n.a.'
## Warning: Expecting numeric in D25698 / R25698C4: got 'n.a.'
## Warning: Expecting numeric in D25699 / R25699C4: got 'n.a.'
## Warning: Expecting numeric in D25700 / R25700C4: got 'n.a.'
## Warning: Expecting numeric in D25701 / R25701C4: got 'n.a.'
## Warning: Expecting numeric in D25702 / R25702C4: got 'n.a.'
## Warning: Expecting numeric in D25703 / R25703C4: got 'n.a.'
## Warning: Expecting numeric in D25704 / R25704C4: got 'n.a.'
## Warning: Expecting numeric in D25705 / R25705C4: got 'n.a.'
## Warning: Expecting numeric in D25706 / R25706C4: got 'n.a.'
## Warning: Expecting numeric in D25707 / R25707C4: got 'n.a.'
## Warning: Expecting numeric in D25708 / R25708C4: got 'n.a.'
## Warning: Expecting numeric in D25709 / R25709C4: got 'n.a.'
## Warning: Expecting numeric in D25710 / R25710C4: got 'n.a.'
## Warning: Expecting numeric in D25711 / R25711C4: got 'n.a.'
## Warning: Expecting numeric in D25712 / R25712C4: got 'n.a.'
## Warning: Expecting numeric in D25713 / R25713C4: got 'n.a.'
## Warning: Expecting numeric in D25714 / R25714C4: got 'n.a.'
## Warning: Expecting numeric in D25715 / R25715C4: got 'n.a.'
## Warning: Expecting numeric in D25716 / R25716C4: got 'n.a.'
## Warning: Expecting numeric in D25717 / R25717C4: got 'n.a.'
## Warning: Expecting numeric in D25718 / R25718C4: got 'n.a.'
## Warning: Expecting numeric in D25719 / R25719C4: got 'n.a.'
## Warning: Expecting numeric in D25720 / R25720C4: got 'n.a.'
## Warning: Expecting numeric in D25721 / R25721C4: got 'n.a.'
## Warning: Expecting numeric in D25722 / R25722C4: got 'n.a.'
## Warning: Expecting numeric in D25723 / R25723C4: got 'n.a.'
## Warning: Expecting numeric in D25724 / R25724C4: got 'n.a.'
## Warning: Expecting numeric in D25725 / R25725C4: got 'n.a.'
## Warning: Expecting numeric in D25726 / R25726C4: got 'n.a.'
## Warning: Expecting numeric in D25727 / R25727C4: got 'n.a.'
## Warning: Expecting numeric in D25728 / R25728C4: got 'n.a.'
## Warning: Expecting numeric in D25729 / R25729C4: got 'n.a.'
## Warning: Expecting numeric in D25730 / R25730C4: got 'n.a.'
## Warning: Expecting numeric in D25731 / R25731C4: got 'n.a.'
## Warning: Expecting numeric in D25732 / R25732C4: got 'n.a.'
## Warning: Expecting numeric in D25733 / R25733C4: got 'n.a.'
## Warning: Expecting numeric in D25734 / R25734C4: got 'n.a.'
## Warning: Expecting numeric in D25735 / R25735C4: got 'n.a.'
## Warning: Expecting numeric in D25736 / R25736C4: got 'n.a.'
## Warning: Expecting numeric in D25737 / R25737C4: got 'n.a.'
## Warning: Expecting numeric in D25738 / R25738C4: got 'n.a.'
## Warning: Expecting numeric in D25739 / R25739C4: got 'n.a.'
## Warning: Expecting numeric in D25740 / R25740C4: got 'n.a.'
## Warning: Expecting numeric in D25741 / R25741C4: got 'n.a.'
## Warning: Expecting numeric in D25742 / R25742C4: got 'n.a.'
## Warning: Expecting numeric in D25743 / R25743C4: got 'n.a.'
## Warning: Expecting numeric in D25744 / R25744C4: got 'n.a.'
## Warning: Expecting numeric in D25745 / R25745C4: got 'n.a.'
## Warning: Expecting numeric in D25746 / R25746C4: got 'n.a.'
## Warning: Expecting numeric in D25747 / R25747C4: got 'n.a.'
## Warning: Expecting numeric in D25748 / R25748C4: got 'n.a.'
## Warning: Expecting numeric in D25749 / R25749C4: got 'n.a.'
## Warning: Expecting numeric in D25750 / R25750C4: got 'n.a.'
## Warning: Expecting numeric in D25751 / R25751C4: got 'n.a.'
## Warning: Expecting numeric in D25752 / R25752C4: got 'n.a.'
## Warning: Expecting numeric in D25753 / R25753C4: got 'n.a.'
## Warning: Expecting numeric in D25754 / R25754C4: got 'n.a.'
## Warning: Expecting numeric in D25755 / R25755C4: got 'n.a.'
## Warning: Expecting numeric in D25756 / R25756C4: got 'n.a.'
## Warning: Expecting numeric in D25757 / R25757C4: got 'n.a.'
## Warning: Expecting numeric in D25758 / R25758C4: got 'n.a.'
## Warning: Expecting numeric in D25759 / R25759C4: got 'n.a.'
## Warning: Expecting numeric in D25760 / R25760C4: got 'n.a.'
## Warning: Expecting numeric in D25761 / R25761C4: got 'n.a.'
## Warning: Expecting numeric in D25762 / R25762C4: got 'n.a.'
## Warning: Expecting numeric in D25763 / R25763C4: got 'n.a.'
## Warning: Expecting numeric in D25764 / R25764C4: got 'n.a.'
## Warning: Expecting numeric in D25765 / R25765C4: got 'n.a.'
## Warning: Expecting numeric in D25766 / R25766C4: got 'n.a.'
## Warning: Expecting numeric in D25767 / R25767C4: got 'n.a.'
## Warning: Expecting numeric in D25768 / R25768C4: got 'n.a.'
## Warning: Expecting numeric in D25769 / R25769C4: got 'n.a.'
## Warning: Expecting numeric in D25770 / R25770C4: got 'n.a.'
## Warning: Expecting numeric in D25771 / R25771C4: got 'n.a.'
## Warning: Expecting numeric in D25772 / R25772C4: got 'n.a.'
## Warning: Expecting numeric in D25773 / R25773C4: got 'n.a.'
## Warning: Expecting numeric in D25774 / R25774C4: got 'n.a.'
## Warning: Expecting numeric in D25775 / R25775C4: got 'n.a.'
## Warning: Expecting numeric in D25776 / R25776C4: got 'n.a.'
## Warning: Expecting numeric in D25777 / R25777C4: got 'n.a.'
## Warning: Expecting numeric in D25778 / R25778C4: got 'n.a.'
## Warning: Expecting numeric in D25779 / R25779C4: got 'n.a.'
## Warning: Expecting numeric in D25780 / R25780C4: got 'n.a.'
## Warning: Expecting numeric in D25781 / R25781C4: got 'n.a.'
## Warning: Expecting numeric in D25782 / R25782C4: got 'n.a.'
## Warning: Expecting numeric in D25783 / R25783C4: got 'n.a.'
## Warning: Expecting numeric in D25784 / R25784C4: got 'n.a.'
## Warning: Expecting numeric in D25785 / R25785C4: got 'n.a.'
## Warning: Expecting numeric in D25786 / R25786C4: got 'n.a.'
## Warning: Expecting numeric in D25787 / R25787C4: got 'n.a.'
## Warning: Expecting numeric in D25788 / R25788C4: got 'n.a.'
## Warning: Expecting numeric in D25789 / R25789C4: got 'n.a.'
## Warning: Expecting numeric in D25790 / R25790C4: got 'n.a.'
## Warning: Expecting numeric in D25791 / R25791C4: got 'n.a.'
## Warning: Expecting numeric in D25792 / R25792C4: got 'n.a.'
## Warning: Expecting numeric in D25793 / R25793C4: got 'n.a.'
## Warning: Expecting numeric in D25794 / R25794C4: got 'n.a.'
## Warning: Expecting numeric in D25795 / R25795C4: got 'n.a.'
## Warning: Expecting numeric in D25796 / R25796C4: got 'n.a.'
## Warning: Expecting numeric in D25797 / R25797C4: got 'n.a.'
## Warning: Expecting numeric in D25798 / R25798C4: got 'n.a.'
## Warning: Expecting numeric in D25799 / R25799C4: got 'n.a.'
## Warning: Expecting numeric in D25800 / R25800C4: got 'n.a.'
## Warning: Expecting numeric in D25801 / R25801C4: got 'n.a.'
## Warning: Expecting numeric in D25802 / R25802C4: got 'n.a.'
## Warning: Expecting numeric in D25803 / R25803C4: got 'n.a.'
## Warning: Expecting numeric in D25804 / R25804C4: got 'n.a.'
## Warning: Expecting numeric in D25805 / R25805C4: got 'n.a.'
## Warning: Expecting numeric in D25806 / R25806C4: got 'n.a.'
## Warning: Expecting numeric in D25807 / R25807C4: got 'n.a.'
## Warning: Expecting numeric in D25808 / R25808C4: got 'n.a.'
## Warning: Expecting numeric in D25809 / R25809C4: got 'n.a.'
## Warning: Expecting numeric in D25810 / R25810C4: got 'n.a.'
## Warning: Expecting numeric in D25811 / R25811C4: got 'n.a.'
## Warning: Expecting numeric in D25812 / R25812C4: got 'n.a.'
## Warning: Expecting numeric in D25813 / R25813C4: got 'n.a.'
## Warning: Expecting numeric in D25814 / R25814C4: got 'n.a.'
## Warning: Expecting numeric in D25815 / R25815C4: got 'n.a.'
## Warning: Expecting numeric in D25816 / R25816C4: got 'n.a.'
## Warning: Expecting numeric in D25817 / R25817C4: got 'n.a.'
## Warning: Expecting numeric in D25818 / R25818C4: got 'n.a.'
## Warning: Expecting numeric in D25819 / R25819C4: got 'n.a.'
## Warning: Expecting numeric in D25820 / R25820C4: got 'n.a.'
## Warning: Expecting numeric in D25821 / R25821C4: got 'n.a.'
## Warning: Expecting numeric in D25822 / R25822C4: got 'n.a.'
## Warning: Expecting numeric in D25823 / R25823C4: got 'n.a.'
## Warning: Expecting numeric in D25824 / R25824C4: got 'n.a.'
## Warning: Expecting numeric in D25825 / R25825C4: got 'n.a.'
## Warning: Expecting numeric in D25826 / R25826C4: got 'n.a.'
## Warning: Expecting numeric in D25827 / R25827C4: got 'n.a.'
## Warning: Expecting numeric in D25828 / R25828C4: got 'n.a.'
## Warning: Expecting numeric in D25829 / R25829C4: got 'n.a.'
## Warning: Expecting numeric in D25830 / R25830C4: got 'n.a.'
## Warning: Expecting numeric in D25831 / R25831C4: got 'n.a.'
## Warning: Expecting numeric in D25832 / R25832C4: got 'n.a.'
## Warning: Expecting numeric in D25833 / R25833C4: got 'n.a.'
## Warning: Expecting numeric in D25834 / R25834C4: got 'n.a.'
## Warning: Expecting numeric in D25835 / R25835C4: got 'n.a.'
## Warning: Expecting numeric in D25836 / R25836C4: got 'n.a.'
## Warning: Expecting numeric in D25837 / R25837C4: got 'n.a.'
## Warning: Expecting numeric in D25838 / R25838C4: got 'n.a.'
## Warning: Expecting numeric in D25839 / R25839C4: got 'n.a.'
## Warning: Expecting numeric in D25840 / R25840C4: got 'n.a.'
## Warning: Expecting numeric in D25841 / R25841C4: got 'n.a.'
## Warning: Expecting numeric in D25842 / R25842C4: got 'n.a.'
## Warning: Expecting numeric in D25843 / R25843C4: got 'n.a.'
## Warning: Expecting numeric in D25844 / R25844C4: got 'n.a.'
## Warning: Expecting numeric in D25845 / R25845C4: got 'n.a.'
## Warning: Expecting numeric in D25846 / R25846C4: got 'n.a.'
## Warning: Expecting numeric in D25847 / R25847C4: got 'n.a.'
## Warning: Expecting numeric in D25848 / R25848C4: got 'n.a.'
## Warning: Expecting numeric in D25849 / R25849C4: got 'n.a.'
## Warning: Expecting numeric in D25850 / R25850C4: got 'n.a.'
## Warning: Expecting numeric in D25851 / R25851C4: got 'n.a.'
## Warning: Expecting numeric in D25852 / R25852C4: got 'n.a.'
## Warning: Expecting numeric in D25853 / R25853C4: got 'n.a.'
## Warning: Expecting numeric in D25854 / R25854C4: got 'n.a.'
## Warning: Expecting numeric in D25855 / R25855C4: got 'n.a.'
## Warning: Expecting numeric in D25856 / R25856C4: got 'n.a.'
## Warning: Expecting numeric in D25857 / R25857C4: got 'n.a.'
## Warning: Expecting numeric in D25858 / R25858C4: got 'n.a.'
## Warning: Expecting numeric in D25859 / R25859C4: got 'n.a.'
## Warning: Expecting numeric in D25860 / R25860C4: got 'n.a.'
## Warning: Expecting numeric in D25861 / R25861C4: got 'n.a.'
## Warning: Expecting numeric in D25862 / R25862C4: got 'n.a.'
## Warning: Expecting numeric in D25863 / R25863C4: got 'n.a.'
## Warning: Expecting numeric in D25864 / R25864C4: got 'n.a.'
## Warning: Expecting numeric in D25865 / R25865C4: got 'n.a.'
## Warning: Expecting numeric in D25866 / R25866C4: got 'n.a.'
## Warning: Expecting numeric in D25867 / R25867C4: got 'n.a.'
## Warning: Expecting numeric in D25868 / R25868C4: got 'n.a.'
## Warning: Expecting numeric in D25869 / R25869C4: got 'n.a.'
## Warning: Expecting numeric in D25870 / R25870C4: got 'n.a.'
## Warning: Expecting numeric in D25871 / R25871C4: got 'n.a.'
## Warning: Expecting numeric in D25872 / R25872C4: got 'n.a.'
## Warning: Expecting numeric in D25873 / R25873C4: got 'n.a.'
## Warning: Expecting numeric in D25874 / R25874C4: got 'n.a.'
## Warning: Expecting numeric in D25875 / R25875C4: got 'n.a.'
## Warning: Expecting numeric in D25876 / R25876C4: got 'n.a.'
## Warning: Expecting numeric in D25877 / R25877C4: got 'n.a.'
## Warning: Expecting numeric in D25878 / R25878C4: got 'n.a.'
## Warning: Expecting numeric in D25879 / R25879C4: got 'n.a.'
## Warning: Expecting numeric in D25880 / R25880C4: got 'n.a.'
## Warning: Expecting numeric in D25881 / R25881C4: got 'n.a.'
## Warning: Expecting numeric in D25882 / R25882C4: got 'n.a.'
## Warning: Expecting numeric in D25883 / R25883C4: got 'n.a.'
## Warning: Expecting numeric in D25884 / R25884C4: got 'n.a.'
## Warning: Expecting numeric in D25885 / R25885C4: got 'n.a.'
## Warning: Expecting numeric in D25886 / R25886C4: got 'n.a.'
## Warning: Expecting numeric in D25887 / R25887C4: got 'n.a.'
## Warning: Expecting numeric in D25888 / R25888C4: got 'n.a.'
## Warning: Expecting numeric in D25889 / R25889C4: got 'n.a.'
## Warning: Expecting numeric in D25890 / R25890C4: got 'n.a.'
## Warning: Expecting numeric in D25891 / R25891C4: got 'n.a.'
## Warning: Expecting numeric in D25892 / R25892C4: got 'n.a.'
## Warning: Expecting numeric in D25893 / R25893C4: got 'n.a.'
## Warning: Expecting numeric in D25894 / R25894C4: got 'n.a.'
## Warning: Expecting numeric in D25895 / R25895C4: got 'n.a.'
## Warning: Expecting numeric in D25896 / R25896C4: got 'n.a.'
## Warning: Expecting numeric in D25897 / R25897C4: got 'n.a.'
## Warning: Expecting numeric in D25898 / R25898C4: got 'n.a.'
## Warning: Expecting numeric in D25899 / R25899C4: got 'n.a.'
## Warning: Expecting numeric in D25900 / R25900C4: got 'n.a.'
## Warning: Expecting numeric in D25901 / R25901C4: got 'n.a.'
## Warning: Expecting numeric in D25902 / R25902C4: got 'n.a.'
## Warning: Expecting numeric in D25903 / R25903C4: got 'n.a.'
## Warning: Expecting numeric in D25904 / R25904C4: got 'n.a.'
## Warning: Expecting numeric in D25905 / R25905C4: got 'n.a.'
## Warning: Expecting numeric in D25906 / R25906C4: got 'n.a.'
## Warning: Expecting numeric in D25907 / R25907C4: got 'n.a.'
## Warning: Expecting numeric in D25908 / R25908C4: got 'n.a.'
## Warning: Expecting numeric in D25909 / R25909C4: got 'n.a.'
## Warning: Expecting numeric in D25910 / R25910C4: got 'n.a.'
## Warning: Expecting numeric in D25911 / R25911C4: got 'n.a.'
## Warning: Expecting numeric in D25912 / R25912C4: got 'n.a.'
## Warning: Expecting numeric in D25913 / R25913C4: got 'n.a.'
## Warning: Expecting numeric in D25914 / R25914C4: got 'n.a.'
## Warning: Expecting numeric in D25915 / R25915C4: got 'n.a.'
## Warning: Expecting numeric in D25916 / R25916C4: got 'n.a.'
## Warning: Expecting numeric in D25917 / R25917C4: got 'n.a.'
## Warning: Expecting numeric in D25918 / R25918C4: got 'n.a.'
## Warning: Expecting numeric in D25919 / R25919C4: got 'n.a.'
## Warning: Expecting numeric in D25920 / R25920C4: got 'n.a.'
## Warning: Expecting numeric in D25921 / R25921C4: got 'n.a.'
## Warning: Expecting numeric in D25922 / R25922C4: got 'n.a.'
## Warning: Expecting numeric in D25923 / R25923C4: got 'n.a.'
## Warning: Expecting numeric in D25924 / R25924C4: got 'n.a.'
## Warning: Expecting numeric in D25925 / R25925C4: got 'n.a.'
## Warning: Expecting numeric in D25926 / R25926C4: got 'n.a.'
## Warning: Expecting numeric in D25927 / R25927C4: got 'n.a.'
## Warning: Expecting numeric in D25928 / R25928C4: got 'n.a.'
## Warning: Expecting numeric in D25929 / R25929C4: got 'n.a.'
## Warning: Expecting numeric in D25930 / R25930C4: got 'n.a.'
## Warning: Expecting numeric in D25931 / R25931C4: got 'n.a.'
## Warning: Expecting numeric in D25932 / R25932C4: got 'n.a.'
## Warning: Expecting numeric in D25933 / R25933C4: got 'n.a.'
## Warning: Expecting numeric in D25934 / R25934C4: got 'n.a.'
## Warning: Expecting numeric in D25935 / R25935C4: got 'n.a.'
## Warning: Expecting numeric in D25936 / R25936C4: got 'n.a.'
## Warning: Expecting numeric in D25937 / R25937C4: got 'n.a.'
## Warning: Expecting numeric in D25938 / R25938C4: got 'n.a.'
## Warning: Expecting numeric in D25939 / R25939C4: got 'n.a.'
## Warning: Expecting numeric in D25940 / R25940C4: got 'n.a.'
## Warning: Expecting numeric in D25941 / R25941C4: got 'n.a.'
## Warning: Expecting numeric in D25942 / R25942C4: got 'n.a.'
## Warning: Expecting numeric in D25943 / R25943C4: got 'n.a.'
## Warning: Expecting numeric in D25944 / R25944C4: got 'n.a.'
## Warning: Expecting numeric in D25945 / R25945C4: got 'n.a.'
## Warning: Expecting numeric in D25946 / R25946C4: got 'n.a.'
## Warning: Expecting numeric in D25947 / R25947C4: got 'n.a.'
## Warning: Expecting numeric in D25948 / R25948C4: got 'n.a.'
## Warning: Expecting numeric in D25949 / R25949C4: got 'n.a.'
## Warning: Expecting numeric in D25950 / R25950C4: got 'n.a.'
## Warning: Expecting numeric in D25951 / R25951C4: got 'n.a.'
## Warning: Expecting numeric in D25952 / R25952C4: got 'n.a.'
## Warning: Expecting numeric in D25953 / R25953C4: got 'n.a.'
## Warning: Expecting numeric in D25954 / R25954C4: got 'n.a.'
## Warning: Expecting numeric in D25955 / R25955C4: got 'n.a.'
## Warning: Expecting numeric in D25956 / R25956C4: got 'n.a.'
## Warning: Expecting numeric in D25957 / R25957C4: got 'n.a.'
## Warning: Expecting numeric in D25958 / R25958C4: got 'n.a.'
## Warning: Expecting numeric in D25959 / R25959C4: got 'n.a.'
## Warning: Expecting numeric in D25960 / R25960C4: got 'n.a.'
## Warning: Expecting numeric in D25961 / R25961C4: got 'n.a.'
## Warning: Expecting numeric in D25962 / R25962C4: got 'n.a.'
## Warning: Expecting numeric in D25963 / R25963C4: got 'n.a.'
## Warning: Expecting numeric in D25964 / R25964C4: got 'n.a.'
## Warning: Expecting numeric in D25965 / R25965C4: got 'n.a.'
## Warning: Expecting numeric in D25966 / R25966C4: got 'n.a.'
## Warning: Expecting numeric in D25967 / R25967C4: got 'n.a.'
## Warning: Expecting numeric in D25968 / R25968C4: got 'n.a.'
## Warning: Expecting numeric in D25969 / R25969C4: got 'n.a.'
## Warning: Expecting numeric in D25970 / R25970C4: got 'n.a.'
## Warning: Expecting numeric in D25971 / R25971C4: got 'n.a.'
## Warning: Expecting numeric in D25972 / R25972C4: got 'n.a.'
## Warning: Expecting numeric in D25973 / R25973C4: got 'n.a.'
## Warning: Expecting numeric in D25974 / R25974C4: got 'n.a.'
## Warning: Expecting numeric in D25975 / R25975C4: got 'n.a.'
## Warning: Expecting numeric in D25976 / R25976C4: got 'n.a.'
## Warning: Expecting numeric in D25977 / R25977C4: got 'n.a.'
## Warning: Expecting numeric in D25978 / R25978C4: got 'n.a.'
## Warning: Expecting numeric in D25979 / R25979C4: got 'n.a.'
## Warning: Expecting numeric in D25980 / R25980C4: got 'n.a.'
## Warning: Expecting numeric in D25981 / R25981C4: got 'n.a.'
## Warning: Expecting numeric in D25982 / R25982C4: got 'n.a.'
## Warning: Expecting numeric in D25983 / R25983C4: got 'n.a.'
## Warning: Expecting numeric in D25984 / R25984C4: got 'n.a.'
## Warning: Expecting numeric in D25985 / R25985C4: got 'n.a.'
## Warning: Expecting numeric in D25986 / R25986C4: got 'n.a.'
## Warning: Expecting numeric in D25987 / R25987C4: got 'n.a.'
## Warning: Expecting numeric in D25988 / R25988C4: got 'n.a.'
## Warning: Expecting numeric in D25989 / R25989C4: got 'n.a.'
## Warning: Expecting numeric in D25990 / R25990C4: got 'n.a.'
## Warning: Expecting numeric in D25991 / R25991C4: got 'n.a.'
## Warning: Expecting numeric in D25992 / R25992C4: got 'n.a.'
## Warning: Expecting numeric in D25993 / R25993C4: got 'n.a.'
## Warning: Expecting numeric in D25994 / R25994C4: got 'n.a.'
## Warning: Expecting numeric in D25995 / R25995C4: got 'n.a.'
## Warning: Expecting numeric in D25996 / R25996C4: got 'n.a.'
## Warning: Expecting numeric in D25997 / R25997C4: got 'n.a.'
## Warning: Expecting numeric in D25998 / R25998C4: got 'n.a.'
## Warning: Expecting numeric in D25999 / R25999C4: got 'n.a.'
## Warning: Expecting numeric in D26000 / R26000C4: got 'n.a.'
## Warning: Expecting numeric in D26001 / R26001C4: got 'n.a.'
## Warning: Expecting numeric in D26002 / R26002C4: got 'n.a.'
## Warning: Expecting numeric in D26003 / R26003C4: got 'n.a.'
## Warning: Expecting numeric in D26004 / R26004C4: got 'n.a.'
## Warning: Expecting numeric in D26005 / R26005C4: got 'n.a.'
## Warning: Expecting numeric in D26006 / R26006C4: got 'n.a.'
## Warning: Expecting numeric in D26007 / R26007C4: got 'n.a.'
## Warning: Expecting numeric in D26008 / R26008C4: got 'n.a.'
## Warning: Expecting numeric in D26009 / R26009C4: got 'n.a.'
## Warning: Expecting numeric in D26010 / R26010C4: got 'n.a.'
## Warning: Expecting numeric in D26011 / R26011C4: got 'n.a.'
## Warning: Expecting numeric in D26012 / R26012C4: got 'n.a.'
## Warning: Expecting numeric in D26013 / R26013C4: got 'n.a.'
## Warning: Expecting numeric in D26014 / R26014C4: got 'n.a.'
## Warning: Expecting numeric in D26015 / R26015C4: got 'n.a.'
## Warning: Expecting numeric in D26016 / R26016C4: got 'n.a.'
## Warning: Expecting numeric in D26017 / R26017C4: got 'n.a.'
## Warning: Expecting numeric in D26018 / R26018C4: got 'n.a.'
## Warning: Expecting numeric in D26019 / R26019C4: got 'n.a.'
## Warning: Expecting numeric in D26020 / R26020C4: got 'n.a.'
## Warning: Expecting numeric in D26021 / R26021C4: got 'n.a.'
## Warning: Expecting numeric in D26022 / R26022C4: got 'n.a.'
## Warning: Expecting numeric in D26023 / R26023C4: got 'n.a.'
## Warning: Expecting numeric in D26024 / R26024C4: got 'n.a.'
## Warning: Expecting numeric in D26025 / R26025C4: got 'n.a.'
## Warning: Expecting numeric in D26026 / R26026C4: got 'n.a.'
## Warning: Expecting numeric in D26027 / R26027C4: got 'n.a.'
## Warning: Expecting numeric in D26028 / R26028C4: got 'n.a.'
## Warning: Expecting numeric in D26029 / R26029C4: got 'n.a.'
## Warning: Expecting numeric in D26030 / R26030C4: got 'n.a.'
## Warning: Expecting numeric in D26031 / R26031C4: got 'n.a.'
## Warning: Expecting numeric in D26032 / R26032C4: got 'n.a.'
## Warning: Expecting numeric in D26033 / R26033C4: got 'n.a.'
## Warning: Expecting numeric in D26034 / R26034C4: got 'n.a.'
## Warning: Expecting numeric in D26035 / R26035C4: got 'n.a.'
## Warning: Expecting numeric in D26036 / R26036C4: got 'n.a.'
## Warning: Expecting numeric in D26037 / R26037C4: got 'n.a.'
## Warning: Expecting numeric in D26038 / R26038C4: got 'n.a.'
## Warning: Expecting numeric in D26039 / R26039C4: got 'n.a.'
## Warning: Expecting numeric in D26040 / R26040C4: got 'n.a.'
## Warning: Expecting numeric in D26041 / R26041C4: got 'n.a.'
## Warning: Expecting numeric in D26042 / R26042C4: got 'n.a.'
## Warning: Expecting numeric in D26043 / R26043C4: got 'n.a.'
## Warning: Expecting numeric in D26044 / R26044C4: got 'n.a.'
## Warning: Expecting numeric in D26045 / R26045C4: got 'n.a.'
## Warning: Expecting numeric in D26046 / R26046C4: got 'n.a.'
## Warning: Expecting numeric in D26047 / R26047C4: got 'n.a.'
## Warning: Expecting numeric in D26048 / R26048C4: got 'n.a.'
## Warning: Expecting numeric in D26049 / R26049C4: got 'n.a.'
## Warning: Expecting numeric in D26050 / R26050C4: got 'n.a.'
## Warning: Expecting numeric in D26051 / R26051C4: got 'n.a.'
## Warning: Expecting numeric in D26052 / R26052C4: got 'n.a.'
## Warning: Expecting numeric in D26053 / R26053C4: got 'n.a.'
## Warning: Expecting numeric in D26054 / R26054C4: got 'n.a.'
## Warning: Expecting numeric in D26055 / R26055C4: got 'n.a.'
## Warning: Expecting numeric in D26056 / R26056C4: got 'n.a.'
## Warning: Expecting numeric in D26057 / R26057C4: got 'n.a.'
## Warning: Expecting numeric in D26058 / R26058C4: got 'n.a.'
## Warning: Expecting numeric in D26059 / R26059C4: got 'n.a.'
## Warning: Expecting numeric in D26060 / R26060C4: got 'n.a.'
## Warning: Expecting numeric in D26061 / R26061C4: got 'n.a.'
## Warning: Expecting numeric in D26062 / R26062C4: got 'n.a.'
## Warning: Expecting numeric in D26063 / R26063C4: got 'n.a.'
## Warning: Expecting numeric in D26064 / R26064C4: got 'n.a.'
## Warning: Expecting numeric in D26065 / R26065C4: got 'n.a.'
## Warning: Expecting numeric in D26066 / R26066C4: got 'n.a.'
## Warning: Expecting numeric in D26067 / R26067C4: got 'n.a.'
## Warning: Expecting numeric in D26068 / R26068C4: got 'n.a.'
## Warning: Expecting numeric in D26069 / R26069C4: got 'n.a.'
## Warning: Expecting numeric in D26070 / R26070C4: got 'n.a.'
## Warning: Expecting numeric in D26071 / R26071C4: got 'n.a.'
## Warning: Expecting numeric in D26072 / R26072C4: got 'n.a.'
## Warning: Expecting numeric in D26073 / R26073C4: got 'n.a.'
## Warning: Expecting numeric in D26074 / R26074C4: got 'n.a.'
## Warning: Expecting numeric in D26075 / R26075C4: got 'n.a.'
## Warning: Expecting numeric in D26076 / R26076C4: got 'n.a.'
## Warning: Expecting numeric in D26077 / R26077C4: got 'n.a.'
## Warning: Expecting numeric in D26078 / R26078C4: got 'n.a.'
## Warning: Expecting numeric in D26079 / R26079C4: got 'n.a.'
## Warning: Expecting numeric in D26080 / R26080C4: got 'n.a.'
## Warning: Expecting numeric in D26081 / R26081C4: got 'n.a.'
## Warning: Expecting numeric in D26082 / R26082C4: got 'n.a.'
## Warning: Expecting numeric in D26083 / R26083C4: got 'n.a.'
## Warning: Expecting numeric in D26084 / R26084C4: got 'n.a.'
## Warning: Expecting numeric in D26085 / R26085C4: got 'n.a.'
## Warning: Expecting numeric in D26086 / R26086C4: got 'n.a.'
## Warning: Expecting numeric in D26087 / R26087C4: got 'n.a.'
## Warning: Expecting numeric in D26088 / R26088C4: got 'n.a.'
## Warning: Expecting numeric in D26089 / R26089C4: got 'n.a.'
## Warning: Expecting numeric in D26090 / R26090C4: got 'n.a.'
## Warning: Expecting numeric in D26091 / R26091C4: got 'n.a.'
## Warning: Expecting numeric in D26092 / R26092C4: got 'n.a.'
## Warning: Expecting numeric in D26093 / R26093C4: got 'n.a.'
## Warning: Expecting numeric in D26094 / R26094C4: got 'n.a.'
## Warning: Expecting numeric in D26095 / R26095C4: got 'n.a.'
## Warning: Expecting numeric in D26096 / R26096C4: got 'n.a.'
## Warning: Expecting numeric in D26097 / R26097C4: got 'n.a.'
## Warning: Expecting numeric in D26098 / R26098C4: got 'n.a.'
## Warning: Expecting numeric in D26099 / R26099C4: got 'n.a.'
## Warning: Expecting numeric in D26100 / R26100C4: got 'n.a.'
## Warning: Expecting numeric in D26101 / R26101C4: got 'n.a.'
## Warning: Expecting numeric in D26102 / R26102C4: got 'n.a.'
## Warning: Expecting numeric in D26103 / R26103C4: got 'n.a.'
## Warning: Expecting numeric in D26104 / R26104C4: got 'n.a.'
## Warning: Expecting numeric in D26105 / R26105C4: got 'n.a.'
## Warning: Expecting numeric in D26106 / R26106C4: got 'n.a.'
## Warning: Expecting numeric in D26107 / R26107C4: got 'n.a.'
## Warning: Expecting numeric in D26108 / R26108C4: got 'n.a.'
## Warning: Expecting numeric in D26109 / R26109C4: got 'n.a.'
## Warning: Expecting numeric in D26110 / R26110C4: got 'n.a.'
## Warning: Expecting numeric in D26111 / R26111C4: got 'n.a.'
## Warning: Expecting numeric in D26112 / R26112C4: got 'n.a.'
## Warning: Expecting numeric in D26113 / R26113C4: got 'n.a.'
## Warning: Expecting numeric in D26114 / R26114C4: got 'n.a.'
## Warning: Expecting numeric in D26115 / R26115C4: got 'n.a.'
## Warning: Expecting numeric in D26116 / R26116C4: got 'n.a.'
## Warning: Expecting numeric in D26117 / R26117C4: got 'n.a.'
## Warning: Expecting numeric in D26118 / R26118C4: got 'n.a.'
## Warning: Expecting numeric in D26119 / R26119C4: got 'n.a.'
## Warning: Expecting numeric in D26120 / R26120C4: got 'n.a.'
## Warning: Expecting numeric in D26121 / R26121C4: got 'n.a.'
## Warning: Expecting numeric in D26122 / R26122C4: got 'n.a.'
## Warning: Expecting numeric in D26123 / R26123C4: got 'n.a.'
## Warning: Expecting numeric in D26124 / R26124C4: got 'n.a.'
## Warning: Expecting numeric in D26125 / R26125C4: got 'n.a.'
## Warning: Expecting numeric in D26126 / R26126C4: got 'n.a.'
## Warning: Expecting numeric in D26127 / R26127C4: got 'n.a.'
## Warning: Expecting numeric in D26128 / R26128C4: got 'n.a.'
## Warning: Expecting numeric in D26129 / R26129C4: got 'n.a.'
## Warning: Expecting numeric in D26130 / R26130C4: got 'n.a.'
## Warning: Expecting numeric in D26131 / R26131C4: got 'n.a.'
## Warning: Expecting numeric in D26132 / R26132C4: got 'n.a.'
## Warning: Expecting numeric in D26133 / R26133C4: got 'n.a.'
## Warning: Expecting numeric in D26134 / R26134C4: got 'n.a.'
## Warning: Expecting numeric in D26135 / R26135C4: got 'n.a.'
## Warning: Expecting numeric in D26136 / R26136C4: got 'n.a.'
## Warning: Expecting numeric in D26137 / R26137C4: got 'n.a.'
## Warning: Expecting numeric in D26138 / R26138C4: got 'n.a.'
## Warning: Expecting numeric in D26139 / R26139C4: got 'n.a.'
## Warning: Expecting numeric in D26140 / R26140C4: got 'n.a.'
## Warning: Expecting numeric in D26141 / R26141C4: got 'n.a.'
## Warning: Expecting numeric in D26142 / R26142C4: got 'n.a.'
## Warning: Expecting numeric in D26143 / R26143C4: got 'n.a.'
## Warning: Expecting numeric in D26144 / R26144C4: got 'n.a.'
## Warning: Expecting numeric in D26145 / R26145C4: got 'n.a.'
## Warning: Expecting numeric in D26146 / R26146C4: got 'n.a.'
## Warning: Expecting numeric in D26147 / R26147C4: got 'n.a.'
## Warning: Expecting numeric in D26148 / R26148C4: got 'n.a.'
## Warning: Expecting numeric in D26149 / R26149C4: got 'n.a.'
## Warning: Expecting numeric in D26150 / R26150C4: got 'n.a.'
## Warning: Expecting numeric in D26151 / R26151C4: got 'n.a.'
## Warning: Expecting numeric in D26152 / R26152C4: got 'n.a.'
## Warning: Expecting numeric in D26153 / R26153C4: got 'n.a.'
## Warning: Expecting numeric in D26154 / R26154C4: got 'n.a.'
## Warning: Expecting numeric in D26155 / R26155C4: got 'n.a.'
## Warning: Expecting numeric in D26156 / R26156C4: got 'n.a.'
## Warning: Expecting numeric in D26157 / R26157C4: got 'n.a.'
## Warning: Expecting numeric in D26158 / R26158C4: got 'n.a.'
## Warning: Expecting numeric in D26159 / R26159C4: got 'n.a.'
## Warning: Expecting numeric in D26160 / R26160C4: got 'n.a.'
## Warning: Expecting numeric in D26161 / R26161C4: got 'n.a.'
## Warning: Expecting numeric in D26162 / R26162C4: got 'n.a.'
## Warning: Expecting numeric in D26163 / R26163C4: got 'n.a.'
## Warning: Expecting numeric in D26164 / R26164C4: got 'n.a.'
## Warning: Expecting numeric in D26165 / R26165C4: got 'n.a.'
## Warning: Expecting numeric in D26166 / R26166C4: got 'n.a.'
## Warning: Expecting numeric in D26167 / R26167C4: got 'n.a.'
## Warning: Expecting numeric in D26168 / R26168C4: got 'n.a.'
## Warning: Expecting numeric in D26169 / R26169C4: got 'n.a.'
## Warning: Expecting numeric in D26170 / R26170C4: got 'n.a.'
## Warning: Expecting numeric in D26171 / R26171C4: got 'n.a.'
## Warning: Expecting numeric in D26172 / R26172C4: got 'n.a.'
## Warning: Expecting numeric in D26173 / R26173C4: got 'n.a.'
## Warning: Expecting numeric in D26174 / R26174C4: got 'n.a.'
## Warning: Expecting numeric in D26175 / R26175C4: got 'n.a.'
## Warning: Expecting numeric in D26176 / R26176C4: got 'n.a.'
## Warning: Expecting numeric in D26177 / R26177C4: got 'n.a.'
## Warning: Expecting numeric in D26178 / R26178C4: got 'n.a.'
## Warning: Expecting numeric in D26179 / R26179C4: got 'n.a.'
## Warning: Expecting numeric in D26180 / R26180C4: got 'n.a.'
## Warning: Expecting numeric in D26181 / R26181C4: got 'n.a.'
## Warning: Expecting numeric in D26182 / R26182C4: got 'n.a.'
## Warning: Expecting numeric in D26183 / R26183C4: got 'n.a.'
## Warning: Expecting numeric in D26184 / R26184C4: got 'n.a.'
## Warning: Expecting numeric in D26185 / R26185C4: got 'n.a.'
## Warning: Expecting numeric in D26186 / R26186C4: got 'n.a.'
## Warning: Expecting numeric in D26187 / R26187C4: got 'n.a.'
## Warning: Expecting numeric in D26188 / R26188C4: got 'n.a.'
## Warning: Expecting numeric in D26189 / R26189C4: got 'n.a.'
## Warning: Expecting numeric in D26190 / R26190C4: got 'n.a.'
## Warning: Expecting numeric in D26191 / R26191C4: got 'n.a.'
## Warning: Expecting numeric in D26192 / R26192C4: got 'n.a.'
## Warning: Expecting numeric in D26193 / R26193C4: got 'n.a.'
## Warning: Expecting numeric in D26194 / R26194C4: got 'n.a.'
## Warning: Expecting numeric in D26195 / R26195C4: got 'n.a.'
## Warning: Expecting numeric in D26196 / R26196C4: got 'n.a.'
## Warning: Expecting numeric in D26197 / R26197C4: got 'n.a.'
## Warning: Expecting numeric in D26198 / R26198C4: got 'n.a.'
## Warning: Expecting numeric in D26199 / R26199C4: got 'n.a.'
## Warning: Expecting numeric in D26200 / R26200C4: got 'n.a.'
## Warning: Expecting numeric in D26201 / R26201C4: got 'n.a.'
## Warning: Expecting numeric in D26202 / R26202C4: got 'n.a.'
## Warning: Expecting numeric in D26203 / R26203C4: got 'n.a.'
## Warning: Expecting numeric in D26204 / R26204C4: got 'n.a.'
## Warning: Expecting numeric in D26205 / R26205C4: got 'n.a.'
## Warning: Expecting numeric in D26206 / R26206C4: got 'n.a.'
## Warning: Expecting numeric in D26207 / R26207C4: got 'n.a.'
## Warning: Expecting numeric in D26208 / R26208C4: got 'n.a.'
## Warning: Expecting numeric in D26209 / R26209C4: got 'n.a.'
## Warning: Expecting numeric in D26210 / R26210C4: got 'n.a.'
## Warning: Expecting numeric in D26211 / R26211C4: got 'n.a.'
## Warning: Expecting numeric in D26212 / R26212C4: got 'n.a.'
## Warning: Expecting numeric in D26213 / R26213C4: got 'n.a.'
## Warning: Expecting numeric in D26214 / R26214C4: got 'n.a.'
## Warning: Expecting numeric in D26215 / R26215C4: got 'n.a.'
## Warning: Expecting numeric in D26216 / R26216C4: got 'n.a.'
## Warning: Expecting numeric in D26217 / R26217C4: got 'n.a.'
## Warning: Expecting numeric in D26218 / R26218C4: got 'n.a.'
## Warning: Expecting numeric in D26219 / R26219C4: got 'n.a.'
## Warning: Expecting numeric in D26220 / R26220C4: got 'n.a.'
## Warning: Expecting numeric in D26221 / R26221C4: got 'n.a.'
## Warning: Expecting numeric in D26222 / R26222C4: got 'n.a.'
## Warning: Expecting numeric in D26223 / R26223C4: got 'n.a.'
## Warning: Expecting numeric in D26224 / R26224C4: got 'n.a.'
## Warning: Expecting numeric in D26225 / R26225C4: got 'n.a.'
## Warning: Expecting numeric in D26226 / R26226C4: got 'n.a.'
## Warning: Expecting numeric in D26227 / R26227C4: got 'n.a.'
## Warning: Expecting numeric in D26228 / R26228C4: got 'n.a.'
## Warning: Expecting numeric in D26229 / R26229C4: got 'n.a.'
## Warning: Expecting numeric in D26230 / R26230C4: got 'n.a.'
## Warning: Expecting numeric in D26231 / R26231C4: got 'n.a.'
## Warning: Expecting numeric in D26232 / R26232C4: got 'n.a.'
## Warning: Expecting numeric in D26233 / R26233C4: got 'n.a.'
## Warning: Expecting numeric in D26234 / R26234C4: got 'n.a.'
## Warning: Expecting numeric in D26235 / R26235C4: got 'n.a.'
## Warning: Expecting numeric in D26236 / R26236C4: got 'n.a.'
## Warning: Expecting numeric in D26237 / R26237C4: got 'n.a.'
## Warning: Expecting numeric in D26238 / R26238C4: got 'n.a.'
## Warning: Expecting numeric in D26239 / R26239C4: got 'n.a.'
## Warning: Expecting numeric in D26240 / R26240C4: got 'n.a.'
## Warning: Expecting numeric in D26241 / R26241C4: got 'n.a.'
## Warning: Expecting numeric in D26242 / R26242C4: got 'n.a.'
## Warning: Expecting numeric in D26243 / R26243C4: got 'n.a.'
## Warning: Expecting numeric in D26244 / R26244C4: got 'n.a.'
## Warning: Expecting numeric in D26245 / R26245C4: got 'n.a.'
## Warning: Expecting numeric in D26246 / R26246C4: got 'n.a.'
## Warning: Expecting numeric in D26247 / R26247C4: got 'n.a.'
## Warning: Expecting numeric in D26248 / R26248C4: got 'n.a.'
## Warning: Expecting numeric in D26249 / R26249C4: got 'n.a.'
## Warning: Expecting numeric in D26250 / R26250C4: got 'n.a.'
## Warning: Expecting numeric in D26251 / R26251C4: got 'n.a.'
## Warning: Expecting numeric in D26252 / R26252C4: got 'n.a.'
## Warning: Expecting numeric in D26253 / R26253C4: got 'n.a.'
## Warning: Expecting numeric in D26254 / R26254C4: got 'n.a.'
## Warning: Expecting numeric in D26255 / R26255C4: got 'n.a.'
## Warning: Expecting numeric in D26256 / R26256C4: got 'n.a.'
## Warning: Expecting numeric in D26257 / R26257C4: got 'n.a.'
## Warning: Expecting numeric in D26258 / R26258C4: got 'n.a.'
## Warning: Expecting numeric in D26259 / R26259C4: got 'n.a.'
## Warning: Expecting numeric in D26260 / R26260C4: got 'n.a.'
## Warning: Expecting numeric in D26261 / R26261C4: got 'n.a.'
## Warning: Expecting numeric in D26262 / R26262C4: got 'n.a.'
## Warning: Expecting numeric in D26263 / R26263C4: got 'n.a.'
## Warning: Expecting numeric in D26264 / R26264C4: got 'n.a.'
## Warning: Expecting numeric in D26265 / R26265C4: got 'n.a.'
## Warning: Expecting numeric in D26266 / R26266C4: got 'n.a.'
## Warning: Expecting numeric in D26267 / R26267C4: got 'n.a.'
## Warning: Expecting numeric in D26268 / R26268C4: got 'n.a.'
## Warning: Expecting numeric in D26269 / R26269C4: got 'n.a.'
## Warning: Expecting numeric in D26270 / R26270C4: got 'n.a.'
## Warning: Expecting numeric in D26271 / R26271C4: got 'n.a.'
## Warning: Expecting numeric in D26272 / R26272C4: got 'n.a.'
## Warning: Expecting numeric in D26273 / R26273C4: got 'n.a.'
## Warning: Expecting numeric in D26274 / R26274C4: got 'n.a.'
## Warning: Expecting numeric in D26275 / R26275C4: got 'n.a.'
## Warning: Expecting numeric in D26276 / R26276C4: got 'n.a.'
## Warning: Expecting numeric in D26277 / R26277C4: got 'n.a.'
## Warning: Expecting numeric in D26278 / R26278C4: got 'n.a.'
## Warning: Expecting numeric in D26279 / R26279C4: got 'n.a.'
## Warning: Expecting numeric in D26280 / R26280C4: got 'n.a.'
## Warning: Expecting numeric in D26281 / R26281C4: got 'n.a.'
## Warning: Expecting numeric in D26282 / R26282C4: got 'n.a.'
## Warning: Expecting numeric in D26283 / R26283C4: got 'n.a.'
## Warning: Expecting numeric in D26284 / R26284C4: got 'n.a.'
## Warning: Expecting numeric in D26285 / R26285C4: got 'n.a.'
## Warning: Expecting numeric in D26286 / R26286C4: got 'n.a.'
## Warning: Expecting numeric in D26287 / R26287C4: got 'n.a.'
## Warning: Expecting numeric in D26288 / R26288C4: got 'n.a.'
## Warning: Expecting numeric in D26289 / R26289C4: got 'n.a.'
## Warning: Expecting numeric in D26290 / R26290C4: got 'n.a.'
## Warning: Expecting numeric in D26291 / R26291C4: got 'n.a.'
## Warning: Expecting numeric in D26292 / R26292C4: got 'n.a.'
## Warning: Expecting numeric in D26293 / R26293C4: got 'n.a.'
## Warning: Expecting numeric in D26294 / R26294C4: got 'n.a.'
## Warning: Expecting numeric in D26295 / R26295C4: got 'n.a.'
## Warning: Expecting numeric in D26296 / R26296C4: got 'n.a.'
## Warning: Expecting numeric in D26297 / R26297C4: got 'n.a.'
## Warning: Expecting numeric in D26298 / R26298C4: got 'n.a.'
## Warning: Expecting numeric in D26299 / R26299C4: got 'n.a.'
## Warning: Expecting numeric in D26300 / R26300C4: got 'n.a.'
## Warning: Expecting numeric in D26301 / R26301C4: got 'n.a.'
## Warning: Expecting numeric in D26302 / R26302C4: got 'n.a.'
## Warning: Expecting numeric in D26303 / R26303C4: got 'n.a.'
## Warning: Expecting numeric in D26304 / R26304C4: got 'n.a.'
## Warning: Expecting numeric in D26305 / R26305C4: got 'n.a.'
## Warning: Expecting numeric in D26306 / R26306C4: got 'n.a.'
## Warning: Expecting numeric in D26307 / R26307C4: got 'n.a.'
## Warning: Expecting numeric in D26308 / R26308C4: got 'n.a.'
## Warning: Expecting numeric in D26309 / R26309C4: got 'n.a.'
## Warning: Expecting numeric in D26310 / R26310C4: got 'n.a.'
## Warning: Expecting numeric in D26311 / R26311C4: got 'n.a.'
## Warning: Expecting numeric in D26312 / R26312C4: got 'n.a.'
## Warning: Expecting numeric in D26313 / R26313C4: got 'n.a.'
## Warning: Expecting numeric in D26314 / R26314C4: got 'n.a.'
## Warning: Expecting numeric in D26315 / R26315C4: got 'n.a.'
## Warning: Expecting numeric in D26316 / R26316C4: got 'n.a.'
## Warning: Expecting numeric in D26317 / R26317C4: got 'n.a.'
## Warning: Expecting numeric in D26318 / R26318C4: got 'n.a.'
## Warning: Expecting numeric in D26319 / R26319C4: got 'n.a.'
## Warning: Expecting numeric in D26320 / R26320C4: got 'n.a.'
## Warning: Expecting numeric in D26321 / R26321C4: got 'n.a.'
## Warning: Expecting numeric in D26322 / R26322C4: got 'n.a.'
## Warning: Expecting numeric in D26323 / R26323C4: got 'n.a.'
## Warning: Expecting numeric in D26324 / R26324C4: got 'n.a.'
## Warning: Expecting numeric in D26325 / R26325C4: got 'n.a.'
## Warning: Expecting numeric in D26326 / R26326C4: got 'n.a.'
## Warning: Expecting numeric in D26327 / R26327C4: got 'n.a.'
## Warning: Expecting numeric in D26328 / R26328C4: got 'n.a.'
## Warning: Expecting numeric in D26329 / R26329C4: got 'n.a.'
## Warning: Expecting numeric in D26330 / R26330C4: got 'n.a.'
## Warning: Expecting numeric in D26331 / R26331C4: got 'n.a.'
## Warning: Expecting numeric in D26332 / R26332C4: got 'n.a.'
## Warning: Expecting numeric in D26333 / R26333C4: got 'n.a.'
## Warning: Expecting numeric in D26334 / R26334C4: got 'n.a.'
## Warning: Expecting numeric in D26335 / R26335C4: got 'n.a.'
## Warning: Expecting numeric in D26336 / R26336C4: got 'n.a.'
## Warning: Expecting numeric in D26337 / R26337C4: got 'n.a.'
## Warning: Expecting numeric in D26338 / R26338C4: got 'n.a.'
## Warning: Expecting numeric in D26339 / R26339C4: got 'n.a.'
## Warning: Expecting numeric in D26340 / R26340C4: got 'n.a.'
## Warning: Expecting numeric in D26341 / R26341C4: got 'n.a.'
## Warning: Expecting numeric in D26342 / R26342C4: got 'n.a.'
## Warning: Expecting numeric in D26343 / R26343C4: got 'n.a.'
## Warning: Expecting numeric in D26344 / R26344C4: got 'n.a.'
## Warning: Expecting numeric in D26345 / R26345C4: got 'n.a.'
## Warning: Expecting numeric in D26346 / R26346C4: got 'n.a.'
## Warning: Expecting numeric in D26347 / R26347C4: got 'n.a.'
## Warning: Expecting numeric in D26348 / R26348C4: got 'n.a.'
## Warning: Expecting numeric in D26349 / R26349C4: got 'n.a.'
## Warning: Expecting numeric in D26350 / R26350C4: got 'n.a.'
## Warning: Expecting numeric in D26351 / R26351C4: got 'n.a.'
## Warning: Expecting numeric in D26352 / R26352C4: got 'n.a.'
## Warning: Expecting numeric in D26353 / R26353C4: got 'n.a.'
## Warning: Expecting numeric in D26354 / R26354C4: got 'n.a.'
## Warning: Expecting numeric in D26355 / R26355C4: got 'n.a.'
## Warning: Expecting numeric in D26356 / R26356C4: got 'n.a.'
## Warning: Expecting numeric in D26357 / R26357C4: got 'n.a.'
## Warning: Expecting numeric in D26358 / R26358C4: got 'n.a.'
## Warning: Expecting numeric in D26359 / R26359C4: got 'n.a.'
## Warning: Expecting numeric in D26360 / R26360C4: got 'n.a.'
## Warning: Expecting numeric in D26361 / R26361C4: got 'n.a.'
## Warning: Expecting numeric in D26362 / R26362C4: got 'n.a.'
## Warning: Expecting numeric in D26363 / R26363C4: got 'n.a.'
## Warning: Expecting numeric in D26364 / R26364C4: got 'n.a.'
## Warning: Expecting numeric in D26365 / R26365C4: got 'n.a.'
## Warning: Expecting numeric in D26366 / R26366C4: got 'n.a.'
## Warning: Expecting numeric in D26367 / R26367C4: got 'n.a.'
## Warning: Expecting numeric in D26368 / R26368C4: got 'n.a.'
## Warning: Expecting numeric in D26369 / R26369C4: got 'n.a.'
## Warning: Expecting numeric in D26370 / R26370C4: got 'n.a.'
## Warning: Expecting numeric in D26371 / R26371C4: got 'n.a.'
## Warning: Expecting numeric in D26372 / R26372C4: got 'n.a.'
## Warning: Expecting numeric in D26373 / R26373C4: got 'n.a.'
## Warning: Expecting numeric in D26374 / R26374C4: got 'n.a.'
## Warning: Expecting numeric in D26375 / R26375C4: got 'n.a.'
## Warning: Expecting numeric in D26376 / R26376C4: got 'n.a.'
## Warning: Expecting numeric in D26377 / R26377C4: got 'n.a.'
## Warning: Expecting numeric in D26378 / R26378C4: got 'n.a.'
## Warning: Expecting numeric in D26379 / R26379C4: got 'n.a.'
## Warning: Expecting numeric in D26380 / R26380C4: got 'n.a.'
## Warning: Expecting numeric in D26381 / R26381C4: got 'n.a.'
## Warning: Expecting numeric in D26382 / R26382C4: got 'n.a.'
## Warning: Expecting numeric in D26383 / R26383C4: got 'n.a.'
## Warning: Expecting numeric in D26384 / R26384C4: got 'n.a.'
## Warning: Expecting numeric in D26385 / R26385C4: got 'n.a.'
## Warning: Expecting numeric in D26386 / R26386C4: got 'n.a.'
## Warning: Expecting numeric in D26387 / R26387C4: got 'n.a.'
## Warning: Expecting numeric in D26388 / R26388C4: got 'n.a.'
## Warning: Expecting numeric in D26389 / R26389C4: got 'n.a.'
## Warning: Expecting numeric in D26390 / R26390C4: got 'n.a.'
## Warning: Expecting numeric in D26391 / R26391C4: got 'n.a.'
## Warning: Expecting numeric in D26392 / R26392C4: got 'n.a.'
## Warning: Expecting numeric in D26393 / R26393C4: got 'n.a.'
## Warning: Expecting numeric in D26394 / R26394C4: got 'n.a.'
## Warning: Expecting numeric in D26395 / R26395C4: got 'n.a.'
## Warning: Expecting numeric in D26396 / R26396C4: got 'n.a.'
## Warning: Expecting numeric in D26397 / R26397C4: got 'n.a.'
## Warning: Expecting numeric in D26398 / R26398C4: got 'n.a.'
## Warning: Expecting numeric in D26399 / R26399C4: got 'n.a.'
## Warning: Expecting numeric in D26400 / R26400C4: got 'n.a.'
## Warning: Expecting numeric in D26401 / R26401C4: got 'n.a.'
## Warning: Expecting numeric in D26402 / R26402C4: got 'n.a.'
## Warning: Expecting numeric in D26403 / R26403C4: got 'n.a.'
## Warning: Expecting numeric in D26404 / R26404C4: got 'n.a.'
## Warning: Expecting numeric in D26405 / R26405C4: got 'n.a.'
## Warning: Expecting numeric in D26406 / R26406C4: got 'n.a.'
## Warning: Expecting numeric in D26407 / R26407C4: got 'n.a.'
## Warning: Expecting numeric in D26408 / R26408C4: got 'n.a.'
## Warning: Expecting numeric in D26409 / R26409C4: got 'n.a.'
## Warning: Expecting numeric in D26410 / R26410C4: got 'n.a.'
## Warning: Expecting numeric in D26411 / R26411C4: got 'n.a.'
## Warning: Expecting numeric in D26412 / R26412C4: got 'n.a.'
## Warning: Expecting numeric in D26413 / R26413C4: got 'n.a.'
## Warning: Expecting numeric in D26414 / R26414C4: got 'n.a.'
## Warning: Expecting numeric in D26415 / R26415C4: got 'n.a.'
## Warning: Expecting numeric in D26416 / R26416C4: got 'n.a.'
## Warning: Expecting numeric in D26417 / R26417C4: got 'n.a.'
## Warning: Expecting numeric in D26418 / R26418C4: got 'n.a.'
## Warning: Expecting numeric in D26419 / R26419C4: got 'n.a.'
## Warning: Expecting numeric in D26420 / R26420C4: got 'n.a.'
## Warning: Expecting numeric in D26421 / R26421C4: got 'n.a.'
## Warning: Expecting numeric in D26422 / R26422C4: got 'n.a.'
## Warning: Expecting numeric in D26423 / R26423C4: got 'n.a.'
## Warning: Expecting numeric in D26424 / R26424C4: got 'n.a.'
## Warning: Expecting numeric in D26425 / R26425C4: got 'n.a.'
## Warning: Expecting numeric in D26426 / R26426C4: got 'n.a.'
## Warning: Expecting numeric in D26427 / R26427C4: got 'n.a.'
## Warning: Expecting numeric in D26428 / R26428C4: got 'n.a.'
## Warning: Expecting numeric in D26429 / R26429C4: got 'n.a.'
## Warning: Expecting numeric in D26430 / R26430C4: got 'n.a.'
## Warning: Expecting numeric in D26431 / R26431C4: got 'n.a.'
## Warning: Expecting numeric in D26432 / R26432C4: got 'n.a.'
## Warning: Expecting numeric in D26433 / R26433C4: got 'n.a.'
## Warning: Expecting numeric in D26434 / R26434C4: got 'n.a.'
## Warning: Expecting numeric in D26435 / R26435C4: got 'n.a.'
## Warning: Expecting numeric in D26436 / R26436C4: got 'n.a.'
## Warning: Expecting numeric in D26437 / R26437C4: got 'n.a.'
## Warning: Expecting numeric in D26438 / R26438C4: got 'n.a.'
## Warning: Expecting numeric in D26439 / R26439C4: got 'n.a.'
## Warning: Expecting numeric in D26440 / R26440C4: got 'n.a.'
## Warning: Expecting numeric in D26441 / R26441C4: got 'n.a.'
## Warning: Expecting numeric in D26442 / R26442C4: got 'n.a.'
## Warning: Expecting numeric in D26443 / R26443C4: got 'n.a.'
## Warning: Expecting numeric in D26444 / R26444C4: got 'n.a.'
## Warning: Expecting numeric in D26445 / R26445C4: got 'n.a.'
## Warning: Expecting numeric in D26446 / R26446C4: got 'n.a.'
## Warning: Expecting numeric in D26447 / R26447C4: got 'n.a.'
## Warning: Expecting numeric in D26448 / R26448C4: got 'n.a.'
## Warning: Expecting numeric in D26449 / R26449C4: got 'n.a.'
## Warning: Expecting numeric in D26450 / R26450C4: got 'n.a.'
## Warning: Expecting numeric in D26451 / R26451C4: got 'n.a.'
## Warning: Expecting numeric in D26452 / R26452C4: got 'n.a.'
## Warning: Expecting numeric in D26453 / R26453C4: got 'n.a.'
## Warning: Expecting numeric in D26454 / R26454C4: got 'n.a.'
## Warning: Expecting numeric in D26455 / R26455C4: got 'n.a.'
## Warning: Expecting numeric in D26456 / R26456C4: got 'n.a.'
## Warning: Expecting numeric in D26457 / R26457C4: got 'n.a.'
## Warning: Expecting numeric in D26458 / R26458C4: got 'n.a.'
## Warning: Expecting numeric in D26459 / R26459C4: got 'n.a.'
## Warning: Expecting numeric in D26460 / R26460C4: got 'n.a.'
## Warning: Expecting numeric in D26461 / R26461C4: got 'n.a.'
## Warning: Expecting numeric in D26462 / R26462C4: got 'n.a.'
## Warning: Expecting numeric in D26463 / R26463C4: got 'n.a.'
## Warning: Expecting numeric in D26464 / R26464C4: got 'n.a.'
## Warning: Expecting numeric in D26465 / R26465C4: got 'n.a.'
## Warning: Expecting numeric in D26466 / R26466C4: got 'n.a.'
## Warning: Expecting numeric in D26467 / R26467C4: got 'n.a.'
## Warning: Expecting numeric in D26468 / R26468C4: got 'n.a.'
## Warning: Expecting numeric in D26469 / R26469C4: got 'n.a.'
## Warning: Expecting numeric in D26470 / R26470C4: got 'n.a.'
## Warning: Expecting numeric in D26471 / R26471C4: got 'n.a.'
## Warning: Expecting numeric in D26472 / R26472C4: got 'n.a.'
## Warning: Expecting numeric in D26473 / R26473C4: got 'n.a.'
## Warning: Expecting numeric in D26474 / R26474C4: got 'n.a.'
## Warning: Expecting numeric in D26475 / R26475C4: got 'n.a.'
## Warning: Expecting numeric in D26476 / R26476C4: got 'n.a.'
## Warning: Expecting numeric in D26477 / R26477C4: got 'n.a.'
## Warning: Expecting numeric in D26478 / R26478C4: got 'n.a.'
## Warning: Expecting numeric in D26479 / R26479C4: got 'n.a.'
## Warning: Expecting numeric in D26480 / R26480C4: got 'n.a.'
## Warning: Expecting numeric in D26481 / R26481C4: got 'n.a.'
## Warning: Expecting numeric in D26482 / R26482C4: got 'n.a.'
## Warning: Expecting numeric in D26483 / R26483C4: got 'n.a.'
## Warning: Expecting numeric in D26484 / R26484C4: got 'n.a.'
## Warning: Expecting numeric in D26485 / R26485C4: got 'n.a.'
## Warning: Expecting numeric in D26486 / R26486C4: got 'n.a.'
## Warning: Expecting numeric in D26487 / R26487C4: got 'n.a.'
## Warning: Expecting numeric in D26488 / R26488C4: got 'n.a.'
## Warning: Expecting numeric in D26489 / R26489C4: got 'n.a.'
## Warning: Expecting numeric in D26490 / R26490C4: got 'n.a.'
## Warning: Expecting numeric in D26491 / R26491C4: got 'n.a.'
## Warning: Expecting numeric in D26492 / R26492C4: got 'n.a.'
## Warning: Expecting numeric in D26493 / R26493C4: got 'n.a.'
## Warning: Expecting numeric in D26494 / R26494C4: got 'n.a.'
## Warning: Expecting numeric in D26495 / R26495C4: got 'n.a.'
## Warning: Expecting numeric in D26496 / R26496C4: got 'n.a.'
## Warning: Expecting numeric in D26497 / R26497C4: got 'n.a.'
## Warning: Expecting numeric in D26498 / R26498C4: got 'n.a.'
## Warning: Expecting numeric in D26499 / R26499C4: got 'n.a.'
## Warning: Expecting numeric in D26500 / R26500C4: got 'n.a.'
## Warning: Expecting numeric in D26501 / R26501C4: got 'n.a.'
## Warning: Expecting numeric in D26502 / R26502C4: got 'n.a.'
## Warning: Expecting numeric in D26503 / R26503C4: got 'n.a.'
## Warning: Expecting numeric in D26504 / R26504C4: got 'n.a.'
## Warning: Expecting numeric in D26505 / R26505C4: got 'n.a.'
## Warning: Expecting numeric in D26506 / R26506C4: got 'n.a.'
## Warning: Expecting numeric in D26507 / R26507C4: got 'n.a.'
## Warning: Expecting numeric in D26508 / R26508C4: got 'n.a.'
## Warning: Expecting numeric in D26509 / R26509C4: got 'n.a.'
## Warning: Expecting numeric in D26510 / R26510C4: got 'n.a.'
## Warning: Expecting numeric in D26511 / R26511C4: got 'n.a.'
## Warning: Expecting numeric in D26512 / R26512C4: got 'n.a.'
## Warning: Expecting numeric in D26513 / R26513C4: got 'n.a.'
## Warning: Expecting numeric in D26514 / R26514C4: got 'n.a.'
## Warning: Expecting numeric in D26515 / R26515C4: got 'n.a.'
## Warning: Expecting numeric in D26516 / R26516C4: got 'n.a.'
## Warning: Expecting numeric in D26517 / R26517C4: got 'n.a.'
## Warning: Expecting numeric in D26518 / R26518C4: got 'n.a.'
## Warning: Expecting numeric in D26519 / R26519C4: got 'n.a.'
## Warning: Expecting numeric in D26520 / R26520C4: got 'n.a.'
## Warning: Expecting numeric in D26521 / R26521C4: got 'n.a.'
## Warning: Expecting numeric in D26522 / R26522C4: got 'n.a.'
## Warning: Expecting numeric in D26523 / R26523C4: got 'n.a.'
## Warning: Expecting numeric in D26524 / R26524C4: got 'n.a.'
## Warning: Expecting numeric in D26525 / R26525C4: got 'n.a.'
## Warning: Expecting numeric in D26526 / R26526C4: got 'n.a.'
## Warning: Expecting numeric in D26527 / R26527C4: got 'n.a.'
## Warning: Expecting numeric in D26528 / R26528C4: got 'n.a.'
## Warning: Expecting numeric in D26529 / R26529C4: got 'n.a.'
## Warning: Expecting numeric in D26530 / R26530C4: got 'n.a.'
## Warning: Expecting numeric in D26531 / R26531C4: got 'n.a.'
## Warning: Expecting numeric in D26532 / R26532C4: got 'n.a.'
## Warning: Expecting numeric in D26533 / R26533C4: got 'n.a.'
## Warning: Expecting numeric in D26534 / R26534C4: got 'n.a.'
## Warning: Expecting numeric in D26535 / R26535C4: got 'n.a.'
## Warning: Expecting numeric in D26536 / R26536C4: got 'n.a.'
## Warning: Expecting numeric in D26537 / R26537C4: got 'n.a.'
## Warning: Expecting numeric in D26538 / R26538C4: got 'n.a.'
## Warning: Expecting numeric in D26539 / R26539C4: got 'n.a.'
## Warning: Expecting numeric in D26540 / R26540C4: got 'n.a.'
## Warning: Expecting numeric in D26541 / R26541C4: got 'n.a.'
## Warning: Expecting numeric in D26542 / R26542C4: got 'n.a.'
## Warning: Expecting numeric in D26543 / R26543C4: got 'n.a.'
## Warning: Expecting numeric in D26544 / R26544C4: got 'n.a.'
## Warning: Expecting numeric in D26545 / R26545C4: got 'n.a.'
## Warning: Expecting numeric in D26546 / R26546C4: got 'n.a.'
## Warning: Expecting numeric in D26547 / R26547C4: got 'n.a.'
## Warning: Expecting numeric in D26548 / R26548C4: got 'n.a.'
## Warning: Expecting numeric in D26549 / R26549C4: got 'n.a.'
## Warning: Expecting numeric in D26550 / R26550C4: got 'n.a.'
## Warning: Expecting numeric in D26551 / R26551C4: got 'n.a.'
## Warning: Expecting numeric in D26552 / R26552C4: got 'n.a.'
## Warning: Expecting numeric in D26553 / R26553C4: got 'n.a.'
## Warning: Expecting numeric in D26554 / R26554C4: got 'n.a.'
## Warning: Expecting numeric in D26555 / R26555C4: got 'n.a.'
## Warning: Expecting numeric in D26556 / R26556C4: got 'n.a.'
## Warning: Expecting numeric in D26557 / R26557C4: got 'n.a.'
## Warning: Expecting numeric in D26558 / R26558C4: got 'n.a.'
## Warning: Expecting numeric in D26559 / R26559C4: got 'n.a.'
## Warning: Expecting numeric in D26560 / R26560C4: got 'n.a.'
## Warning: Expecting numeric in D26561 / R26561C4: got 'n.a.'
## Warning: Expecting numeric in D26562 / R26562C4: got 'n.a.'
## Warning: Expecting numeric in D26563 / R26563C4: got 'n.a.'
## Warning: Expecting numeric in D26564 / R26564C4: got 'n.a.'
## Warning: Expecting numeric in D26565 / R26565C4: got 'n.a.'
## Warning: Expecting numeric in D26566 / R26566C4: got 'n.a.'
## Warning: Expecting numeric in D26567 / R26567C4: got 'n.a.'
## Warning: Expecting numeric in D26568 / R26568C4: got 'n.a.'
## Warning: Expecting numeric in D26569 / R26569C4: got 'n.a.'
## Warning: Expecting numeric in D26570 / R26570C4: got 'n.a.'
## Warning: Expecting numeric in D26571 / R26571C4: got 'n.a.'
## Warning: Expecting numeric in D26572 / R26572C4: got 'n.a.'
## Warning: Expecting numeric in D26573 / R26573C4: got 'n.a.'
## Warning: Expecting numeric in D26574 / R26574C4: got 'n.a.'
## Warning: Expecting numeric in D26575 / R26575C4: got 'n.a.'
## Warning: Expecting numeric in D26576 / R26576C4: got 'n.a.'
## Warning: Expecting numeric in D26577 / R26577C4: got 'n.a.'
## Warning: Expecting numeric in D26578 / R26578C4: got 'n.a.'
## Warning: Expecting numeric in D26579 / R26579C4: got 'n.a.'
## Warning: Expecting numeric in D26580 / R26580C4: got 'n.a.'
## Warning: Expecting numeric in D26581 / R26581C4: got 'n.a.'
## Warning: Expecting numeric in D26582 / R26582C4: got 'n.a.'
## Warning: Expecting numeric in D26583 / R26583C4: got 'n.a.'
## Warning: Expecting numeric in D26584 / R26584C4: got 'n.a.'
## Warning: Expecting numeric in D26585 / R26585C4: got 'n.a.'
## Warning: Expecting numeric in D26586 / R26586C4: got 'n.a.'
## Warning: Expecting numeric in D26587 / R26587C4: got 'n.a.'
## Warning: Expecting numeric in D26588 / R26588C4: got 'n.a.'
## Warning: Expecting numeric in D26589 / R26589C4: got 'n.a.'
## Warning: Expecting numeric in D26590 / R26590C4: got 'n.a.'
## Warning: Expecting numeric in D26591 / R26591C4: got 'n.a.'
## Warning: Expecting numeric in D26592 / R26592C4: got 'n.a.'
## Warning: Expecting numeric in D26593 / R26593C4: got 'n.a.'
## Warning: Expecting numeric in D26594 / R26594C4: got 'n.a.'
## Warning: Expecting numeric in D26595 / R26595C4: got 'n.a.'
## Warning: Expecting numeric in D26596 / R26596C4: got 'n.a.'
## Warning: Expecting numeric in D26597 / R26597C4: got 'n.a.'
## Warning: Expecting numeric in D26598 / R26598C4: got 'n.a.'
## Warning: Expecting numeric in D26599 / R26599C4: got 'n.a.'
## Warning: Expecting numeric in D26600 / R26600C4: got 'n.a.'
## Warning: Expecting numeric in D26601 / R26601C4: got 'n.a.'
## Warning: Expecting numeric in D26602 / R26602C4: got 'n.a.'
## Warning: Expecting numeric in D26603 / R26603C4: got 'n.a.'
## Warning: Expecting numeric in D26604 / R26604C4: got 'n.a.'
## Warning: Expecting numeric in D26605 / R26605C4: got 'n.a.'
## Warning: Expecting numeric in D26606 / R26606C4: got 'n.a.'
## Warning: Expecting numeric in D26607 / R26607C4: got 'n.a.'
## Warning: Expecting numeric in D26608 / R26608C4: got 'n.a.'
## Warning: Expecting numeric in D26609 / R26609C4: got 'n.a.'
## Warning: Expecting numeric in D26610 / R26610C4: got 'n.a.'
## Warning: Expecting numeric in D26611 / R26611C4: got 'n.a.'
## Warning: Expecting numeric in D26612 / R26612C4: got 'n.a.'
## Warning: Expecting numeric in D26613 / R26613C4: got 'n.a.'
## Warning: Expecting numeric in D26614 / R26614C4: got 'n.a.'
## Warning: Expecting numeric in D26615 / R26615C4: got 'n.a.'
## Warning: Expecting numeric in D26616 / R26616C4: got 'n.a.'
## Warning: Expecting numeric in D26617 / R26617C4: got 'n.a.'
## Warning: Expecting numeric in D26618 / R26618C4: got 'n.a.'
## Warning: Expecting numeric in D26619 / R26619C4: got 'n.a.'
## Warning: Expecting numeric in D26620 / R26620C4: got 'n.a.'
## Warning: Expecting numeric in D26621 / R26621C4: got 'n.a.'
## Warning: Expecting numeric in D26622 / R26622C4: got 'n.a.'
## Warning: Expecting numeric in D26623 / R26623C4: got 'n.a.'
## Warning: Expecting numeric in D26624 / R26624C4: got 'n.a.'
## Warning: Expecting numeric in D26625 / R26625C4: got 'n.a.'
## Warning: Expecting numeric in D26626 / R26626C4: got 'n.a.'
## Warning: Expecting numeric in D26627 / R26627C4: got 'n.a.'
## Warning: Expecting numeric in D26628 / R26628C4: got 'n.a.'
## Warning: Expecting numeric in D26629 / R26629C4: got 'n.a.'
## Warning: Expecting numeric in D26630 / R26630C4: got 'n.a.'
## Warning: Expecting numeric in D26631 / R26631C4: got 'n.a.'
## Warning: Expecting numeric in D26632 / R26632C4: got 'n.a.'
## Warning: Expecting numeric in D26633 / R26633C4: got 'n.a.'
## Warning: Expecting numeric in D26634 / R26634C4: got 'n.a.'
## Warning: Expecting numeric in D26635 / R26635C4: got 'n.a.'
## Warning: Expecting numeric in D26636 / R26636C4: got 'n.a.'
## Warning: Expecting numeric in D26637 / R26637C4: got 'n.a.'
## Warning: Expecting numeric in D26638 / R26638C4: got 'n.a.'
## Warning: Expecting numeric in D26639 / R26639C4: got 'n.a.'
## Warning: Expecting numeric in D26640 / R26640C4: got 'n.a.'
## Warning: Expecting numeric in D26641 / R26641C4: got 'n.a.'
## Warning: Expecting numeric in D26642 / R26642C4: got 'n.a.'
## Warning: Expecting numeric in D26643 / R26643C4: got 'n.a.'
## Warning: Expecting numeric in D26644 / R26644C4: got 'n.a.'
## Warning: Expecting numeric in D26645 / R26645C4: got 'n.a.'
## Warning: Expecting numeric in D26646 / R26646C4: got 'n.a.'
## Warning: Expecting numeric in D26647 / R26647C4: got 'n.a.'
## Warning: Expecting numeric in D26648 / R26648C4: got 'n.a.'
## Warning: Expecting numeric in D26649 / R26649C4: got 'n.a.'
## Warning: Expecting numeric in D26650 / R26650C4: got 'n.a.'
## Warning: Expecting numeric in D26651 / R26651C4: got 'n.a.'
## Warning: Expecting numeric in D26652 / R26652C4: got 'n.a.'
## Warning: Expecting numeric in D26653 / R26653C4: got 'n.a.'
## Warning: Expecting numeric in D26654 / R26654C4: got 'n.a.'
## Warning: Expecting numeric in D26655 / R26655C4: got 'n.a.'
## Warning: Expecting numeric in D26656 / R26656C4: got 'n.a.'
## Warning: Expecting numeric in D26657 / R26657C4: got 'n.a.'
## Warning: Expecting numeric in D26658 / R26658C4: got 'n.a.'
## Warning: Expecting numeric in D26659 / R26659C4: got 'n.a.'
## Warning: Expecting numeric in D26660 / R26660C4: got 'n.a.'
## Warning: Expecting numeric in D26661 / R26661C4: got 'n.a.'
## Warning: Expecting numeric in D26662 / R26662C4: got 'n.a.'
## Warning: Expecting numeric in D26663 / R26663C4: got 'n.a.'
## Warning: Expecting numeric in D26664 / R26664C4: got 'n.a.'
## Warning: Expecting numeric in D26665 / R26665C4: got 'n.a.'
## Warning: Expecting numeric in D26666 / R26666C4: got 'n.a.'
## Warning: Expecting numeric in D26667 / R26667C4: got 'n.a.'
## Warning: Expecting numeric in D26668 / R26668C4: got 'n.a.'
## Warning: Expecting numeric in D26669 / R26669C4: got 'n.a.'
## Warning: Expecting numeric in D26670 / R26670C4: got 'n.a.'
## Warning: Expecting numeric in D26671 / R26671C4: got 'n.a.'
## Warning: Expecting numeric in D26672 / R26672C4: got 'n.a.'
## Warning: Expecting numeric in D26673 / R26673C4: got 'n.a.'
## Warning: Expecting numeric in D26674 / R26674C4: got 'n.a.'
## Warning: Expecting numeric in D26675 / R26675C4: got 'n.a.'
## Warning: Expecting numeric in D26676 / R26676C4: got 'n.a.'
## Warning: Expecting numeric in D26677 / R26677C4: got 'n.a.'
## Warning: Expecting numeric in D26678 / R26678C4: got 'n.a.'
## Warning: Expecting numeric in D26679 / R26679C4: got 'n.a.'
## Warning: Expecting numeric in D26680 / R26680C4: got 'n.a.'
## Warning: Expecting numeric in D26681 / R26681C4: got 'n.a.'
## Warning: Expecting numeric in D26682 / R26682C4: got 'n.a.'
## Warning: Expecting numeric in D26683 / R26683C4: got 'n.a.'
## Warning: Expecting numeric in D26684 / R26684C4: got 'n.a.'
## Warning: Expecting numeric in D26685 / R26685C4: got 'n.a.'
## Warning: Expecting numeric in D26686 / R26686C4: got 'n.a.'
## Warning: Expecting numeric in D26687 / R26687C4: got 'n.a.'
## Warning: Expecting numeric in D26688 / R26688C4: got 'n.a.'
## Warning: Expecting numeric in D26689 / R26689C4: got 'n.a.'
## Warning: Expecting numeric in D26690 / R26690C4: got 'n.a.'
## Warning: Expecting numeric in D26691 / R26691C4: got 'n.a.'
## Warning: Expecting numeric in D26692 / R26692C4: got 'n.a.'
## Warning: Expecting numeric in D26693 / R26693C4: got 'n.a.'
## Warning: Expecting numeric in D26694 / R26694C4: got 'n.a.'
## Warning: Expecting numeric in D26695 / R26695C4: got 'n.a.'
## Warning: Expecting numeric in D26696 / R26696C4: got 'n.a.'
## Warning: Expecting numeric in D26697 / R26697C4: got 'n.a.'
## Warning: Expecting numeric in D26698 / R26698C4: got 'n.a.'
## Warning: Expecting numeric in D26699 / R26699C4: got 'n.a.'
## Warning: Expecting numeric in D26700 / R26700C4: got 'n.a.'
## Warning: Expecting numeric in D26701 / R26701C4: got 'n.a.'
## Warning: Expecting numeric in D26702 / R26702C4: got 'n.a.'
## Warning: Expecting numeric in D26703 / R26703C4: got 'n.a.'
## Warning: Expecting numeric in D26704 / R26704C4: got 'n.a.'
## Warning: Expecting numeric in D26705 / R26705C4: got 'n.a.'
## Warning: Expecting numeric in D26706 / R26706C4: got 'n.a.'
## Warning: Expecting numeric in D26707 / R26707C4: got 'n.a.'
## Warning: Expecting numeric in D26708 / R26708C4: got 'n.a.'
## Warning: Expecting numeric in D26709 / R26709C4: got 'n.a.'
## Warning: Expecting numeric in D26710 / R26710C4: got 'n.a.'
## Warning: Expecting numeric in D26711 / R26711C4: got 'n.a.'
## Warning: Expecting numeric in D26712 / R26712C4: got 'n.a.'
## Warning: Expecting numeric in D26713 / R26713C4: got 'n.a.'
## Warning: Expecting numeric in D26714 / R26714C4: got 'n.a.'
## Warning: Expecting numeric in D26715 / R26715C4: got 'n.a.'
## Warning: Expecting numeric in D26716 / R26716C4: got 'n.a.'
## Warning: Expecting numeric in D26717 / R26717C4: got 'n.a.'
## Warning: Expecting numeric in D26718 / R26718C4: got 'n.a.'
## Warning: Expecting numeric in D26719 / R26719C4: got 'n.a.'
## Warning: Expecting numeric in D26720 / R26720C4: got 'n.a.'
## Warning: Expecting numeric in D26721 / R26721C4: got 'n.a.'
## Warning: Expecting numeric in D26722 / R26722C4: got 'n.a.'
## Warning: Expecting numeric in D26723 / R26723C4: got 'n.a.'
## Warning: Expecting numeric in D26724 / R26724C4: got 'n.a.'
## Warning: Expecting numeric in D26725 / R26725C4: got 'n.a.'
## Warning: Expecting numeric in D26726 / R26726C4: got 'n.a.'
## Warning: Expecting numeric in D26727 / R26727C4: got 'n.a.'
## Warning: Expecting numeric in D26728 / R26728C4: got 'n.a.'
## Warning: Expecting numeric in D26729 / R26729C4: got 'n.a.'
## Warning: Expecting numeric in D26730 / R26730C4: got 'n.a.'
## Warning: Expecting numeric in D26731 / R26731C4: got 'n.a.'
## Warning: Expecting numeric in D26732 / R26732C4: got 'n.a.'
## Warning: Expecting numeric in D26733 / R26733C4: got 'n.a.'
## Warning: Expecting numeric in D26734 / R26734C4: got 'n.a.'
## Warning: Expecting numeric in D26735 / R26735C4: got 'n.a.'
## Warning: Expecting numeric in D26736 / R26736C4: got 'n.a.'
## Warning: Expecting numeric in D26737 / R26737C4: got 'n.a.'
## Warning: Expecting numeric in D26738 / R26738C4: got 'n.a.'
## Warning: Expecting numeric in D26739 / R26739C4: got 'n.a.'
## Warning: Expecting numeric in D26740 / R26740C4: got 'n.a.'
## Warning: Expecting numeric in D26741 / R26741C4: got 'n.a.'
## Warning: Expecting numeric in D26742 / R26742C4: got 'n.a.'
## Warning: Expecting numeric in D26743 / R26743C4: got 'n.a.'
## Warning: Expecting numeric in D26744 / R26744C4: got 'n.a.'
## Warning: Expecting numeric in D26745 / R26745C4: got 'n.a.'
## Warning: Expecting numeric in D26746 / R26746C4: got 'n.a.'
## Warning: Expecting numeric in D26747 / R26747C4: got 'n.a.'
## Warning: Expecting numeric in D26748 / R26748C4: got 'n.a.'
## Warning: Expecting numeric in D26749 / R26749C4: got 'n.a.'
## Warning: Expecting numeric in D26750 / R26750C4: got 'n.a.'
## Warning: Expecting numeric in D26751 / R26751C4: got 'n.a.'
## Warning: Expecting numeric in D26752 / R26752C4: got 'n.a.'
## Warning: Expecting numeric in D26753 / R26753C4: got 'n.a.'
## Warning: Expecting numeric in D26754 / R26754C4: got 'n.a.'
## Warning: Expecting numeric in D26755 / R26755C4: got 'n.a.'
## Warning: Expecting numeric in D26756 / R26756C4: got 'n.a.'
## Warning: Expecting numeric in D26757 / R26757C4: got 'n.a.'
## Warning: Expecting numeric in D26758 / R26758C4: got 'n.a.'
## Warning: Expecting numeric in D26759 / R26759C4: got 'n.a.'
## Warning: Expecting numeric in D26760 / R26760C4: got 'n.a.'
## Warning: Expecting numeric in D26761 / R26761C4: got 'n.a.'
## Warning: Expecting numeric in D26762 / R26762C4: got 'n.a.'
## Warning: Expecting numeric in D26763 / R26763C4: got 'n.a.'
## Warning: Expecting numeric in D26764 / R26764C4: got 'n.a.'
## Warning: Expecting numeric in D26765 / R26765C4: got 'n.a.'
## Warning: Expecting numeric in D26766 / R26766C4: got 'n.a.'
## Warning: Expecting numeric in D26767 / R26767C4: got 'n.a.'
## Warning: Expecting numeric in D26768 / R26768C4: got 'n.a.'
## Warning: Expecting numeric in D26769 / R26769C4: got 'n.a.'
## Warning: Expecting numeric in D26770 / R26770C4: got 'n.a.'
## Warning: Expecting numeric in D26771 / R26771C4: got 'n.a.'
## Warning: Expecting numeric in D26772 / R26772C4: got 'n.a.'
## Warning: Expecting numeric in D26773 / R26773C4: got 'n.a.'
## Warning: Expecting numeric in D26774 / R26774C4: got 'n.a.'
## Warning: Expecting numeric in D26775 / R26775C4: got 'n.a.'
## Warning: Expecting numeric in D26776 / R26776C4: got 'n.a.'
## Warning: Expecting numeric in D26777 / R26777C4: got 'n.a.'
## Warning: Expecting numeric in D26778 / R26778C4: got 'n.a.'
## Warning: Expecting numeric in D26779 / R26779C4: got 'n.a.'
## Warning: Expecting numeric in D26780 / R26780C4: got 'n.a.'
## Warning: Expecting numeric in D26781 / R26781C4: got 'n.a.'
## Warning: Expecting numeric in D26782 / R26782C4: got 'n.a.'
## Warning: Expecting numeric in D26783 / R26783C4: got 'n.a.'
## Warning: Expecting numeric in D26784 / R26784C4: got 'n.a.'
## Warning: Expecting numeric in D26785 / R26785C4: got 'n.a.'
## Warning: Expecting numeric in D26786 / R26786C4: got 'n.a.'
## Warning: Expecting numeric in D26787 / R26787C4: got 'n.a.'
## Warning: Expecting numeric in D26788 / R26788C4: got 'n.a.'
## Warning: Expecting numeric in D26789 / R26789C4: got 'n.a.'
## Warning: Expecting numeric in D26790 / R26790C4: got 'n.a.'
## Warning: Expecting numeric in D26791 / R26791C4: got 'n.a.'
## Warning: Expecting numeric in D26792 / R26792C4: got 'n.a.'
## Warning: Expecting numeric in D26793 / R26793C4: got 'n.a.'
## Warning: Expecting numeric in D26794 / R26794C4: got 'n.a.'
## Warning: Expecting numeric in D26795 / R26795C4: got 'n.a.'
## Warning: Expecting numeric in D26796 / R26796C4: got 'n.a.'
## Warning: Expecting numeric in D26797 / R26797C4: got 'n.a.'
## Warning: Expecting numeric in D26798 / R26798C4: got 'n.a.'
## Warning: Expecting numeric in D26799 / R26799C4: got 'n.a.'
## Warning: Expecting numeric in D26800 / R26800C4: got 'n.a.'
## Warning: Expecting numeric in D26801 / R26801C4: got 'n.a.'
## Warning: Expecting numeric in D26802 / R26802C4: got 'n.a.'
## Warning: Expecting numeric in D26803 / R26803C4: got 'n.a.'
## Warning: Expecting numeric in D26804 / R26804C4: got 'n.a.'
## Warning: Expecting numeric in D26805 / R26805C4: got 'n.a.'
## Warning: Expecting numeric in D26806 / R26806C4: got 'n.a.'
## Warning: Expecting numeric in D26807 / R26807C4: got 'n.a.'
## Warning: Expecting numeric in D26808 / R26808C4: got 'n.a.'
## Warning: Expecting numeric in D26809 / R26809C4: got 'n.a.'
## Warning: Expecting numeric in D26810 / R26810C4: got 'n.a.'
## Warning: Expecting numeric in D26811 / R26811C4: got 'n.a.'
## Warning: Expecting numeric in D26812 / R26812C4: got 'n.a.'
## Warning: Expecting numeric in D26813 / R26813C4: got 'n.a.'
## Warning: Expecting numeric in D26814 / R26814C4: got 'n.a.'
## Warning: Expecting numeric in D26815 / R26815C4: got 'n.a.'
## Warning: Expecting numeric in D26816 / R26816C4: got 'n.a.'
## Warning: Expecting numeric in D26817 / R26817C4: got 'n.a.'
## Warning: Expecting numeric in D26818 / R26818C4: got 'n.a.'
## Warning: Expecting numeric in D26819 / R26819C4: got 'n.a.'
## Warning: Expecting numeric in D26820 / R26820C4: got 'n.a.'
## Warning: Expecting numeric in D26821 / R26821C4: got 'n.a.'
## Warning: Expecting numeric in D26822 / R26822C4: got 'n.a.'
## Warning: Expecting numeric in D26823 / R26823C4: got 'n.a.'
## Warning: Expecting numeric in D26824 / R26824C4: got 'n.a.'
## Warning: Expecting numeric in D26825 / R26825C4: got 'n.a.'
## Warning: Expecting numeric in D26826 / R26826C4: got 'n.a.'
## Warning: Expecting numeric in D26827 / R26827C4: got 'n.a.'
## Warning: Expecting numeric in D26828 / R26828C4: got 'n.a.'
## Warning: Expecting numeric in D26829 / R26829C4: got 'n.a.'
## Warning: Expecting numeric in D26830 / R26830C4: got 'n.a.'
## Warning: Expecting numeric in D26831 / R26831C4: got 'n.a.'
## Warning: Expecting numeric in D26832 / R26832C4: got 'n.a.'
## Warning: Expecting numeric in D26833 / R26833C4: got 'n.a.'
## Warning: Expecting numeric in D26834 / R26834C4: got 'n.a.'
## Warning: Expecting numeric in D26835 / R26835C4: got 'n.a.'
## Warning: Expecting numeric in D26836 / R26836C4: got 'n.a.'
## Warning: Expecting numeric in D26837 / R26837C4: got 'n.a.'
## Warning: Expecting numeric in D26838 / R26838C4: got 'n.a.'
## Warning: Expecting numeric in D26839 / R26839C4: got 'n.a.'
## Warning: Expecting numeric in D26840 / R26840C4: got 'n.a.'
## Warning: Expecting numeric in D26841 / R26841C4: got 'n.a.'
## Warning: Expecting numeric in D26842 / R26842C4: got 'n.a.'
## Warning: Expecting numeric in D26843 / R26843C4: got 'n.a.'
## Warning: Expecting numeric in D26844 / R26844C4: got 'n.a.'
## Warning: Expecting numeric in D26845 / R26845C4: got 'n.a.'
## Warning: Expecting numeric in D26846 / R26846C4: got 'n.a.'
## Warning: Expecting numeric in D26847 / R26847C4: got 'n.a.'
## Warning: Expecting numeric in D26848 / R26848C4: got 'n.a.'
## Warning: Expecting numeric in D26849 / R26849C4: got 'n.a.'
## Warning: Expecting numeric in D26850 / R26850C4: got 'n.a.'
## Warning: Expecting numeric in D26851 / R26851C4: got 'n.a.'
## Warning: Expecting numeric in D26852 / R26852C4: got 'n.a.'
## Warning: Expecting numeric in D26853 / R26853C4: got 'n.a.'
## Warning: Expecting numeric in D26854 / R26854C4: got 'n.a.'
## Warning: Expecting numeric in D26855 / R26855C4: got 'n.a.'
## Warning: Expecting numeric in D26856 / R26856C4: got 'n.a.'
## Warning: Expecting numeric in D26857 / R26857C4: got 'n.a.'
## Warning: Expecting numeric in D26858 / R26858C4: got 'n.a.'
## Warning: Expecting numeric in D26859 / R26859C4: got 'n.a.'
## Warning: Expecting numeric in D26860 / R26860C4: got 'n.a.'
## Warning: Expecting numeric in D26861 / R26861C4: got 'n.a.'
## Warning: Expecting numeric in D26862 / R26862C4: got 'n.a.'
## Warning: Expecting numeric in D26863 / R26863C4: got 'n.a.'
## Warning: Expecting numeric in D26864 / R26864C4: got 'n.a.'
## Warning: Expecting numeric in D26865 / R26865C4: got 'n.a.'
## Warning: Expecting numeric in D26866 / R26866C4: got 'n.a.'
## Warning: Expecting numeric in D26867 / R26867C4: got 'n.a.'
## Warning: Expecting numeric in D26868 / R26868C4: got 'n.a.'
## Warning: Expecting numeric in D26869 / R26869C4: got 'n.a.'
## Warning: Expecting numeric in D26870 / R26870C4: got 'n.a.'
## Warning: Expecting numeric in D26871 / R26871C4: got 'n.a.'
## Warning: Expecting numeric in D26872 / R26872C4: got 'n.a.'
## Warning: Expecting numeric in D26873 / R26873C4: got 'n.a.'
## Warning: Expecting numeric in D26874 / R26874C4: got 'n.a.'
## Warning: Expecting numeric in D26875 / R26875C4: got 'n.a.'
## Warning: Expecting numeric in D26876 / R26876C4: got 'n.a.'
## Warning: Expecting numeric in D26877 / R26877C4: got 'n.a.'
## Warning: Expecting numeric in D26878 / R26878C4: got 'n.a.'
## Warning: Expecting numeric in D26879 / R26879C4: got 'n.a.'
## Warning: Expecting numeric in D26880 / R26880C4: got 'n.a.'
## Warning: Expecting numeric in D26881 / R26881C4: got 'n.a.'
## Warning: Expecting numeric in D26882 / R26882C4: got 'n.a.'
## Warning: Expecting numeric in D26883 / R26883C4: got 'n.a.'
## Warning: Expecting numeric in D26884 / R26884C4: got 'n.a.'
## Warning: Expecting numeric in D26885 / R26885C4: got 'n.a.'
## Warning: Expecting numeric in D26886 / R26886C4: got 'n.a.'
## Warning: Expecting numeric in D26887 / R26887C4: got 'n.a.'
## Warning: Expecting numeric in D26888 / R26888C4: got 'n.a.'
## Warning: Expecting numeric in D26889 / R26889C4: got 'n.a.'
## Warning: Expecting numeric in D26890 / R26890C4: got 'n.a.'
## Warning: Expecting numeric in D26891 / R26891C4: got 'n.a.'
## Warning: Expecting numeric in D26892 / R26892C4: got 'n.a.'
## Warning: Expecting numeric in D26893 / R26893C4: got 'n.a.'
## Warning: Expecting numeric in D26894 / R26894C4: got 'n.a.'
## Warning: Expecting numeric in D26895 / R26895C4: got 'n.a.'
## Warning: Expecting numeric in D26896 / R26896C4: got 'n.a.'
## Warning: Expecting numeric in D26897 / R26897C4: got 'n.a.'
## Warning: Expecting numeric in D26898 / R26898C4: got 'n.a.'
## Warning: Expecting numeric in D26899 / R26899C4: got 'n.a.'
## Warning: Expecting numeric in D26900 / R26900C4: got 'n.a.'
## Warning: Expecting numeric in D26901 / R26901C4: got 'n.a.'
## Warning: Expecting numeric in D26902 / R26902C4: got 'n.a.'
## Warning: Expecting numeric in D26903 / R26903C4: got 'n.a.'
## Warning: Expecting numeric in D26904 / R26904C4: got 'n.a.'
## Warning: Expecting numeric in D26905 / R26905C4: got 'n.a.'
## Warning: Expecting numeric in D26906 / R26906C4: got 'n.a.'
## Warning: Expecting numeric in D26907 / R26907C4: got 'n.a.'
## Warning: Expecting numeric in D26908 / R26908C4: got 'n.a.'
## Warning: Expecting numeric in D26909 / R26909C4: got 'n.a.'
## Warning: Expecting numeric in D26910 / R26910C4: got 'n.a.'
## Warning: Expecting numeric in D26911 / R26911C4: got 'n.a.'
## Warning: Expecting numeric in D26912 / R26912C4: got 'n.a.'
## Warning: Expecting numeric in D26913 / R26913C4: got 'n.a.'
## Warning: Expecting numeric in D26914 / R26914C4: got 'n.a.'
## Warning: Expecting numeric in D26915 / R26915C4: got 'n.a.'
## Warning: Expecting numeric in D26916 / R26916C4: got 'n.a.'
## Warning: Expecting numeric in D26917 / R26917C4: got 'n.a.'
## Warning: Expecting numeric in D26918 / R26918C4: got 'n.a.'
## Warning: Expecting numeric in D26919 / R26919C4: got 'n.a.'
## Warning: Expecting numeric in D26920 / R26920C4: got 'n.a.'
## Warning: Expecting numeric in D26921 / R26921C4: got 'n.a.'
## Warning: Expecting numeric in D26922 / R26922C4: got 'n.a.'
## Warning: Expecting numeric in D26923 / R26923C4: got 'n.a.'
## Warning: Expecting numeric in D26924 / R26924C4: got 'n.a.'
## Warning: Expecting numeric in D26925 / R26925C4: got 'n.a.'
## Warning: Expecting numeric in D26926 / R26926C4: got 'n.a.'
## Warning: Expecting numeric in D26927 / R26927C4: got 'n.a.'
## Warning: Expecting numeric in D26928 / R26928C4: got 'n.a.'
## Warning: Expecting numeric in D26929 / R26929C4: got 'n.a.'
## Warning: Expecting numeric in D26930 / R26930C4: got 'n.a.'
## Warning: Expecting numeric in D26931 / R26931C4: got 'n.a.'
## Warning: Expecting numeric in D26932 / R26932C4: got 'n.a.'
## Warning: Expecting numeric in D26933 / R26933C4: got 'n.a.'
## Warning: Expecting numeric in D26934 / R26934C4: got 'n.a.'
## Warning: Expecting numeric in D26935 / R26935C4: got 'n.a.'
## Warning: Expecting numeric in D26936 / R26936C4: got 'n.a.'
## Warning: Expecting numeric in D26937 / R26937C4: got 'n.a.'
## Warning: Expecting numeric in D26938 / R26938C4: got 'n.a.'
## Warning: Expecting numeric in D26939 / R26939C4: got 'n.a.'
## Warning: Expecting numeric in D26940 / R26940C4: got 'n.a.'
## Warning: Expecting numeric in D26941 / R26941C4: got 'n.a.'
## Warning: Expecting numeric in D26942 / R26942C4: got 'n.a.'
## Warning: Expecting numeric in D26943 / R26943C4: got 'n.a.'
## Warning: Expecting numeric in D26944 / R26944C4: got 'n.a.'
## Warning: Expecting numeric in D26945 / R26945C4: got 'n.a.'
## Warning: Expecting numeric in D26946 / R26946C4: got 'n.a.'
## Warning: Expecting numeric in D26947 / R26947C4: got 'n.a.'
## Warning: Expecting numeric in D26948 / R26948C4: got 'n.a.'
## Warning: Expecting numeric in D26949 / R26949C4: got 'n.a.'
## Warning: Expecting numeric in D26950 / R26950C4: got 'n.a.'
## Warning: Expecting numeric in D26951 / R26951C4: got 'n.a.'
## Warning: Expecting numeric in D26952 / R26952C4: got 'n.a.'
## Warning: Expecting numeric in D26953 / R26953C4: got 'n.a.'
## Warning: Expecting numeric in D26954 / R26954C4: got 'n.a.'
## Warning: Expecting numeric in D26955 / R26955C4: got 'n.a.'
## Warning: Expecting numeric in D26956 / R26956C4: got 'n.a.'
## Warning: Expecting numeric in D26957 / R26957C4: got 'n.a.'
## Warning: Expecting numeric in D26958 / R26958C4: got 'n.a.'
## Warning: Expecting numeric in D26959 / R26959C4: got 'n.a.'
## Warning: Expecting numeric in D26960 / R26960C4: got 'n.a.'
## Warning: Expecting numeric in D26961 / R26961C4: got 'n.a.'
## Warning: Expecting numeric in D26962 / R26962C4: got 'n.a.'
## Warning: Expecting numeric in D26963 / R26963C4: got 'n.a.'
## Warning: Expecting numeric in D26964 / R26964C4: got 'n.a.'
## Warning: Expecting numeric in D26965 / R26965C4: got 'n.a.'
## Warning: Expecting numeric in D26966 / R26966C4: got 'n.a.'
## Warning: Expecting numeric in D26967 / R26967C4: got 'n.a.'
## Warning: Expecting numeric in D26968 / R26968C4: got 'n.a.'
## Warning: Expecting numeric in D26969 / R26969C4: got 'n.a.'
## Warning: Expecting numeric in D26970 / R26970C4: got 'n.a.'
## Warning: Expecting numeric in D26971 / R26971C4: got 'n.a.'
## Warning: Expecting numeric in D26972 / R26972C4: got 'n.a.'
## Warning: Expecting numeric in D26973 / R26973C4: got 'n.a.'
## Warning: Expecting numeric in D26974 / R26974C4: got 'n.a.'
## Warning: Expecting numeric in D26975 / R26975C4: got 'n.a.'
## Warning: Expecting numeric in D26976 / R26976C4: got 'n.a.'
## Warning: Expecting numeric in D26977 / R26977C4: got 'n.a.'
## Warning: Expecting numeric in D26978 / R26978C4: got 'n.a.'
## Warning: Expecting numeric in D26979 / R26979C4: got 'n.a.'
## Warning: Expecting numeric in D26980 / R26980C4: got 'n.a.'
## Warning: Expecting numeric in D26981 / R26981C4: got 'n.a.'
## Warning: Expecting numeric in D26982 / R26982C4: got 'n.a.'
## Warning: Expecting numeric in D26983 / R26983C4: got 'n.a.'
## Warning: Expecting numeric in D26984 / R26984C4: got 'n.a.'
## Warning: Expecting numeric in D26985 / R26985C4: got 'n.a.'
## Warning: Expecting numeric in D26986 / R26986C4: got 'n.a.'
## Warning: Expecting numeric in D26987 / R26987C4: got 'n.a.'
## Warning: Expecting numeric in D26988 / R26988C4: got 'n.a.'
## Warning: Expecting numeric in D26989 / R26989C4: got 'n.a.'
## Warning: Expecting numeric in D26990 / R26990C4: got 'n.a.'
## Warning: Expecting numeric in D26991 / R26991C4: got 'n.a.'
## Warning: Expecting numeric in D26992 / R26992C4: got 'n.a.'
## Warning: Expecting numeric in D26993 / R26993C4: got 'n.a.'
## Warning: Expecting numeric in D26994 / R26994C4: got 'n.a.'
## Warning: Expecting numeric in D26995 / R26995C4: got 'n.a.'
## Warning: Expecting numeric in D26996 / R26996C4: got 'n.a.'
## Warning: Expecting numeric in D26997 / R26997C4: got 'n.a.'
## Warning: Expecting numeric in D26998 / R26998C4: got 'n.a.'
## Warning: Expecting numeric in D26999 / R26999C4: got 'n.a.'
## Warning: Expecting numeric in D27000 / R27000C4: got 'n.a.'
## Warning: Expecting numeric in D27001 / R27001C4: got 'n.a.'
## Warning: Expecting numeric in D27002 / R27002C4: got 'n.a.'
## Warning: Expecting numeric in D27003 / R27003C4: got 'n.a.'
## Warning: Expecting numeric in D27004 / R27004C4: got 'n.a.'
## Warning: Expecting numeric in D27005 / R27005C4: got 'n.a.'
## Warning: Expecting numeric in D27006 / R27006C4: got 'n.a.'
## Warning: Expecting numeric in D27007 / R27007C4: got 'n.a.'
## Warning: Expecting numeric in D27008 / R27008C4: got 'n.a.'
## Warning: Expecting numeric in D27009 / R27009C4: got 'n.a.'
## Warning: Expecting numeric in D27010 / R27010C4: got 'n.a.'
## Warning: Expecting numeric in D27011 / R27011C4: got 'n.a.'
## Warning: Expecting numeric in D27012 / R27012C4: got 'n.a.'
## Warning: Expecting numeric in D27013 / R27013C4: got 'n.a.'
## Warning: Expecting numeric in D27014 / R27014C4: got 'n.a.'
## Warning: Expecting numeric in D27015 / R27015C4: got 'n.a.'
## Warning: Expecting numeric in D27016 / R27016C4: got 'n.a.'
## Warning: Expecting numeric in D27017 / R27017C4: got 'n.a.'
## Warning: Expecting numeric in D27018 / R27018C4: got 'n.a.'
## Warning: Expecting numeric in D27019 / R27019C4: got 'n.a.'
## Warning: Expecting numeric in D27020 / R27020C4: got 'n.a.'
## Warning: Expecting numeric in D27021 / R27021C4: got 'n.a.'
## Warning: Expecting numeric in D27022 / R27022C4: got 'n.a.'
## Warning: Expecting numeric in D27023 / R27023C4: got 'n.a.'
## Warning: Expecting numeric in D27024 / R27024C4: got 'n.a.'
## Warning: Expecting numeric in D27025 / R27025C4: got 'n.a.'
## Warning: Expecting numeric in D27026 / R27026C4: got 'n.a.'
## Warning: Expecting numeric in D27027 / R27027C4: got 'n.a.'
## Warning: Expecting numeric in D27028 / R27028C4: got 'n.a.'
## Warning: Expecting numeric in D27029 / R27029C4: got 'n.a.'
## Warning: Expecting numeric in D27030 / R27030C4: got 'n.a.'
## Warning: Expecting numeric in D27031 / R27031C4: got 'n.a.'
## Warning: Expecting numeric in D27032 / R27032C4: got 'n.a.'
## Warning: Expecting numeric in D27033 / R27033C4: got 'n.a.'
## Warning: Expecting numeric in D27034 / R27034C4: got 'n.a.'
## Warning: Expecting numeric in D27035 / R27035C4: got 'n.a.'
## Warning: Expecting numeric in D27036 / R27036C4: got 'n.a.'
## Warning: Expecting numeric in D27037 / R27037C4: got 'n.a.'
## Warning: Expecting numeric in D27038 / R27038C4: got 'n.a.'
## Warning: Expecting numeric in D27039 / R27039C4: got 'n.a.'
## Warning: Expecting numeric in D27040 / R27040C4: got 'n.a.'
## Warning: Expecting numeric in D27041 / R27041C4: got 'n.a.'
## Warning: Expecting numeric in D27042 / R27042C4: got 'n.a.'
## Warning: Expecting numeric in D27043 / R27043C4: got 'n.a.'
## Warning: Expecting numeric in D27044 / R27044C4: got 'n.a.'
## Warning: Expecting numeric in D27045 / R27045C4: got 'n.a.'
## Warning: Expecting numeric in D27046 / R27046C4: got 'n.a.'
## Warning: Expecting numeric in D27047 / R27047C4: got 'n.a.'
## Warning: Expecting numeric in D27048 / R27048C4: got 'n.a.'
## Warning: Expecting numeric in D27049 / R27049C4: got 'n.a.'
## Warning: Expecting numeric in D27050 / R27050C4: got 'n.a.'
## Warning: Expecting numeric in D27051 / R27051C4: got 'n.a.'
## Warning: Expecting numeric in D27052 / R27052C4: got 'n.a.'
## Warning: Expecting numeric in D27053 / R27053C4: got 'n.a.'
## Warning: Expecting numeric in D27054 / R27054C4: got 'n.a.'
## Warning: Expecting numeric in D27055 / R27055C4: got 'n.a.'
## Warning: Expecting numeric in D27056 / R27056C4: got 'n.a.'
## Warning: Expecting numeric in D27057 / R27057C4: got 'n.a.'
## Warning: Expecting numeric in D27058 / R27058C4: got 'n.a.'
## Warning: Expecting numeric in D27059 / R27059C4: got 'n.a.'
## Warning: Expecting numeric in D27060 / R27060C4: got 'n.a.'
## Warning: Expecting numeric in D27061 / R27061C4: got 'n.a.'
## Warning: Expecting numeric in D27062 / R27062C4: got 'n.a.'
## Warning: Expecting numeric in D27063 / R27063C4: got 'n.a.'
## Warning: Expecting numeric in D27064 / R27064C4: got 'n.a.'
## Warning: Expecting numeric in D27065 / R27065C4: got 'n.a.'
## Warning: Expecting numeric in D27066 / R27066C4: got 'n.a.'
## Warning: Expecting numeric in D27067 / R27067C4: got 'n.a.'
## Warning: Expecting numeric in D27068 / R27068C4: got 'n.a.'
## Warning: Expecting numeric in D27069 / R27069C4: got 'n.a.'
## Warning: Expecting numeric in D27070 / R27070C4: got 'n.a.'
## Warning: Expecting numeric in D27071 / R27071C4: got 'n.a.'
## Warning: Expecting numeric in D27072 / R27072C4: got 'n.a.'
## Warning: Expecting numeric in D27073 / R27073C4: got 'n.a.'
## Warning: Expecting numeric in D27074 / R27074C4: got 'n.a.'
## Warning: Expecting numeric in D27075 / R27075C4: got 'n.a.'
## Warning: Expecting numeric in D27076 / R27076C4: got 'n.a.'
## Warning: Expecting numeric in D27077 / R27077C4: got 'n.a.'
## Warning: Expecting numeric in D27078 / R27078C4: got 'n.a.'
## Warning: Expecting numeric in D27079 / R27079C4: got 'n.a.'
## Warning: Expecting numeric in D27080 / R27080C4: got 'n.a.'
## Warning: Expecting numeric in D27081 / R27081C4: got 'n.a.'
## Warning: Expecting numeric in D27082 / R27082C4: got 'n.a.'
## Warning: Expecting numeric in D27083 / R27083C4: got 'n.a.'
## Warning: Expecting numeric in D27084 / R27084C4: got 'n.a.'
## Warning: Expecting numeric in D27085 / R27085C4: got 'n.a.'
## Warning: Expecting numeric in D27086 / R27086C4: got 'n.a.'
## Warning: Expecting numeric in D27087 / R27087C4: got 'n.a.'
## Warning: Expecting numeric in D27088 / R27088C4: got 'n.a.'
## Warning: Expecting numeric in D27089 / R27089C4: got 'n.a.'
## Warning: Expecting numeric in D27090 / R27090C4: got 'n.a.'
## Warning: Expecting numeric in D27091 / R27091C4: got 'n.a.'
## Warning: Expecting numeric in D27092 / R27092C4: got 'n.a.'
## Warning: Expecting numeric in D27093 / R27093C4: got 'n.a.'
## Warning: Expecting numeric in D27094 / R27094C4: got 'n.a.'
## Warning: Expecting numeric in D27095 / R27095C4: got 'n.a.'
## Warning: Expecting numeric in D27096 / R27096C4: got 'n.a.'
## Warning: Expecting numeric in D27097 / R27097C4: got 'n.a.'
## Warning: Expecting numeric in D27098 / R27098C4: got 'n.a.'
## Warning: Expecting numeric in D27099 / R27099C4: got 'n.a.'
## Warning: Expecting numeric in D27100 / R27100C4: got 'n.a.'
## Warning: Expecting numeric in D27101 / R27101C4: got 'n.a.'
## Warning: Expecting numeric in D27102 / R27102C4: got 'n.a.'
## Warning: Expecting numeric in D27103 / R27103C4: got 'n.a.'
## Warning: Expecting numeric in D27104 / R27104C4: got 'n.a.'
## Warning: Expecting numeric in D27105 / R27105C4: got 'n.a.'
## Warning: Expecting numeric in D27106 / R27106C4: got 'n.a.'
## Warning: Expecting numeric in D27107 / R27107C4: got 'n.a.'
## Warning: Expecting numeric in D27108 / R27108C4: got 'n.a.'
## Warning: Expecting numeric in D27109 / R27109C4: got 'n.a.'
## Warning: Expecting numeric in D27110 / R27110C4: got 'n.a.'
## Warning: Expecting numeric in D27111 / R27111C4: got 'n.a.'
## Warning: Expecting numeric in D27112 / R27112C4: got 'n.a.'
## Warning: Expecting numeric in D27113 / R27113C4: got 'n.a.'
## Warning: Expecting numeric in D27114 / R27114C4: got 'n.a.'
## Warning: Expecting numeric in D27115 / R27115C4: got 'n.a.'
## Warning: Expecting numeric in D27116 / R27116C4: got 'n.a.'
## Warning: Expecting numeric in D27117 / R27117C4: got 'n.a.'
## Warning: Expecting numeric in D27118 / R27118C4: got 'n.a.'
## Warning: Expecting numeric in D27119 / R27119C4: got 'n.a.'
## Warning: Expecting numeric in D27120 / R27120C4: got 'n.a.'
## Warning: Expecting numeric in D27121 / R27121C4: got 'n.a.'
## Warning: Expecting numeric in D27122 / R27122C4: got 'n.a.'
## Warning: Expecting numeric in D27123 / R27123C4: got 'n.a.'
## Warning: Expecting numeric in D27124 / R27124C4: got 'n.a.'
## Warning: Expecting numeric in D27125 / R27125C4: got 'n.a.'
## Warning: Expecting numeric in D27126 / R27126C4: got 'n.a.'
## Warning: Expecting numeric in D27127 / R27127C4: got 'n.a.'
## Warning: Expecting numeric in D27128 / R27128C4: got 'n.a.'
## Warning: Expecting numeric in D27129 / R27129C4: got 'n.a.'
## Warning: Expecting numeric in D27130 / R27130C4: got 'n.a.'
## Warning: Expecting numeric in D27131 / R27131C4: got 'n.a.'
## Warning: Expecting numeric in D27132 / R27132C4: got 'n.a.'
## Warning: Expecting numeric in D27133 / R27133C4: got 'n.a.'
## Warning: Expecting numeric in D27134 / R27134C4: got 'n.a.'
## Warning: Expecting numeric in D27135 / R27135C4: got 'n.a.'
## Warning: Expecting numeric in D27136 / R27136C4: got 'n.a.'
## Warning: Expecting numeric in D27137 / R27137C4: got 'n.a.'
## Warning: Expecting numeric in D27138 / R27138C4: got 'n.a.'
## Warning: Expecting numeric in D27139 / R27139C4: got 'n.a.'
## Warning: Expecting numeric in D27140 / R27140C4: got 'n.a.'
## Warning: Expecting numeric in D27141 / R27141C4: got 'n.a.'
## Warning: Expecting numeric in D27142 / R27142C4: got 'n.a.'
## Warning: Expecting numeric in D27143 / R27143C4: got 'n.a.'
## Warning: Expecting numeric in D27144 / R27144C4: got 'n.a.'
## Warning: Expecting numeric in D27145 / R27145C4: got 'n.a.'
## Warning: Expecting numeric in D27146 / R27146C4: got 'n.a.'
## Warning: Expecting numeric in D27147 / R27147C4: got 'n.a.'
## Warning: Expecting numeric in D27148 / R27148C4: got 'n.a.'
## Warning: Expecting numeric in D27149 / R27149C4: got 'n.a.'
## Warning: Expecting numeric in D27150 / R27150C4: got 'n.a.'
## Warning: Expecting numeric in D27151 / R27151C4: got 'n.a.'
## Warning: Expecting numeric in D27152 / R27152C4: got 'n.a.'
## Warning: Expecting numeric in D27153 / R27153C4: got 'n.a.'
## Warning: Expecting numeric in D27154 / R27154C4: got 'n.a.'
## Warning: Expecting numeric in D27155 / R27155C4: got 'n.a.'
## Warning: Expecting numeric in D27156 / R27156C4: got 'n.a.'
## Warning: Expecting numeric in D27157 / R27157C4: got 'n.a.'
## Warning: Expecting numeric in D27158 / R27158C4: got 'n.a.'
## Warning: Expecting numeric in D27159 / R27159C4: got 'n.a.'
## Warning: Expecting numeric in D27160 / R27160C4: got 'n.a.'
## Warning: Expecting numeric in D27161 / R27161C4: got 'n.a.'
## Warning: Expecting numeric in D27162 / R27162C4: got 'n.a.'
## Warning: Expecting numeric in D27163 / R27163C4: got 'n.a.'
## Warning: Expecting numeric in D27164 / R27164C4: got 'n.a.'
## Warning: Expecting numeric in D27165 / R27165C4: got 'n.a.'
## Warning: Expecting numeric in D27166 / R27166C4: got 'n.a.'
## Warning: Expecting numeric in D27167 / R27167C4: got 'n.a.'
## Warning: Expecting numeric in D27168 / R27168C4: got 'n.a.'
## Warning: Expecting numeric in D27169 / R27169C4: got 'n.a.'
## Warning: Expecting numeric in D27170 / R27170C4: got 'n.a.'
## Warning: Expecting numeric in D27171 / R27171C4: got 'n.a.'
## Warning: Expecting numeric in D27172 / R27172C4: got 'n.a.'
## Warning: Expecting numeric in D27173 / R27173C4: got 'n.a.'
## Warning: Expecting numeric in D27174 / R27174C4: got 'n.a.'
## Warning: Expecting numeric in D27175 / R27175C4: got 'n.a.'
## Warning: Expecting numeric in D27176 / R27176C4: got 'n.a.'
## Warning: Expecting numeric in D27177 / R27177C4: got 'n.a.'
## Warning: Expecting numeric in D27178 / R27178C4: got 'n.a.'
## Warning: Expecting numeric in D27179 / R27179C4: got 'n.a.'
## Warning: Expecting numeric in D27180 / R27180C4: got 'n.a.'
## Warning: Expecting numeric in D27181 / R27181C4: got 'n.a.'
## Warning: Expecting numeric in D27182 / R27182C4: got 'n.a.'
## Warning: Expecting numeric in D27183 / R27183C4: got 'n.a.'
## Warning: Expecting numeric in D27184 / R27184C4: got 'n.a.'
## Warning: Expecting numeric in D27185 / R27185C4: got 'n.a.'
## Warning: Expecting numeric in D27186 / R27186C4: got 'n.a.'
## Warning: Expecting numeric in D27187 / R27187C4: got 'n.a.'
## Warning: Expecting numeric in D27188 / R27188C4: got 'n.a.'
## Warning: Expecting numeric in D27189 / R27189C4: got 'n.a.'
## Warning: Expecting numeric in D27190 / R27190C4: got 'n.a.'
## Warning: Expecting numeric in D27191 / R27191C4: got 'n.a.'
## Warning: Expecting numeric in D27192 / R27192C4: got 'n.a.'
## Warning: Expecting numeric in D27193 / R27193C4: got 'n.a.'
## Warning: Expecting numeric in D27194 / R27194C4: got 'n.a.'
## Warning: Expecting numeric in D27195 / R27195C4: got 'n.a.'
## Warning: Expecting numeric in D27196 / R27196C4: got 'n.a.'
## Warning: Expecting numeric in D27197 / R27197C4: got 'n.a.'
## Warning: Expecting numeric in D27198 / R27198C4: got 'n.a.'
## Warning: Expecting numeric in D27199 / R27199C4: got 'n.a.'
## Warning: Expecting numeric in D27200 / R27200C4: got 'n.a.'
## Warning: Expecting numeric in D27201 / R27201C4: got 'n.a.'
## Warning: Expecting numeric in D27202 / R27202C4: got 'n.a.'
## Warning: Expecting numeric in D27203 / R27203C4: got 'n.a.'
## Warning: Expecting numeric in D27204 / R27204C4: got 'n.a.'
## Warning: Expecting numeric in D27205 / R27205C4: got 'n.a.'
## Warning: Expecting numeric in D27206 / R27206C4: got 'n.a.'
## Warning: Expecting numeric in D27207 / R27207C4: got 'n.a.'
## Warning: Expecting numeric in D27208 / R27208C4: got 'n.a.'
## Warning: Expecting numeric in D27209 / R27209C4: got 'n.a.'
## Warning: Expecting numeric in D27210 / R27210C4: got 'n.a.'
## Warning: Expecting numeric in D27211 / R27211C4: got 'n.a.'
## Warning: Expecting numeric in D27212 / R27212C4: got 'n.a.'
## Warning: Expecting numeric in D27213 / R27213C4: got 'n.a.'
## Warning: Expecting numeric in D27214 / R27214C4: got 'n.a.'
## Warning: Expecting numeric in D27215 / R27215C4: got 'n.a.'
## Warning: Expecting numeric in D27216 / R27216C4: got 'n.a.'
## Warning: Expecting numeric in D27217 / R27217C4: got 'n.a.'
## Warning: Expecting numeric in D27218 / R27218C4: got 'n.a.'
## Warning: Expecting numeric in D27219 / R27219C4: got 'n.a.'
## Warning: Expecting numeric in D27220 / R27220C4: got 'n.a.'
## Warning: Expecting numeric in D27221 / R27221C4: got 'n.a.'
## Warning: Expecting numeric in D27222 / R27222C4: got 'n.a.'
## Warning: Expecting numeric in D27223 / R27223C4: got 'n.a.'
## Warning: Expecting numeric in D27224 / R27224C4: got 'n.a.'
## Warning: Expecting numeric in D27225 / R27225C4: got 'n.a.'
## Warning: Expecting numeric in D27226 / R27226C4: got 'n.a.'
## Warning: Expecting numeric in D27227 / R27227C4: got 'n.a.'
## Warning: Expecting numeric in D27228 / R27228C4: got 'n.a.'
## Warning: Expecting numeric in D27229 / R27229C4: got 'n.a.'
## Warning: Expecting numeric in D27230 / R27230C4: got 'n.a.'
## Warning: Expecting numeric in D27231 / R27231C4: got 'n.a.'
## Warning: Expecting numeric in D27232 / R27232C4: got 'n.a.'
## Warning: Expecting numeric in D27233 / R27233C4: got 'n.a.'
## Warning: Expecting numeric in D27234 / R27234C4: got 'n.a.'
## Warning: Expecting numeric in D27235 / R27235C4: got 'n.a.'
## Warning: Expecting numeric in D27236 / R27236C4: got 'n.a.'
## Warning: Expecting numeric in D27237 / R27237C4: got 'n.a.'
## Warning: Expecting numeric in D27238 / R27238C4: got 'n.a.'
## Warning: Expecting numeric in D27239 / R27239C4: got 'n.a.'
## Warning: Expecting numeric in D27240 / R27240C4: got 'n.a.'
## Warning: Expecting numeric in D27241 / R27241C4: got 'n.a.'
## Warning: Expecting numeric in D27242 / R27242C4: got 'n.a.'
## Warning: Expecting numeric in D27243 / R27243C4: got 'n.a.'
## Warning: Expecting numeric in D27244 / R27244C4: got 'n.a.'
## Warning: Expecting numeric in D27245 / R27245C4: got 'n.a.'
## Warning: Expecting numeric in D27246 / R27246C4: got 'n.a.'
## Warning: Expecting numeric in D27247 / R27247C4: got 'n.a.'
## Warning: Expecting numeric in D27248 / R27248C4: got 'n.a.'
## Warning: Expecting numeric in D27249 / R27249C4: got 'n.a.'
## Warning: Expecting numeric in D27250 / R27250C4: got 'n.a.'
## Warning: Expecting numeric in D27251 / R27251C4: got 'n.a.'
## Warning: Expecting numeric in D27252 / R27252C4: got 'n.a.'
## Warning: Expecting numeric in D27253 / R27253C4: got 'n.a.'
## Warning: Expecting numeric in D27254 / R27254C4: got 'n.a.'
## Warning: Expecting numeric in D27255 / R27255C4: got 'n.a.'
## Warning: Expecting numeric in D27256 / R27256C4: got 'n.a.'
## Warning: Expecting numeric in D27257 / R27257C4: got 'n.a.'
## Warning: Expecting numeric in D27258 / R27258C4: got 'n.a.'
## Warning: Expecting numeric in D27259 / R27259C4: got 'n.a.'
## Warning: Expecting numeric in D27260 / R27260C4: got 'n.a.'
## Warning: Expecting numeric in D27261 / R27261C4: got 'n.a.'
## Warning: Expecting numeric in D27262 / R27262C4: got 'n.a.'
## Warning: Expecting numeric in D27263 / R27263C4: got 'n.a.'
## Warning: Expecting numeric in D27264 / R27264C4: got 'n.a.'
## Warning: Expecting numeric in D27265 / R27265C4: got 'n.a.'
## Warning: Expecting numeric in D27266 / R27266C4: got 'n.a.'
## Warning: Expecting numeric in D27267 / R27267C4: got 'n.a.'
## Warning: Expecting numeric in D27268 / R27268C4: got 'n.a.'
## Warning: Expecting numeric in D27269 / R27269C4: got 'n.a.'
## Warning: Expecting numeric in D27270 / R27270C4: got 'n.a.'
## Warning: Expecting numeric in D27271 / R27271C4: got 'n.a.'
## Warning: Expecting numeric in D27272 / R27272C4: got 'n.a.'
## Warning: Expecting numeric in D27273 / R27273C4: got 'n.a.'
## Warning: Expecting numeric in D27274 / R27274C4: got 'n.a.'
## Warning: Expecting numeric in D27275 / R27275C4: got 'n.a.'
## Warning: Expecting numeric in D27276 / R27276C4: got 'n.a.'
## Warning: Expecting numeric in D27277 / R27277C4: got 'n.a.'
## Warning: Expecting numeric in D27278 / R27278C4: got 'n.a.'
## Warning: Expecting numeric in D27279 / R27279C4: got 'n.a.'
## Warning: Expecting numeric in D27280 / R27280C4: got 'n.a.'
## Warning: Expecting numeric in D27281 / R27281C4: got 'n.a.'
## Warning: Expecting numeric in D27282 / R27282C4: got 'n.a.'
## Warning: Expecting numeric in D27283 / R27283C4: got 'n.a.'
## Warning: Expecting numeric in D27284 / R27284C4: got 'n.a.'
## Warning: Expecting numeric in D27285 / R27285C4: got 'n.a.'
## Warning: Expecting numeric in D27286 / R27286C4: got 'n.a.'
## Warning: Expecting numeric in D27287 / R27287C4: got 'n.a.'
## Warning: Expecting numeric in D27288 / R27288C4: got 'n.a.'
## Warning: Expecting numeric in D27289 / R27289C4: got 'n.a.'
## Warning: Expecting numeric in D27290 / R27290C4: got 'n.a.'
## Warning: Expecting numeric in D27291 / R27291C4: got 'n.a.'
## Warning: Expecting numeric in D27292 / R27292C4: got 'n.a.'
## Warning: Expecting numeric in D27293 / R27293C4: got 'n.a.'
## Warning: Expecting numeric in D27294 / R27294C4: got 'n.a.'
## Warning: Expecting numeric in D27295 / R27295C4: got 'n.a.'
## Warning: Expecting numeric in D27296 / R27296C4: got 'n.a.'
## Warning: Expecting numeric in D27297 / R27297C4: got 'n.a.'
## Warning: Expecting numeric in D27298 / R27298C4: got 'n.a.'
## Warning: Expecting numeric in D27299 / R27299C4: got 'n.a.'
## Warning: Expecting numeric in D27300 / R27300C4: got 'n.a.'
## Warning: Expecting numeric in D27301 / R27301C4: got 'n.a.'
## Warning: Expecting numeric in D27302 / R27302C4: got 'n.a.'
## Warning: Expecting numeric in D27303 / R27303C4: got 'n.a.'
## Warning: Expecting numeric in D27304 / R27304C4: got 'n.a.'
## Warning: Expecting numeric in D27305 / R27305C4: got 'n.a.'
## Warning: Expecting numeric in D27306 / R27306C4: got 'n.a.'
## Warning: Expecting numeric in D27307 / R27307C4: got 'n.a.'
## Warning: Expecting numeric in D27308 / R27308C4: got 'n.a.'
## Warning: Expecting numeric in D27309 / R27309C4: got 'n.a.'
## Warning: Expecting numeric in D27310 / R27310C4: got 'n.a.'
## Warning: Expecting numeric in D27311 / R27311C4: got 'n.a.'
## Warning: Expecting numeric in D27312 / R27312C4: got 'n.a.'
## Warning: Expecting numeric in D27313 / R27313C4: got 'n.a.'
## Warning: Expecting numeric in D27314 / R27314C4: got 'n.a.'
## Warning: Expecting numeric in D27315 / R27315C4: got 'n.a.'
## Warning: Expecting numeric in D27316 / R27316C4: got 'n.a.'
## Warning: Expecting numeric in D27317 / R27317C4: got 'n.a.'
## Warning: Expecting numeric in D27318 / R27318C4: got 'n.a.'
## Warning: Expecting numeric in D27319 / R27319C4: got 'n.a.'
## Warning: Expecting numeric in D27320 / R27320C4: got 'n.a.'
## Warning: Expecting numeric in D27321 / R27321C4: got 'n.a.'
## Warning: Expecting numeric in D27322 / R27322C4: got 'n.a.'
## Warning: Expecting numeric in D27323 / R27323C4: got 'n.a.'
## Warning: Expecting numeric in D27324 / R27324C4: got 'n.a.'
## Warning: Expecting numeric in D27325 / R27325C4: got 'n.a.'
## Warning: Expecting numeric in D27326 / R27326C4: got 'n.a.'
## Warning: Expecting numeric in D27327 / R27327C4: got 'n.a.'
## Warning: Expecting numeric in D27328 / R27328C4: got 'n.a.'
## Warning: Expecting numeric in D27329 / R27329C4: got 'n.a.'
## Warning: Expecting numeric in D27330 / R27330C4: got 'n.a.'
## Warning: Expecting numeric in D27331 / R27331C4: got 'n.a.'
## Warning: Expecting numeric in D27332 / R27332C4: got 'n.a.'
## Warning: Expecting numeric in D27333 / R27333C4: got 'n.a.'
## Warning: Expecting numeric in D27334 / R27334C4: got 'n.a.'
## Warning: Expecting numeric in D27335 / R27335C4: got 'n.a.'
## Warning: Expecting numeric in D27336 / R27336C4: got 'n.a.'
## Warning: Expecting numeric in D27337 / R27337C4: got 'n.a.'
## Warning: Expecting numeric in D27338 / R27338C4: got 'n.a.'
## Warning: Expecting numeric in D27339 / R27339C4: got 'n.a.'
## Warning: Expecting numeric in D27340 / R27340C4: got 'n.a.'
## Warning: Expecting numeric in D27341 / R27341C4: got 'n.a.'
## Warning: Expecting numeric in D27342 / R27342C4: got 'n.a.'
## Warning: Expecting numeric in D27343 / R27343C4: got 'n.a.'
## Warning: Expecting numeric in D27344 / R27344C4: got 'n.a.'
## Warning: Expecting numeric in D27345 / R27345C4: got 'n.a.'
## Warning: Expecting numeric in D27346 / R27346C4: got 'n.a.'
## Warning: Expecting numeric in D27347 / R27347C4: got 'n.a.'
## Warning: Expecting numeric in D27348 / R27348C4: got 'n.a.'
## Warning: Expecting numeric in D27349 / R27349C4: got 'n.a.'
## Warning: Expecting numeric in D27350 / R27350C4: got 'n.a.'
## Warning: Expecting numeric in D27351 / R27351C4: got 'n.a.'
## Warning: Expecting numeric in D27352 / R27352C4: got 'n.a.'
## Warning: Expecting numeric in D27353 / R27353C4: got 'n.a.'
## Warning: Expecting numeric in D27354 / R27354C4: got 'n.a.'
## Warning: Expecting numeric in D27355 / R27355C4: got 'n.a.'
## Warning: Expecting numeric in D27356 / R27356C4: got 'n.a.'
## Warning: Expecting numeric in D27357 / R27357C4: got 'n.a.'
## Warning: Expecting numeric in D27358 / R27358C4: got 'n.a.'
## Warning: Expecting numeric in D27359 / R27359C4: got 'n.a.'
## Warning: Expecting numeric in D27360 / R27360C4: got 'n.a.'
## Warning: Expecting numeric in D27361 / R27361C4: got 'n.a.'
## Warning: Expecting numeric in D27362 / R27362C4: got 'n.a.'
## Warning: Expecting numeric in D27363 / R27363C4: got 'n.a.'
## Warning: Expecting numeric in D27364 / R27364C4: got 'n.a.'
## Warning: Expecting numeric in D27365 / R27365C4: got 'n.a.'
## Warning: Expecting numeric in D27366 / R27366C4: got 'n.a.'
## Warning: Expecting numeric in D27367 / R27367C4: got 'n.a.'
## Warning: Expecting numeric in D27368 / R27368C4: got 'n.a.'
## Warning: Expecting numeric in D27369 / R27369C4: got 'n.a.'
## Warning: Expecting numeric in D27370 / R27370C4: got 'n.a.'
## Warning: Expecting numeric in D27371 / R27371C4: got 'n.a.'
## Warning: Expecting numeric in D27372 / R27372C4: got 'n.a.'
## Warning: Expecting numeric in D27373 / R27373C4: got 'n.a.'
## Warning: Expecting numeric in D27374 / R27374C4: got 'n.a.'
## Warning: Expecting numeric in D27375 / R27375C4: got 'n.a.'
## Warning: Expecting numeric in D27376 / R27376C4: got 'n.a.'
## Warning: Expecting numeric in D27377 / R27377C4: got 'n.a.'
## Warning: Expecting numeric in D27378 / R27378C4: got 'n.a.'
## Warning: Expecting numeric in D27379 / R27379C4: got 'n.a.'
## Warning: Expecting numeric in D27380 / R27380C4: got 'n.a.'
## Warning: Expecting numeric in D27381 / R27381C4: got 'n.a.'
## Warning: Expecting numeric in D27382 / R27382C4: got 'n.a.'
## Warning: Expecting numeric in D27383 / R27383C4: got 'n.a.'
## Warning: Expecting numeric in D27384 / R27384C4: got 'n.a.'
## Warning: Expecting numeric in D27385 / R27385C4: got 'n.a.'
## Warning: Expecting numeric in D27386 / R27386C4: got 'n.a.'
## Warning: Expecting numeric in D27387 / R27387C4: got 'n.a.'
## Warning: Expecting numeric in D27388 / R27388C4: got 'n.a.'
## Warning: Expecting numeric in D27389 / R27389C4: got 'n.a.'
## Warning: Expecting numeric in D27390 / R27390C4: got 'n.a.'
## Warning: Expecting numeric in D27391 / R27391C4: got 'n.a.'
## Warning: Expecting numeric in D27392 / R27392C4: got 'n.a.'
## Warning: Expecting numeric in D27393 / R27393C4: got 'n.a.'
## Warning: Expecting numeric in D27394 / R27394C4: got 'n.a.'
## Warning: Expecting numeric in D27395 / R27395C4: got 'n.a.'
## Warning: Expecting numeric in D27396 / R27396C4: got 'n.a.'
## Warning: Expecting numeric in D27397 / R27397C4: got 'n.a.'
## Warning: Expecting numeric in D27398 / R27398C4: got 'n.a.'
## Warning: Expecting numeric in D27399 / R27399C4: got 'n.a.'
## Warning: Expecting numeric in D27400 / R27400C4: got 'n.a.'
## Warning: Expecting numeric in D27401 / R27401C4: got 'n.a.'
## Warning: Expecting numeric in D27402 / R27402C4: got 'n.a.'
## Warning: Expecting numeric in D27403 / R27403C4: got 'n.a.'
## Warning: Expecting numeric in D27404 / R27404C4: got 'n.a.'
## Warning: Expecting numeric in D27405 / R27405C4: got 'n.a.'
## Warning: Expecting numeric in D27406 / R27406C4: got 'n.a.'
## Warning: Expecting numeric in D27407 / R27407C4: got 'n.a.'
## Warning: Expecting numeric in D27408 / R27408C4: got 'n.a.'
## Warning: Expecting numeric in D27409 / R27409C4: got 'n.a.'
## Warning: Expecting numeric in D27410 / R27410C4: got 'n.a.'
## Warning: Expecting numeric in D27411 / R27411C4: got 'n.a.'
## Warning: Expecting numeric in D27412 / R27412C4: got 'n.a.'
## Warning: Expecting numeric in D27413 / R27413C4: got 'n.a.'
## Warning: Expecting numeric in D27414 / R27414C4: got 'n.a.'
## Warning: Expecting numeric in D27415 / R27415C4: got 'n.a.'
## Warning: Expecting numeric in D27416 / R27416C4: got 'n.a.'
## Warning: Expecting numeric in D27417 / R27417C4: got 'n.a.'
## Warning: Expecting numeric in D27418 / R27418C4: got 'n.a.'
## Warning: Expecting numeric in D27419 / R27419C4: got 'n.a.'
## Warning: Expecting numeric in D27420 / R27420C4: got 'n.a.'
## Warning: Expecting numeric in D27421 / R27421C4: got 'n.a.'
## Warning: Expecting numeric in D27422 / R27422C4: got 'n.a.'
## Warning: Expecting numeric in D27423 / R27423C4: got 'n.a.'
## Warning: Expecting numeric in D27424 / R27424C4: got 'n.a.'
## Warning: Expecting numeric in D27425 / R27425C4: got 'n.a.'
## Warning: Expecting numeric in D27426 / R27426C4: got 'n.a.'
## Warning: Expecting numeric in D27427 / R27427C4: got 'n.a.'
## Warning: Expecting numeric in D27428 / R27428C4: got 'n.a.'
## Warning: Expecting numeric in D27429 / R27429C4: got 'n.a.'
## Warning: Expecting numeric in D27430 / R27430C4: got 'n.a.'
## Warning: Expecting numeric in D27431 / R27431C4: got 'n.a.'
## Warning: Expecting numeric in D27432 / R27432C4: got 'n.a.'
## Warning: Expecting numeric in D27433 / R27433C4: got 'n.a.'
## Warning: Expecting numeric in D27434 / R27434C4: got 'n.a.'
## Warning: Expecting numeric in D27435 / R27435C4: got 'n.a.'
## Warning: Expecting numeric in D27436 / R27436C4: got 'n.a.'
## Warning: Expecting numeric in D27437 / R27437C4: got 'n.a.'
## Warning: Expecting numeric in D27438 / R27438C4: got 'n.a.'
## Warning: Expecting numeric in D27439 / R27439C4: got 'n.a.'
## Warning: Expecting numeric in D27440 / R27440C4: got 'n.a.'
## Warning: Expecting numeric in D27441 / R27441C4: got 'n.a.'
## Warning: Expecting numeric in D27442 / R27442C4: got 'n.a.'
## Warning: Expecting numeric in D27443 / R27443C4: got 'n.a.'
## Warning: Expecting numeric in D27444 / R27444C4: got 'n.a.'
## Warning: Expecting numeric in D27445 / R27445C4: got 'n.a.'
## Warning: Expecting numeric in D27446 / R27446C4: got 'n.a.'
## Warning: Expecting numeric in D27447 / R27447C4: got 'n.a.'
## Warning: Expecting numeric in D27448 / R27448C4: got 'n.a.'
## Warning: Expecting numeric in D27449 / R27449C4: got 'n.a.'
## Warning: Expecting numeric in D27450 / R27450C4: got 'n.a.'
## Warning: Expecting numeric in D27451 / R27451C4: got 'n.a.'
## Warning: Expecting numeric in D27452 / R27452C4: got 'n.a.'
## Warning: Expecting numeric in D27453 / R27453C4: got 'n.a.'
## Warning: Expecting numeric in D27454 / R27454C4: got 'n.a.'
## Warning: Expecting numeric in D27455 / R27455C4: got 'n.a.'
## Warning: Expecting numeric in D27456 / R27456C4: got 'n.a.'
## Warning: Expecting numeric in D27457 / R27457C4: got 'n.a.'
## Warning: Expecting numeric in D27458 / R27458C4: got 'n.a.'
## Warning: Expecting numeric in D27459 / R27459C4: got 'n.a.'
## Warning: Expecting numeric in D27460 / R27460C4: got 'n.a.'
## Warning: Expecting numeric in D27461 / R27461C4: got 'n.a.'
## Warning: Expecting numeric in D27462 / R27462C4: got 'n.a.'
## Warning: Expecting numeric in D27463 / R27463C4: got 'n.a.'
## Warning: Expecting numeric in D27464 / R27464C4: got 'n.a.'
## Warning: Expecting numeric in D27465 / R27465C4: got 'n.a.'
## Warning: Expecting numeric in D27466 / R27466C4: got 'n.a.'
## Warning: Expecting numeric in D27467 / R27467C4: got 'n.a.'
## Warning: Expecting numeric in D27468 / R27468C4: got 'n.a.'
## Warning: Expecting numeric in D27469 / R27469C4: got 'n.a.'
## Warning: Expecting numeric in D27470 / R27470C4: got 'n.a.'
## Warning: Expecting numeric in D27471 / R27471C4: got 'n.a.'
## Warning: Expecting numeric in D27472 / R27472C4: got 'n.a.'
## Warning: Expecting numeric in D27473 / R27473C4: got 'n.a.'
## Warning: Expecting numeric in D27474 / R27474C4: got 'n.a.'
## Warning: Expecting numeric in D27475 / R27475C4: got 'n.a.'
## Warning: Expecting numeric in D27476 / R27476C4: got 'n.a.'
## Warning: Expecting numeric in D27477 / R27477C4: got 'n.a.'
## Warning: Expecting numeric in D27478 / R27478C4: got 'n.a.'
## Warning: Expecting numeric in D27479 / R27479C4: got 'n.a.'
## Warning: Expecting numeric in D27480 / R27480C4: got 'n.a.'
## Warning: Expecting numeric in D27481 / R27481C4: got 'n.a.'
## Warning: Expecting numeric in D27482 / R27482C4: got 'n.a.'
## Warning: Expecting numeric in D27483 / R27483C4: got 'n.a.'
## Warning: Expecting numeric in D27484 / R27484C4: got 'n.a.'
## Warning: Expecting numeric in D27485 / R27485C4: got 'n.a.'
## Warning: Expecting numeric in D27486 / R27486C4: got 'n.a.'
## Warning: Expecting numeric in D27487 / R27487C4: got 'n.a.'
## Warning: Expecting numeric in D27488 / R27488C4: got 'n.a.'
## Warning: Expecting numeric in D27489 / R27489C4: got 'n.a.'
## Warning: Expecting numeric in D27490 / R27490C4: got 'n.a.'
## Warning: Expecting numeric in D27491 / R27491C4: got 'n.a.'
## Warning: Expecting numeric in D27492 / R27492C4: got 'n.a.'
## Warning: Expecting numeric in D27493 / R27493C4: got 'n.a.'
## Warning: Expecting numeric in D27494 / R27494C4: got 'n.a.'
## Warning: Expecting numeric in D27495 / R27495C4: got 'n.a.'
## Warning: Expecting numeric in D27496 / R27496C4: got 'n.a.'
## Warning: Expecting numeric in D27497 / R27497C4: got 'n.a.'
## Warning: Expecting numeric in D27498 / R27498C4: got 'n.a.'
## Warning: Expecting numeric in D27499 / R27499C4: got 'n.a.'
## Warning: Expecting numeric in D27500 / R27500C4: got 'n.a.'
## Warning: Expecting numeric in D27501 / R27501C4: got 'n.a.'
## Warning: Expecting numeric in D27502 / R27502C4: got 'n.a.'
## Warning: Expecting numeric in D27503 / R27503C4: got 'n.a.'
## Warning: Expecting numeric in D27504 / R27504C4: got 'n.a.'
## Warning: Expecting numeric in D27505 / R27505C4: got 'n.a.'
## Warning: Expecting numeric in D27506 / R27506C4: got 'n.a.'
## Warning: Expecting numeric in D27507 / R27507C4: got 'n.a.'
## Warning: Expecting numeric in D27508 / R27508C4: got 'n.a.'
## Warning: Expecting numeric in D27509 / R27509C4: got 'n.a.'
## Warning: Expecting numeric in D27510 / R27510C4: got 'n.a.'
## Warning: Expecting numeric in D27511 / R27511C4: got 'n.a.'
## Warning: Expecting numeric in D27512 / R27512C4: got 'n.a.'
## Warning: Expecting numeric in D27513 / R27513C4: got 'n.a.'
## Warning: Expecting numeric in D27514 / R27514C4: got 'n.a.'
## Warning: Expecting numeric in D27515 / R27515C4: got 'n.a.'
## Warning: Expecting numeric in D27516 / R27516C4: got 'n.a.'
## Warning: Expecting numeric in D27517 / R27517C4: got 'n.a.'
## Warning: Expecting numeric in D27518 / R27518C4: got 'n.a.'
## Warning: Expecting numeric in D27519 / R27519C4: got 'n.a.'
## Warning: Expecting numeric in D27520 / R27520C4: got 'n.a.'
## Warning: Expecting numeric in D27521 / R27521C4: got 'n.a.'
## Warning: Expecting numeric in D27522 / R27522C4: got 'n.a.'
## Warning: Expecting numeric in D27523 / R27523C4: got 'n.a.'
## Warning: Expecting numeric in D27524 / R27524C4: got 'n.a.'
## Warning: Expecting numeric in D27525 / R27525C4: got 'n.a.'
## Warning: Expecting numeric in D27526 / R27526C4: got 'n.a.'
## Warning: Expecting numeric in D27527 / R27527C4: got 'n.a.'
## Warning: Expecting numeric in D27528 / R27528C4: got 'n.a.'
## Warning: Expecting numeric in D27529 / R27529C4: got 'n.a.'
## Warning: Expecting numeric in D27530 / R27530C4: got 'n.a.'
## Warning: Expecting numeric in D27531 / R27531C4: got 'n.a.'
## Warning: Expecting numeric in D27532 / R27532C4: got 'n.a.'
## Warning: Expecting numeric in D27533 / R27533C4: got 'n.a.'
## Warning: Expecting numeric in D27534 / R27534C4: got 'n.a.'
## Warning: Expecting numeric in D27535 / R27535C4: got 'n.a.'
## Warning: Expecting numeric in D27536 / R27536C4: got 'n.a.'
## Warning: Expecting numeric in D27537 / R27537C4: got 'n.a.'
## Warning: Expecting numeric in D27538 / R27538C4: got 'n.a.'
## Warning: Expecting numeric in D27539 / R27539C4: got 'n.a.'
## Warning: Expecting numeric in D27540 / R27540C4: got 'n.a.'
## Warning: Expecting numeric in D27541 / R27541C4: got 'n.a.'
## Warning: Expecting numeric in D27542 / R27542C4: got 'n.a.'
## Warning: Expecting numeric in D27543 / R27543C4: got 'n.a.'
## Warning: Expecting numeric in D27544 / R27544C4: got 'n.a.'
## Warning: Expecting numeric in D27545 / R27545C4: got 'n.a.'
## Warning: Expecting numeric in D27546 / R27546C4: got 'n.a.'
## Warning: Expecting numeric in D27547 / R27547C4: got 'n.a.'
## Warning: Expecting numeric in D27548 / R27548C4: got 'n.a.'
## Warning: Expecting numeric in D27549 / R27549C4: got 'n.a.'
## Warning: Expecting numeric in D27550 / R27550C4: got 'n.a.'
## Warning: Expecting numeric in D27551 / R27551C4: got 'n.a.'
## Warning: Expecting numeric in D27552 / R27552C4: got 'n.a.'
## Warning: Expecting numeric in D27553 / R27553C4: got 'n.a.'
## Warning: Expecting numeric in D27554 / R27554C4: got 'n.a.'
## Warning: Expecting numeric in D27555 / R27555C4: got 'n.a.'
## Warning: Expecting numeric in D27556 / R27556C4: got 'n.a.'
## Warning: Expecting numeric in D27557 / R27557C4: got 'n.a.'
## Warning: Expecting numeric in D27558 / R27558C4: got 'n.a.'
## Warning: Expecting numeric in D27559 / R27559C4: got 'n.a.'
## Warning: Expecting numeric in D27560 / R27560C4: got 'n.a.'
## Warning: Expecting numeric in D27561 / R27561C4: got 'n.a.'
## Warning: Expecting numeric in D27562 / R27562C4: got 'n.a.'
## Warning: Expecting numeric in D27563 / R27563C4: got 'n.a.'
## Warning: Expecting numeric in D27564 / R27564C4: got 'n.a.'
## Warning: Expecting numeric in D27565 / R27565C4: got 'n.a.'
## Warning: Expecting numeric in D27566 / R27566C4: got 'n.a.'
## Warning: Expecting numeric in D27567 / R27567C4: got 'n.a.'
## Warning: Expecting numeric in D27568 / R27568C4: got 'n.a.'
## Warning: Expecting numeric in D27569 / R27569C4: got 'n.a.'
## Warning: Expecting numeric in D27570 / R27570C4: got 'n.a.'
## Warning: Expecting numeric in D27571 / R27571C4: got 'n.a.'
## Warning: Expecting numeric in D27572 / R27572C4: got 'n.a.'
## Warning: Expecting numeric in D27573 / R27573C4: got 'n.a.'
## Warning: Expecting numeric in D27574 / R27574C4: got 'n.a.'
## Warning: Expecting numeric in D27575 / R27575C4: got 'n.a.'
## Warning: Expecting numeric in D27576 / R27576C4: got 'n.a.'
## Warning: Expecting numeric in D27577 / R27577C4: got 'n.a.'
## Warning: Expecting numeric in D27578 / R27578C4: got 'n.a.'
## Warning: Expecting numeric in D27579 / R27579C4: got 'n.a.'
## Warning: Expecting numeric in D27580 / R27580C4: got 'n.a.'
## Warning: Expecting numeric in D27581 / R27581C4: got 'n.a.'
## Warning: Expecting numeric in D27582 / R27582C4: got 'n.a.'
## Warning: Expecting numeric in D27583 / R27583C4: got 'n.a.'
## Warning: Expecting numeric in D27584 / R27584C4: got 'n.a.'
## Warning: Expecting numeric in D27585 / R27585C4: got 'n.a.'
## Warning: Expecting numeric in D27586 / R27586C4: got 'n.a.'
## Warning: Expecting numeric in D27587 / R27587C4: got 'n.a.'
## Warning: Expecting numeric in D27588 / R27588C4: got 'n.a.'
## Warning: Expecting numeric in D27589 / R27589C4: got 'n.a.'
## Warning: Expecting numeric in D27590 / R27590C4: got 'n.a.'
## Warning: Expecting numeric in D27591 / R27591C4: got 'n.a.'
## Warning: Expecting numeric in D27592 / R27592C4: got 'n.a.'
## Warning: Expecting numeric in D27593 / R27593C4: got 'n.a.'
## Warning: Expecting numeric in D27594 / R27594C4: got 'n.a.'
## Warning: Expecting numeric in D27595 / R27595C4: got 'n.a.'
## Warning: Expecting numeric in D27596 / R27596C4: got 'n.a.'
## Warning: Expecting numeric in D27597 / R27597C4: got 'n.a.'
## Warning: Expecting numeric in D27598 / R27598C4: got 'n.a.'
## Warning: Expecting numeric in D27599 / R27599C4: got 'n.a.'
## Warning: Expecting numeric in D27600 / R27600C4: got 'n.a.'
## Warning: Expecting numeric in D27601 / R27601C4: got 'n.a.'
## Warning: Expecting numeric in D27602 / R27602C4: got 'n.a.'
## Warning: Expecting numeric in D27603 / R27603C4: got 'n.a.'
## Warning: Expecting numeric in D27604 / R27604C4: got 'n.a.'
## Warning: Expecting numeric in D27605 / R27605C4: got 'n.a.'
## Warning: Expecting numeric in D27606 / R27606C4: got 'n.a.'
## Warning: Expecting numeric in D27607 / R27607C4: got 'n.a.'
## Warning: Expecting numeric in D27608 / R27608C4: got 'n.a.'
## Warning: Expecting numeric in D27609 / R27609C4: got 'n.a.'
## Warning: Expecting numeric in D27610 / R27610C4: got 'n.a.'
## Warning: Expecting numeric in D27611 / R27611C4: got 'n.a.'
## Warning: Expecting numeric in D27612 / R27612C4: got 'n.a.'
## Warning: Expecting numeric in D27613 / R27613C4: got 'n.a.'
## Warning: Expecting numeric in D27614 / R27614C4: got 'n.a.'
## Warning: Expecting numeric in D27615 / R27615C4: got 'n.a.'
## Warning: Expecting numeric in D27616 / R27616C4: got 'n.a.'
## Warning: Expecting numeric in D27617 / R27617C4: got 'n.a.'
## Warning: Expecting numeric in D27618 / R27618C4: got 'n.a.'
## Warning: Expecting numeric in D27619 / R27619C4: got 'n.a.'
## Warning: Expecting numeric in D27620 / R27620C4: got 'n.a.'
## Warning: Expecting numeric in D27621 / R27621C4: got 'n.a.'
## Warning: Expecting numeric in D27622 / R27622C4: got 'n.a.'
## Warning: Expecting numeric in D27623 / R27623C4: got 'n.a.'
## Warning: Expecting numeric in D27624 / R27624C4: got 'n.a.'
## Warning: Expecting numeric in D27625 / R27625C4: got 'n.a.'
## Warning: Expecting numeric in D27626 / R27626C4: got 'n.a.'
## Warning: Expecting numeric in D27627 / R27627C4: got 'n.a.'
## Warning: Expecting numeric in D27628 / R27628C4: got 'n.a.'
## Warning: Expecting numeric in D27629 / R27629C4: got 'n.a.'
## Warning: Expecting numeric in D27630 / R27630C4: got 'n.a.'
## Warning: Expecting numeric in D27631 / R27631C4: got 'n.a.'
## Warning: Expecting numeric in D27632 / R27632C4: got 'n.a.'
## Warning: Expecting numeric in D27633 / R27633C4: got 'n.a.'
## Warning: Expecting numeric in D27634 / R27634C4: got 'n.a.'
## Warning: Expecting numeric in D27635 / R27635C4: got 'n.a.'
## Warning: Expecting numeric in D27636 / R27636C4: got 'n.a.'
## Warning: Expecting numeric in D27637 / R27637C4: got 'n.a.'
## Warning: Expecting numeric in D27638 / R27638C4: got 'n.a.'
## Warning: Expecting numeric in D27639 / R27639C4: got 'n.a.'
## Warning: Expecting numeric in D27640 / R27640C4: got 'n.a.'
## Warning: Expecting numeric in D27641 / R27641C4: got 'n.a.'
## Warning: Expecting numeric in D27642 / R27642C4: got 'n.a.'
## Warning: Expecting numeric in D27643 / R27643C4: got 'n.a.'
## Warning: Expecting numeric in D27644 / R27644C4: got 'n.a.'
## Warning: Expecting numeric in D27645 / R27645C4: got 'n.a.'
## Warning: Expecting numeric in D27646 / R27646C4: got 'n.a.'
## Warning: Expecting numeric in D27647 / R27647C4: got 'n.a.'
## Warning: Expecting numeric in D27648 / R27648C4: got 'n.a.'
## Warning: Expecting numeric in D27649 / R27649C4: got 'n.a.'
## Warning: Expecting numeric in D27650 / R27650C4: got 'n.a.'
## Warning: Expecting numeric in D27651 / R27651C4: got 'n.a.'
## Warning: Expecting numeric in D27652 / R27652C4: got 'n.a.'
## Warning: Expecting numeric in D27653 / R27653C4: got 'n.a.'
## Warning: Expecting numeric in D27654 / R27654C4: got 'n.a.'
## Warning: Expecting numeric in D27655 / R27655C4: got 'n.a.'
## Warning: Expecting numeric in D27656 / R27656C4: got 'n.a.'
## Warning: Expecting numeric in D27657 / R27657C4: got 'n.a.'
## Warning: Expecting numeric in D27658 / R27658C4: got 'n.a.'
## Warning: Expecting numeric in D27659 / R27659C4: got 'n.a.'
## Warning: Expecting numeric in D27660 / R27660C4: got 'n.a.'
## Warning: Expecting numeric in D27661 / R27661C4: got 'n.a.'
## Warning: Expecting numeric in D27662 / R27662C4: got 'n.a.'
## Warning: Expecting numeric in D27663 / R27663C4: got 'n.a.'
## Warning: Expecting numeric in D27664 / R27664C4: got 'n.a.'
## Warning: Expecting numeric in D27665 / R27665C4: got 'n.a.'
## Warning: Expecting numeric in D27666 / R27666C4: got 'n.a.'
## Warning: Expecting numeric in D27667 / R27667C4: got 'n.a.'
## Warning: Expecting numeric in D27668 / R27668C4: got 'n.a.'
## Warning: Expecting numeric in D27669 / R27669C4: got 'n.a.'
## Warning: Expecting numeric in D27670 / R27670C4: got 'n.a.'
## Warning: Expecting numeric in D27671 / R27671C4: got 'n.a.'
## Warning: Expecting numeric in D27672 / R27672C4: got 'n.a.'
## Warning: Expecting numeric in D27673 / R27673C4: got 'n.a.'
## Warning: Expecting numeric in D27674 / R27674C4: got 'n.a.'
## Warning: Expecting numeric in D27675 / R27675C4: got 'n.a.'
## Warning: Expecting numeric in D27676 / R27676C4: got 'n.a.'
## Warning: Expecting numeric in D27677 / R27677C4: got 'n.a.'
## Warning: Expecting numeric in D27678 / R27678C4: got 'n.a.'
## Warning: Expecting numeric in D27679 / R27679C4: got 'n.a.'
## Warning: Expecting numeric in D27680 / R27680C4: got 'n.a.'
## Warning: Expecting numeric in D27681 / R27681C4: got 'n.a.'
## Warning: Expecting numeric in D27682 / R27682C4: got 'n.a.'
## Warning: Expecting numeric in D27683 / R27683C4: got 'n.a.'
## Warning: Expecting numeric in D27684 / R27684C4: got 'n.a.'
## Warning: Expecting numeric in D27685 / R27685C4: got 'n.a.'
## Warning: Expecting numeric in D27686 / R27686C4: got 'n.a.'
## Warning: Expecting numeric in D27687 / R27687C4: got 'n.a.'
## Warning: Expecting numeric in D27688 / R27688C4: got 'n.a.'
## Warning: Expecting numeric in D27689 / R27689C4: got 'n.a.'
## Warning: Expecting numeric in D27690 / R27690C4: got 'n.a.'
## Warning: Expecting numeric in D27691 / R27691C4: got 'n.a.'
## Warning: Expecting numeric in D27692 / R27692C4: got 'n.a.'
## Warning: Expecting numeric in D27693 / R27693C4: got 'n.a.'
## Warning: Expecting numeric in D27694 / R27694C4: got 'n.a.'
## Warning: Expecting numeric in D27695 / R27695C4: got 'n.a.'
## Warning: Expecting numeric in D27696 / R27696C4: got 'n.a.'
## Warning: Expecting numeric in D27697 / R27697C4: got 'n.a.'
## Warning: Expecting numeric in D27698 / R27698C4: got 'n.a.'
## Warning: Expecting numeric in D27699 / R27699C4: got 'n.a.'
## Warning: Expecting numeric in D27700 / R27700C4: got 'n.a.'
## Warning: Expecting numeric in D27701 / R27701C4: got 'n.a.'
## Warning: Expecting numeric in D27702 / R27702C4: got 'n.a.'
## Warning: Expecting numeric in D27703 / R27703C4: got 'n.a.'
## Warning: Expecting numeric in D27704 / R27704C4: got 'n.a.'
## Warning: Expecting numeric in D27705 / R27705C4: got 'n.a.'
## Warning: Expecting numeric in D27706 / R27706C4: got 'n.a.'
## Warning: Expecting numeric in D27707 / R27707C4: got 'n.a.'
## Warning: Expecting numeric in D27708 / R27708C4: got 'n.a.'
## Warning: Expecting numeric in D27709 / R27709C4: got 'n.a.'
## Warning: Expecting numeric in D27710 / R27710C4: got 'n.a.'
## Warning: Expecting numeric in D27711 / R27711C4: got 'n.a.'
## Warning: Expecting numeric in D27712 / R27712C4: got 'n.a.'
## Warning: Expecting numeric in D27713 / R27713C4: got 'n.a.'
## Warning: Expecting numeric in D27714 / R27714C4: got 'n.a.'
## Warning: Expecting numeric in D27715 / R27715C4: got 'n.a.'
## Warning: Expecting numeric in D27716 / R27716C4: got 'n.a.'
## Warning: Expecting numeric in D27717 / R27717C4: got 'n.a.'
## Warning: Expecting numeric in D27718 / R27718C4: got 'n.a.'
## Warning: Expecting numeric in D27719 / R27719C4: got 'n.a.'
## Warning: Expecting numeric in D27720 / R27720C4: got 'n.a.'
## Warning: Expecting numeric in D27721 / R27721C4: got 'n.a.'
## Warning: Expecting numeric in D27722 / R27722C4: got 'n.a.'
## Warning: Expecting numeric in D27723 / R27723C4: got 'n.a.'
## Warning: Expecting numeric in D27724 / R27724C4: got 'n.a.'
## Warning: Expecting numeric in D27725 / R27725C4: got 'n.a.'
## Warning: Expecting numeric in D27726 / R27726C4: got 'n.a.'
## Warning: Expecting numeric in D27727 / R27727C4: got 'n.a.'
## Warning: Expecting numeric in D27728 / R27728C4: got 'n.a.'
## Warning: Expecting numeric in D27729 / R27729C4: got 'n.a.'
## Warning: Expecting numeric in D27730 / R27730C4: got 'n.a.'
## Warning: Expecting numeric in D27731 / R27731C4: got 'n.a.'
## Warning: Expecting numeric in D27732 / R27732C4: got 'n.a.'
## Warning: Expecting numeric in D27733 / R27733C4: got 'n.a.'
## Warning: Expecting numeric in D27734 / R27734C4: got 'n.a.'
## Warning: Expecting numeric in D27735 / R27735C4: got 'n.a.'
## Warning: Expecting numeric in D27736 / R27736C4: got 'n.a.'
## Warning: Expecting numeric in D27737 / R27737C4: got 'n.a.'
## Warning: Expecting numeric in D27738 / R27738C4: got 'n.a.'
## Warning: Expecting numeric in D27739 / R27739C4: got 'n.a.'
## Warning: Expecting numeric in D27740 / R27740C4: got 'n.a.'
## Warning: Expecting numeric in D27741 / R27741C4: got 'n.a.'
## Warning: Expecting numeric in D27742 / R27742C4: got 'n.a.'
## Warning: Expecting numeric in D27743 / R27743C4: got 'n.a.'
## Warning: Expecting numeric in D27744 / R27744C4: got 'n.a.'
## Warning: Expecting numeric in D27745 / R27745C4: got 'n.a.'
## Warning: Expecting numeric in D27746 / R27746C4: got 'n.a.'
## Warning: Expecting numeric in D27747 / R27747C4: got 'n.a.'
## Warning: Expecting numeric in D27748 / R27748C4: got 'n.a.'
## Warning: Expecting numeric in D27749 / R27749C4: got 'n.a.'
## Warning: Expecting numeric in D27750 / R27750C4: got 'n.a.'
## Warning: Expecting numeric in D27751 / R27751C4: got 'n.a.'
## Warning: Expecting numeric in D27752 / R27752C4: got 'n.a.'
## Warning: Expecting numeric in D27753 / R27753C4: got 'n.a.'
## Warning: Expecting numeric in D27754 / R27754C4: got 'n.a.'
## Warning: Expecting numeric in D27755 / R27755C4: got 'n.a.'
## Warning: Expecting numeric in D27756 / R27756C4: got 'n.a.'
## Warning: Expecting numeric in D27757 / R27757C4: got 'n.a.'
## Warning: Expecting numeric in D27758 / R27758C4: got 'n.a.'
## Warning: Expecting numeric in D27759 / R27759C4: got 'n.a.'
## Warning: Expecting numeric in D27760 / R27760C4: got 'n.a.'
## Warning: Expecting numeric in D27761 / R27761C4: got 'n.a.'
## Warning: Expecting numeric in D27762 / R27762C4: got 'n.a.'
## Warning: Expecting numeric in D27763 / R27763C4: got 'n.a.'
## Warning: Expecting numeric in D27764 / R27764C4: got 'n.a.'
## Warning: Expecting numeric in D27765 / R27765C4: got 'n.a.'
## Warning: Expecting numeric in D27766 / R27766C4: got 'n.a.'
## Warning: Expecting numeric in D27767 / R27767C4: got 'n.a.'
## Warning: Expecting numeric in D27768 / R27768C4: got 'n.a.'
## Warning: Expecting numeric in D27769 / R27769C4: got 'n.a.'
## Warning: Expecting numeric in D27770 / R27770C4: got 'n.a.'
## Warning: Expecting numeric in D27771 / R27771C4: got 'n.a.'
## Warning: Expecting numeric in D27772 / R27772C4: got 'n.a.'
## Warning: Expecting numeric in D27773 / R27773C4: got 'n.a.'
## Warning: Expecting numeric in D27774 / R27774C4: got 'n.a.'
## Warning: Expecting numeric in D27775 / R27775C4: got 'n.a.'
## Warning: Expecting numeric in D27776 / R27776C4: got 'n.a.'
## Warning: Expecting numeric in D27777 / R27777C4: got 'n.a.'
## Warning: Expecting numeric in D27778 / R27778C4: got 'n.a.'
## Warning: Expecting numeric in D27779 / R27779C4: got 'n.a.'
## Warning: Expecting numeric in D27780 / R27780C4: got 'n.a.'
## Warning: Expecting numeric in D27781 / R27781C4: got 'n.a.'
## Warning: Expecting numeric in D27782 / R27782C4: got 'n.a.'
## Warning: Expecting numeric in D27783 / R27783C4: got 'n.a.'
## Warning: Expecting numeric in D27784 / R27784C4: got 'n.a.'
## Warning: Expecting numeric in D27785 / R27785C4: got 'n.a.'
## Warning: Expecting numeric in D27786 / R27786C4: got 'n.a.'
## Warning: Expecting numeric in D27787 / R27787C4: got 'n.a.'
## Warning: Expecting numeric in D27788 / R27788C4: got 'n.a.'
## Warning: Expecting numeric in D27789 / R27789C4: got 'n.a.'
## Warning: Expecting numeric in D27790 / R27790C4: got 'n.a.'
## Warning: Expecting numeric in D27791 / R27791C4: got 'n.a.'
## Warning: Expecting numeric in D27792 / R27792C4: got 'n.a.'
## Warning: Expecting numeric in D27793 / R27793C4: got 'n.a.'
## Warning: Expecting numeric in D27794 / R27794C4: got 'n.a.'
## Warning: Expecting numeric in D27795 / R27795C4: got 'n.a.'
## Warning: Expecting numeric in D27796 / R27796C4: got 'n.a.'
## Warning: Expecting numeric in D27797 / R27797C4: got 'n.a.'
## Warning: Expecting numeric in D27798 / R27798C4: got 'n.a.'
## Warning: Expecting numeric in D27799 / R27799C4: got 'n.a.'
## Warning: Expecting numeric in D27800 / R27800C4: got 'n.a.'
## Warning: Expecting numeric in D27801 / R27801C4: got 'n.a.'
## Warning: Expecting numeric in D27802 / R27802C4: got 'n.a.'
## Warning: Expecting numeric in D27803 / R27803C4: got 'n.a.'
## Warning: Expecting numeric in D27804 / R27804C4: got 'n.a.'
## Warning: Expecting numeric in D27805 / R27805C4: got 'n.a.'
## Warning: Expecting numeric in D27806 / R27806C4: got 'n.a.'
## Warning: Expecting numeric in D27807 / R27807C4: got 'n.a.'
## Warning: Expecting numeric in D27808 / R27808C4: got 'n.a.'
## Warning: Expecting numeric in D27809 / R27809C4: got 'n.a.'
## Warning: Expecting numeric in D27810 / R27810C4: got 'n.a.'
## Warning: Expecting numeric in D27811 / R27811C4: got 'n.a.'
## Warning: Expecting numeric in D27812 / R27812C4: got 'n.a.'
## Warning: Expecting numeric in D27813 / R27813C4: got 'n.a.'
## Warning: Expecting numeric in D27814 / R27814C4: got 'n.a.'
## Warning: Expecting numeric in D27815 / R27815C4: got 'n.a.'
## Warning: Expecting numeric in D27816 / R27816C4: got 'n.a.'
## Warning: Expecting numeric in D27817 / R27817C4: got 'n.a.'
## Warning: Expecting numeric in D27818 / R27818C4: got 'n.a.'
## Warning: Expecting numeric in D27819 / R27819C4: got 'n.a.'
## Warning: Expecting numeric in D27820 / R27820C4: got 'n.a.'
## Warning: Expecting numeric in D27821 / R27821C4: got 'n.a.'
## Warning: Expecting numeric in D27822 / R27822C4: got 'n.a.'
## Warning: Expecting numeric in D27823 / R27823C4: got 'n.a.'
## Warning: Expecting numeric in D27824 / R27824C4: got 'n.a.'
## Warning: Expecting numeric in D27825 / R27825C4: got 'n.a.'
## Warning: Expecting numeric in D27826 / R27826C4: got 'n.a.'
## Warning: Expecting numeric in D27827 / R27827C4: got 'n.a.'
## Warning: Expecting numeric in D27828 / R27828C4: got 'n.a.'
## Warning: Expecting numeric in D27829 / R27829C4: got 'n.a.'
## Warning: Expecting numeric in D27830 / R27830C4: got 'n.a.'
## Warning: Expecting numeric in D27831 / R27831C4: got 'n.a.'
## Warning: Expecting numeric in D27832 / R27832C4: got 'n.a.'
## Warning: Expecting numeric in D27833 / R27833C4: got 'n.a.'
## Warning: Expecting numeric in D27834 / R27834C4: got 'n.a.'
## Warning: Expecting numeric in D27835 / R27835C4: got 'n.a.'
## Warning: Expecting numeric in D27836 / R27836C4: got 'n.a.'
## Warning: Expecting numeric in D27837 / R27837C4: got 'n.a.'
## Warning: Expecting numeric in D27838 / R27838C4: got 'n.a.'
## Warning: Expecting numeric in D27839 / R27839C4: got 'n.a.'
## Warning: Expecting numeric in D27840 / R27840C4: got 'n.a.'
## Warning: Expecting numeric in D27841 / R27841C4: got 'n.a.'
## Warning: Expecting numeric in D27842 / R27842C4: got 'n.a.'
## Warning: Expecting numeric in D27843 / R27843C4: got 'n.a.'
## Warning: Expecting numeric in D27844 / R27844C4: got 'n.a.'
## Warning: Expecting numeric in D27845 / R27845C4: got 'n.a.'
## Warning: Expecting numeric in D27846 / R27846C4: got 'n.a.'
## Warning: Expecting numeric in D27847 / R27847C4: got 'n.a.'
## Warning: Expecting numeric in D27848 / R27848C4: got 'n.a.'
## Warning: Expecting numeric in D27849 / R27849C4: got 'n.a.'
## Warning: Expecting numeric in D27850 / R27850C4: got 'n.a.'
## Warning: Expecting numeric in D27851 / R27851C4: got 'n.a.'
## Warning: Expecting numeric in D27852 / R27852C4: got 'n.a.'
## Warning: Expecting numeric in D27853 / R27853C4: got 'n.a.'
## Warning: Expecting numeric in D27854 / R27854C4: got 'n.a.'
## Warning: Expecting numeric in D27855 / R27855C4: got 'n.a.'
## Warning: Expecting numeric in D27856 / R27856C4: got 'n.a.'
## Warning: Expecting numeric in D27857 / R27857C4: got 'n.a.'
## Warning: Expecting numeric in D27858 / R27858C4: got 'n.a.'
## Warning: Expecting numeric in D27859 / R27859C4: got 'n.a.'
## Warning: Expecting numeric in D27860 / R27860C4: got 'n.a.'
## Warning: Expecting numeric in D27861 / R27861C4: got 'n.a.'
## Warning: Expecting numeric in D27862 / R27862C4: got 'n.a.'
## Warning: Expecting numeric in D27863 / R27863C4: got 'n.a.'
## Warning: Expecting numeric in D27864 / R27864C4: got 'n.a.'
## Warning: Expecting numeric in D27865 / R27865C4: got 'n.a.'
## Warning: Expecting numeric in D27866 / R27866C4: got 'n.a.'
## Warning: Expecting numeric in D27867 / R27867C4: got 'n.a.'
## Warning: Expecting numeric in D27868 / R27868C4: got 'n.a.'
## Warning: Expecting numeric in D27869 / R27869C4: got 'n.a.'
## Warning: Expecting numeric in D27870 / R27870C4: got 'n.a.'
## Warning: Expecting numeric in D27871 / R27871C4: got 'n.a.'
## Warning: Expecting numeric in D27872 / R27872C4: got 'n.a.'
## Warning: Expecting numeric in D27873 / R27873C4: got 'n.a.'
## Warning: Expecting numeric in D27874 / R27874C4: got 'n.a.'
## Warning: Expecting numeric in D27875 / R27875C4: got 'n.a.'
## Warning: Expecting numeric in D27876 / R27876C4: got 'n.a.'
## Warning: Expecting numeric in D27877 / R27877C4: got 'n.a.'
## Warning: Expecting numeric in D27878 / R27878C4: got 'n.a.'
## Warning: Expecting numeric in D27879 / R27879C4: got 'n.a.'
## Warning: Expecting numeric in D27880 / R27880C4: got 'n.a.'
## Warning: Expecting numeric in D27881 / R27881C4: got 'n.a.'
## Warning: Expecting numeric in D27882 / R27882C4: got 'n.a.'
## Warning: Expecting numeric in D27883 / R27883C4: got 'n.a.'
## Warning: Expecting numeric in D27884 / R27884C4: got 'n.a.'
## Warning: Expecting numeric in D27885 / R27885C4: got 'n.a.'
## Warning: Expecting numeric in D27886 / R27886C4: got 'n.a.'
## Warning: Expecting numeric in D27887 / R27887C4: got 'n.a.'
## Warning: Expecting numeric in D27888 / R27888C4: got 'n.a.'
## Warning: Expecting numeric in D27889 / R27889C4: got 'n.a.'
## Warning: Expecting numeric in D27890 / R27890C4: got 'n.a.'
## Warning: Expecting numeric in D27891 / R27891C4: got 'n.a.'
## Warning: Expecting numeric in D27892 / R27892C4: got 'n.a.'
## Warning: Expecting numeric in D27893 / R27893C4: got 'n.a.'
## Warning: Expecting numeric in D27894 / R27894C4: got 'n.a.'
## Warning: Expecting numeric in D27895 / R27895C4: got 'n.a.'
## Warning: Expecting numeric in D27896 / R27896C4: got 'n.a.'
## Warning: Expecting numeric in D27897 / R27897C4: got 'n.a.'
## Warning: Expecting numeric in D27898 / R27898C4: got 'n.a.'
## Warning: Expecting numeric in D27899 / R27899C4: got 'n.a.'
## Warning: Expecting numeric in D27900 / R27900C4: got 'n.a.'
## Warning: Expecting numeric in D27901 / R27901C4: got 'n.a.'
## Warning: Expecting numeric in D27902 / R27902C4: got 'n.a.'
## Warning: Expecting numeric in D27903 / R27903C4: got 'n.a.'
## Warning: Expecting numeric in D27904 / R27904C4: got 'n.a.'
## Warning: Expecting numeric in D27905 / R27905C4: got 'n.a.'
## Warning: Expecting numeric in D27906 / R27906C4: got 'n.a.'
## Warning: Expecting numeric in D27907 / R27907C4: got 'n.a.'
## Warning: Expecting numeric in D27908 / R27908C4: got 'n.a.'
## Warning: Expecting numeric in D27909 / R27909C4: got 'n.a.'
## Warning: Expecting numeric in D27910 / R27910C4: got 'n.a.'
## Warning: Expecting numeric in D27911 / R27911C4: got 'n.a.'
## Warning: Expecting numeric in D27912 / R27912C4: got 'n.a.'
## Warning: Expecting numeric in D27913 / R27913C4: got 'n.a.'
## Warning: Expecting numeric in D27914 / R27914C4: got 'n.a.'
## Warning: Expecting numeric in D27915 / R27915C4: got 'n.a.'
## Warning: Expecting numeric in D27916 / R27916C4: got 'n.a.'
## Warning: Expecting numeric in D27917 / R27917C4: got 'n.a.'
## Warning: Expecting numeric in D27918 / R27918C4: got 'n.a.'
## Warning: Expecting numeric in D27919 / R27919C4: got 'n.a.'
## Warning: Expecting numeric in D27920 / R27920C4: got 'n.a.'
## Warning: Expecting numeric in D27921 / R27921C4: got 'n.a.'
## Warning: Expecting numeric in D27922 / R27922C4: got 'n.a.'
## Warning: Expecting numeric in D27923 / R27923C4: got 'n.a.'
## Warning: Expecting numeric in D27924 / R27924C4: got 'n.a.'
## Warning: Expecting numeric in D27925 / R27925C4: got 'n.a.'
## Warning: Expecting numeric in D27926 / R27926C4: got 'n.a.'
## Warning: Expecting numeric in D27927 / R27927C4: got 'n.a.'
## Warning: Expecting numeric in D27928 / R27928C4: got 'n.a.'
## Warning: Expecting numeric in D27929 / R27929C4: got 'n.a.'
## Warning: Expecting numeric in D27930 / R27930C4: got 'n.a.'
## Warning: Expecting numeric in D27931 / R27931C4: got 'n.a.'
## Warning: Expecting numeric in D27932 / R27932C4: got 'n.a.'
## Warning: Expecting numeric in D27933 / R27933C4: got 'n.a.'
## Warning: Expecting numeric in D27934 / R27934C4: got 'n.a.'
## Warning: Expecting numeric in D27935 / R27935C4: got 'n.a.'
## Warning: Expecting numeric in D27936 / R27936C4: got 'n.a.'
## Warning: Expecting numeric in D27937 / R27937C4: got 'n.a.'
## Warning: Expecting numeric in D27938 / R27938C4: got 'n.a.'
## Warning: Expecting numeric in D27939 / R27939C4: got 'n.a.'
## Warning: Expecting numeric in D27940 / R27940C4: got 'n.a.'
## Warning: Expecting numeric in D27941 / R27941C4: got 'n.a.'
## Warning: Expecting numeric in D27942 / R27942C4: got 'n.a.'
## Warning: Expecting numeric in D27943 / R27943C4: got 'n.a.'
## Warning: Expecting numeric in D27944 / R27944C4: got 'n.a.'
## Warning: Expecting numeric in D27945 / R27945C4: got 'n.a.'
## Warning: Expecting numeric in D27946 / R27946C4: got 'n.a.'
## Warning: Expecting numeric in D27947 / R27947C4: got 'n.a.'
## Warning: Expecting numeric in D27948 / R27948C4: got 'n.a.'
## Warning: Expecting numeric in D27949 / R27949C4: got 'n.a.'
## Warning: Expecting numeric in D27950 / R27950C4: got 'n.a.'
## Warning: Expecting numeric in D27951 / R27951C4: got 'n.a.'
## Warning: Expecting numeric in D27952 / R27952C4: got 'n.a.'
## Warning: Expecting numeric in D27953 / R27953C4: got 'n.a.'
## Warning: Expecting numeric in D27954 / R27954C4: got 'n.a.'
## Warning: Expecting numeric in D27955 / R27955C4: got 'n.a.'
## Warning: Expecting numeric in D27956 / R27956C4: got 'n.a.'
## Warning: Expecting numeric in D27957 / R27957C4: got 'n.a.'
## Warning: Expecting numeric in D27958 / R27958C4: got 'n.a.'
## Warning: Expecting numeric in D27959 / R27959C4: got 'n.a.'
## Warning: Expecting numeric in D27960 / R27960C4: got 'n.a.'
## Warning: Expecting numeric in D27961 / R27961C4: got 'n.a.'
## Warning: Expecting numeric in D27962 / R27962C4: got 'n.a.'
## Warning: Expecting numeric in D27963 / R27963C4: got 'n.a.'
## Warning: Expecting numeric in D27964 / R27964C4: got 'n.a.'
## Warning: Expecting numeric in D27965 / R27965C4: got 'n.a.'
## Warning: Expecting numeric in D27966 / R27966C4: got 'n.a.'
## Warning: Expecting numeric in D27967 / R27967C4: got 'n.a.'
## Warning: Expecting numeric in D27968 / R27968C4: got 'n.a.'
## Warning: Expecting numeric in D27969 / R27969C4: got 'n.a.'
## Warning: Expecting numeric in D27970 / R27970C4: got 'n.a.'
## Warning: Expecting numeric in D27971 / R27971C4: got 'n.a.'
## Warning: Expecting numeric in D27972 / R27972C4: got 'n.a.'
## Warning: Expecting numeric in D27973 / R27973C4: got 'n.a.'
## Warning: Expecting numeric in D27974 / R27974C4: got 'n.a.'
## Warning: Expecting numeric in D27975 / R27975C4: got 'n.a.'
## Warning: Expecting numeric in D27976 / R27976C4: got 'n.a.'
## Warning: Expecting numeric in D27977 / R27977C4: got 'n.a.'
## Warning: Expecting numeric in D27978 / R27978C4: got 'n.a.'
## Warning: Expecting numeric in D27979 / R27979C4: got 'n.a.'
## Warning: Expecting numeric in D27980 / R27980C4: got 'n.a.'
## Warning: Expecting numeric in D27981 / R27981C4: got 'n.a.'
## Warning: Expecting numeric in D27982 / R27982C4: got 'n.a.'
## Warning: Expecting numeric in D27983 / R27983C4: got 'n.a.'
## Warning: Expecting numeric in D27984 / R27984C4: got 'n.a.'
## Warning: Expecting numeric in D27985 / R27985C4: got 'n.a.'
## Warning: Expecting numeric in D27986 / R27986C4: got 'n.a.'
## Warning: Expecting numeric in D27987 / R27987C4: got 'n.a.'
## Warning: Expecting numeric in D27988 / R27988C4: got 'n.a.'
## Warning: Expecting numeric in D27989 / R27989C4: got 'n.a.'
## Warning: Expecting numeric in D27990 / R27990C4: got 'n.a.'
## Warning: Expecting numeric in D27991 / R27991C4: got 'n.a.'
## Warning: Expecting numeric in D27992 / R27992C4: got 'n.a.'
## Warning: Expecting numeric in D27993 / R27993C4: got 'n.a.'
## Warning: Expecting numeric in D27994 / R27994C4: got 'n.a.'
## Warning: Expecting numeric in D27995 / R27995C4: got 'n.a.'
## Warning: Expecting numeric in D27996 / R27996C4: got 'n.a.'
## Warning: Expecting numeric in D27997 / R27997C4: got 'n.a.'
## Warning: Expecting numeric in D27998 / R27998C4: got 'n.a.'
## Warning: Expecting numeric in D27999 / R27999C4: got 'n.a.'
## Warning: Expecting numeric in D28000 / R28000C4: got 'n.a.'
## Warning: Expecting numeric in D28001 / R28001C4: got 'n.a.'
## Warning: Expecting numeric in D28002 / R28002C4: got 'n.a.'
## Warning: Expecting numeric in D28003 / R28003C4: got 'n.a.'
## Warning: Expecting numeric in D28004 / R28004C4: got 'n.a.'
## Warning: Expecting numeric in D28005 / R28005C4: got 'n.a.'
## Warning: Expecting numeric in D28006 / R28006C4: got 'n.a.'
## Warning: Expecting numeric in D28007 / R28007C4: got 'n.a.'
## Warning: Expecting numeric in D28008 / R28008C4: got 'n.a.'
## Warning: Expecting numeric in D28009 / R28009C4: got 'n.a.'
## Warning: Expecting numeric in D28010 / R28010C4: got 'n.a.'
## Warning: Expecting numeric in D28011 / R28011C4: got 'n.a.'
## Warning: Expecting numeric in D28012 / R28012C4: got 'n.a.'
## Warning: Expecting numeric in D28013 / R28013C4: got 'n.a.'
## Warning: Expecting numeric in D28014 / R28014C4: got 'n.a.'
## Warning: Expecting numeric in D28015 / R28015C4: got 'n.a.'
## Warning: Expecting numeric in D28016 / R28016C4: got 'n.a.'
## Warning: Expecting numeric in D28017 / R28017C4: got 'n.a.'
## Warning: Expecting numeric in D28018 / R28018C4: got 'n.a.'
## Warning: Expecting numeric in D28019 / R28019C4: got 'n.a.'
## Warning: Expecting numeric in D28020 / R28020C4: got 'n.a.'
## Warning: Expecting numeric in D28021 / R28021C4: got 'n.a.'
## Warning: Expecting numeric in D28022 / R28022C4: got 'n.a.'
## Warning: Expecting numeric in D28023 / R28023C4: got 'n.a.'
## Warning: Expecting numeric in D28024 / R28024C4: got 'n.a.'
## Warning: Expecting numeric in D28025 / R28025C4: got 'n.a.'
## Warning: Expecting numeric in D28026 / R28026C4: got 'n.a.'
## Warning: Expecting numeric in D28027 / R28027C4: got 'n.a.'
## Warning: Expecting numeric in D28028 / R28028C4: got 'n.a.'
## Warning: Expecting numeric in D28029 / R28029C4: got 'n.a.'
## Warning: Expecting numeric in D28030 / R28030C4: got 'n.a.'
## Warning: Expecting numeric in D28031 / R28031C4: got 'n.a.'
## Warning: Expecting numeric in D28032 / R28032C4: got 'n.a.'
## Warning: Expecting numeric in D28033 / R28033C4: got 'n.a.'
## Warning: Expecting numeric in D28034 / R28034C4: got 'n.a.'
## Warning: Expecting numeric in D28035 / R28035C4: got 'n.a.'
## Warning: Expecting numeric in D28036 / R28036C4: got 'n.a.'
## Warning: Expecting numeric in D28037 / R28037C4: got 'n.a.'
## Warning: Expecting numeric in D28038 / R28038C4: got 'n.a.'
## Warning: Expecting numeric in D28039 / R28039C4: got 'n.a.'
## Warning: Expecting numeric in D28040 / R28040C4: got 'n.a.'
## Warning: Expecting numeric in D28041 / R28041C4: got 'n.a.'
## Warning: Expecting numeric in D28042 / R28042C4: got 'n.a.'
## Warning: Expecting numeric in D28043 / R28043C4: got 'n.a.'
## Warning: Expecting numeric in D28044 / R28044C4: got 'n.a.'
## Warning: Expecting numeric in D28045 / R28045C4: got 'n.a.'
## Warning: Expecting numeric in D28046 / R28046C4: got 'n.a.'
## Warning: Expecting numeric in D28047 / R28047C4: got 'n.a.'
## Warning: Expecting numeric in D28048 / R28048C4: got 'n.a.'
## Warning: Expecting numeric in D28049 / R28049C4: got 'n.a.'
## Warning: Expecting numeric in D28050 / R28050C4: got 'n.a.'
## Warning: Expecting numeric in D28051 / R28051C4: got 'n.a.'
## Warning: Expecting numeric in D28052 / R28052C4: got 'n.a.'
## Warning: Expecting numeric in D28053 / R28053C4: got 'n.a.'
## Warning: Expecting numeric in D28054 / R28054C4: got 'n.a.'
## Warning: Expecting numeric in D28055 / R28055C4: got 'n.a.'
## Warning: Expecting numeric in D28056 / R28056C4: got 'n.a.'
## Warning: Expecting numeric in D28057 / R28057C4: got 'n.a.'
## Warning: Expecting numeric in D28058 / R28058C4: got 'n.a.'
## Warning: Expecting numeric in D28059 / R28059C4: got 'n.a.'
## Warning: Expecting numeric in D28060 / R28060C4: got 'n.a.'
## Warning: Expecting numeric in D28061 / R28061C4: got 'n.a.'
## Warning: Expecting numeric in D28062 / R28062C4: got 'n.a.'
## Warning: Expecting numeric in D28063 / R28063C4: got 'n.a.'
## Warning: Expecting numeric in D28064 / R28064C4: got 'n.a.'
## Warning: Expecting numeric in D28065 / R28065C4: got 'n.a.'
## Warning: Expecting numeric in D28066 / R28066C4: got 'n.a.'
## Warning: Expecting numeric in D28067 / R28067C4: got 'n.a.'
## Warning: Expecting numeric in D28068 / R28068C4: got 'n.a.'
## Warning: Expecting numeric in D28069 / R28069C4: got 'n.a.'
## Warning: Expecting numeric in D28070 / R28070C4: got 'n.a.'
## Warning: Expecting numeric in D28071 / R28071C4: got 'n.a.'
## Warning: Expecting numeric in D28072 / R28072C4: got 'n.a.'
## Warning: Expecting numeric in D28073 / R28073C4: got 'n.a.'
## Warning: Expecting numeric in D28074 / R28074C4: got 'n.a.'
## Warning: Expecting numeric in D28075 / R28075C4: got 'n.a.'
## Warning: Expecting numeric in D28076 / R28076C4: got 'n.a.'
## Warning: Expecting numeric in D28077 / R28077C4: got 'n.a.'
## Warning: Expecting numeric in D28078 / R28078C4: got 'n.a.'
## Warning: Expecting numeric in D28079 / R28079C4: got 'n.a.'
## Warning: Expecting numeric in D28080 / R28080C4: got 'n.a.'
## Warning: Expecting numeric in D28081 / R28081C4: got 'n.a.'
## Warning: Expecting numeric in D28082 / R28082C4: got 'n.a.'
## Warning: Expecting numeric in D28083 / R28083C4: got 'n.a.'
## Warning: Expecting numeric in D28084 / R28084C4: got 'n.a.'
## Warning: Expecting numeric in D28085 / R28085C4: got 'n.a.'
## Warning: Expecting numeric in D28086 / R28086C4: got 'n.a.'
## Warning: Expecting numeric in D28087 / R28087C4: got 'n.a.'
## Warning: Expecting numeric in D28088 / R28088C4: got 'n.a.'
## Warning: Expecting numeric in D28089 / R28089C4: got 'n.a.'
## Warning: Expecting numeric in D28090 / R28090C4: got 'n.a.'
## Warning: Expecting numeric in D28091 / R28091C4: got 'n.a.'
## Warning: Expecting numeric in D28092 / R28092C4: got 'n.a.'
## Warning: Expecting numeric in D28093 / R28093C4: got 'n.a.'
## Warning: Expecting numeric in D28094 / R28094C4: got 'n.a.'
## Warning: Expecting numeric in D28095 / R28095C4: got 'n.a.'
## Warning: Expecting numeric in D28096 / R28096C4: got 'n.a.'
## Warning: Expecting numeric in D28097 / R28097C4: got 'n.a.'
## Warning: Expecting numeric in D28098 / R28098C4: got 'n.a.'
## Warning: Expecting numeric in D28099 / R28099C4: got 'n.a.'
## Warning: Expecting numeric in D28100 / R28100C4: got 'n.a.'
## Warning: Expecting numeric in D28101 / R28101C4: got 'n.a.'
## Warning: Expecting numeric in D28102 / R28102C4: got 'n.a.'
## Warning: Expecting numeric in D28103 / R28103C4: got 'n.a.'
## Warning: Expecting numeric in D28104 / R28104C4: got 'n.a.'
## Warning: Expecting numeric in D28105 / R28105C4: got 'n.a.'
## Warning: Expecting numeric in D28106 / R28106C4: got 'n.a.'
## Warning: Expecting numeric in D28107 / R28107C4: got 'n.a.'
## Warning: Expecting numeric in D28108 / R28108C4: got 'n.a.'
## Warning: Expecting numeric in D28109 / R28109C4: got 'n.a.'
## Warning: Expecting numeric in D28110 / R28110C4: got 'n.a.'
## Warning: Expecting numeric in D28111 / R28111C4: got 'n.a.'
## Warning: Expecting numeric in D28112 / R28112C4: got 'n.a.'
## Warning: Expecting numeric in D28113 / R28113C4: got 'n.a.'
## Warning: Expecting numeric in D28114 / R28114C4: got 'n.a.'
## Warning: Expecting numeric in D28115 / R28115C4: got 'n.a.'
## Warning: Expecting numeric in D28116 / R28116C4: got 'n.a.'
## Warning: Expecting numeric in D28117 / R28117C4: got 'n.a.'
## Warning: Expecting numeric in D28118 / R28118C4: got 'n.a.'
## Warning: Expecting numeric in D28119 / R28119C4: got 'n.a.'
## Warning: Expecting numeric in D28120 / R28120C4: got 'n.a.'
## Warning: Expecting numeric in D28121 / R28121C4: got 'n.a.'
## Warning: Expecting numeric in D28122 / R28122C4: got 'n.a.'
## Warning: Expecting numeric in D28123 / R28123C4: got 'n.a.'
## Warning: Expecting numeric in D28124 / R28124C4: got 'n.a.'
## Warning: Expecting numeric in D28125 / R28125C4: got 'n.a.'
## Warning: Expecting numeric in D28126 / R28126C4: got 'n.a.'
## Warning: Expecting numeric in D28127 / R28127C4: got 'n.a.'
## Warning: Expecting numeric in D28128 / R28128C4: got 'n.a.'
## Warning: Expecting numeric in D28129 / R28129C4: got 'n.a.'
## Warning: Expecting numeric in D28130 / R28130C4: got 'n.a.'
## Warning: Expecting numeric in D28131 / R28131C4: got 'n.a.'
## Warning: Expecting numeric in D28132 / R28132C4: got 'n.a.'
## Warning: Expecting numeric in D28133 / R28133C4: got 'n.a.'
## Warning: Expecting numeric in D28134 / R28134C4: got 'n.a.'
## Warning: Expecting numeric in D28135 / R28135C4: got 'n.a.'
## Warning: Expecting numeric in D28136 / R28136C4: got 'n.a.'
## Warning: Expecting numeric in D28137 / R28137C4: got 'n.a.'
## Warning: Expecting numeric in D28138 / R28138C4: got 'n.a.'
## Warning: Expecting numeric in D28139 / R28139C4: got 'n.a.'
## Warning: Expecting numeric in D28140 / R28140C4: got 'n.a.'
## Warning: Expecting numeric in D28141 / R28141C4: got 'n.a.'
## Warning: Expecting numeric in D28142 / R28142C4: got 'n.a.'
## Warning: Expecting numeric in D28143 / R28143C4: got 'n.a.'
## Warning: Expecting numeric in D28144 / R28144C4: got 'n.a.'
## Warning: Expecting numeric in D28145 / R28145C4: got 'n.a.'
## Warning: Expecting numeric in D28146 / R28146C4: got 'n.a.'
## Warning: Expecting numeric in D28147 / R28147C4: got 'n.a.'
## Warning: Expecting numeric in D28148 / R28148C4: got 'n.a.'
## Warning: Expecting numeric in D28149 / R28149C4: got 'n.a.'
## Warning: Expecting numeric in D28150 / R28150C4: got 'n.a.'
## Warning: Expecting numeric in D28151 / R28151C4: got 'n.a.'
## Warning: Expecting numeric in D28152 / R28152C4: got 'n.a.'
## Warning: Expecting numeric in D28153 / R28153C4: got 'n.a.'
## Warning: Expecting numeric in D28154 / R28154C4: got 'n.a.'
## Warning: Expecting numeric in D28155 / R28155C4: got 'n.a.'
## Warning: Expecting numeric in D28156 / R28156C4: got 'n.a.'
## Warning: Expecting numeric in D28157 / R28157C4: got 'n.a.'
## Warning: Expecting numeric in D28158 / R28158C4: got 'n.a.'
## Warning: Expecting numeric in D28159 / R28159C4: got 'n.a.'
## Warning: Expecting numeric in D28160 / R28160C4: got 'n.a.'
## Warning: Expecting numeric in D28161 / R28161C4: got 'n.a.'
## Warning: Expecting numeric in D28162 / R28162C4: got 'n.a.'
## Warning: Expecting numeric in D28163 / R28163C4: got 'n.a.'
## Warning: Expecting numeric in D28164 / R28164C4: got 'n.a.'
## Warning: Expecting numeric in D28165 / R28165C4: got 'n.a.'
## Warning: Expecting numeric in D28166 / R28166C4: got 'n.a.'
## Warning: Expecting numeric in D28167 / R28167C4: got 'n.a.'
## Warning: Expecting numeric in D28168 / R28168C4: got 'n.a.'
## Warning: Expecting numeric in D28169 / R28169C4: got 'n.a.'
## Warning: Expecting numeric in D28170 / R28170C4: got 'n.a.'
## Warning: Expecting numeric in D28171 / R28171C4: got 'n.a.'
## Warning: Expecting numeric in D28172 / R28172C4: got 'n.a.'
## Warning: Expecting numeric in D28173 / R28173C4: got 'n.a.'
## Warning: Expecting numeric in D28174 / R28174C4: got 'n.a.'
## Warning: Expecting numeric in D28175 / R28175C4: got 'n.a.'
## Warning: Expecting numeric in D28176 / R28176C4: got 'n.a.'
## Warning: Expecting numeric in D28177 / R28177C4: got 'n.a.'
## Warning: Expecting numeric in D28178 / R28178C4: got 'n.a.'
## Warning: Expecting numeric in D28179 / R28179C4: got 'n.a.'
## Warning: Expecting numeric in D28180 / R28180C4: got 'n.a.'
## Warning: Expecting numeric in D28181 / R28181C4: got 'n.a.'
## Warning: Expecting numeric in D28182 / R28182C4: got 'n.a.'
## Warning: Expecting numeric in D28183 / R28183C4: got 'n.a.'
## Warning: Expecting numeric in D28184 / R28184C4: got 'n.a.'
## Warning: Expecting numeric in D28185 / R28185C4: got 'n.a.'
## Warning: Expecting numeric in D28186 / R28186C4: got 'n.a.'
## Warning: Expecting numeric in D28187 / R28187C4: got 'n.a.'
## Warning: Expecting numeric in D28188 / R28188C4: got 'n.a.'
## Warning: Expecting numeric in D28189 / R28189C4: got 'n.a.'
## Warning: Expecting numeric in D28190 / R28190C4: got 'n.a.'
## Warning: Expecting numeric in D28191 / R28191C4: got 'n.a.'
## Warning: Expecting numeric in D28192 / R28192C4: got 'n.a.'
## Warning: Expecting numeric in D28193 / R28193C4: got 'n.a.'
## Warning: Expecting numeric in D28194 / R28194C4: got 'n.a.'
## Warning: Expecting numeric in D28195 / R28195C4: got 'n.a.'
## Warning: Expecting numeric in D28196 / R28196C4: got 'n.a.'
## Warning: Expecting numeric in D28197 / R28197C4: got 'n.a.'
## Warning: Expecting numeric in D28198 / R28198C4: got 'n.a.'
## Warning: Expecting numeric in D28199 / R28199C4: got 'n.a.'
## Warning: Expecting numeric in D28200 / R28200C4: got 'n.a.'
## Warning: Expecting numeric in D28201 / R28201C4: got 'n.a.'
## Warning: Expecting numeric in D28202 / R28202C4: got 'n.a.'
## Warning: Expecting numeric in D28203 / R28203C4: got 'n.a.'
## Warning: Expecting numeric in D28204 / R28204C4: got 'n.a.'
## Warning: Expecting numeric in D28205 / R28205C4: got 'n.a.'
## Warning: Expecting numeric in D28206 / R28206C4: got 'n.a.'
## Warning: Expecting numeric in D28207 / R28207C4: got 'n.a.'
## Warning: Expecting numeric in D28208 / R28208C4: got 'n.a.'
## Warning: Expecting numeric in D28209 / R28209C4: got 'n.a.'
## Warning: Expecting numeric in D28210 / R28210C4: got 'n.a.'
## Warning: Expecting numeric in D28211 / R28211C4: got 'n.a.'
## Warning: Expecting numeric in D28212 / R28212C4: got 'n.a.'
## Warning: Expecting numeric in D28213 / R28213C4: got 'n.a.'
## Warning: Expecting numeric in D28214 / R28214C4: got 'n.a.'
## Warning: Expecting numeric in D28215 / R28215C4: got 'n.a.'
## Warning: Expecting numeric in D28216 / R28216C4: got 'n.a.'
## Warning: Expecting numeric in D28217 / R28217C4: got 'n.a.'
## Warning: Expecting numeric in D28218 / R28218C4: got 'n.a.'
## Warning: Expecting numeric in D28219 / R28219C4: got 'n.a.'
## Warning: Expecting numeric in D28220 / R28220C4: got 'n.a.'
## Warning: Expecting numeric in D28221 / R28221C4: got 'n.a.'
## Warning: Expecting numeric in D28222 / R28222C4: got 'n.a.'
## Warning: Expecting numeric in D28223 / R28223C4: got 'n.a.'
## Warning: Expecting numeric in D28224 / R28224C4: got 'n.a.'
## Warning: Expecting numeric in D28225 / R28225C4: got 'n.a.'
## Warning: Expecting numeric in D28226 / R28226C4: got 'n.a.'
## Warning: Expecting numeric in D28227 / R28227C4: got 'n.a.'
## Warning: Expecting numeric in D28228 / R28228C4: got 'n.a.'
## Warning: Expecting numeric in D28229 / R28229C4: got 'n.a.'
## Warning: Expecting numeric in D28230 / R28230C4: got 'n.a.'
## Warning: Expecting numeric in D28231 / R28231C4: got 'n.a.'
## Warning: Expecting numeric in D28232 / R28232C4: got 'n.a.'
## Warning: Expecting numeric in D28233 / R28233C4: got 'n.a.'
## Warning: Expecting numeric in D28234 / R28234C4: got 'n.a.'
## Warning: Expecting numeric in D28235 / R28235C4: got 'n.a.'
## Warning: Expecting numeric in D28236 / R28236C4: got 'n.a.'
## Warning: Expecting numeric in D28237 / R28237C4: got 'n.a.'
## Warning: Expecting numeric in D28238 / R28238C4: got 'n.a.'
## Warning: Expecting numeric in D28239 / R28239C4: got 'n.a.'
## Warning: Expecting numeric in D28240 / R28240C4: got 'n.a.'
## Warning: Expecting numeric in D28241 / R28241C4: got 'n.a.'
## Warning: Expecting numeric in D28242 / R28242C4: got 'n.a.'
## Warning: Expecting numeric in D28243 / R28243C4: got 'n.a.'
## Warning: Expecting numeric in D28244 / R28244C4: got 'n.a.'
## Warning: Expecting numeric in D28245 / R28245C4: got 'n.a.'
## Warning: Expecting numeric in D28246 / R28246C4: got 'n.a.'
## Warning: Expecting numeric in D28247 / R28247C4: got 'n.a.'
## Warning: Expecting numeric in D28248 / R28248C4: got 'n.a.'
## Warning: Expecting numeric in D28249 / R28249C4: got 'n.a.'
## Warning: Expecting numeric in D28250 / R28250C4: got 'n.a.'
## Warning: Expecting numeric in D28251 / R28251C4: got 'n.a.'
## Warning: Expecting numeric in D28252 / R28252C4: got 'n.a.'
## Warning: Expecting numeric in D28253 / R28253C4: got 'n.a.'
## Warning: Expecting numeric in D28254 / R28254C4: got 'n.a.'
## Warning: Expecting numeric in D28255 / R28255C4: got 'n.a.'
## Warning: Expecting numeric in D28256 / R28256C4: got 'n.a.'
## Warning: Expecting numeric in D28257 / R28257C4: got 'n.a.'
## Warning: Expecting numeric in D28258 / R28258C4: got 'n.a.'
## Warning: Expecting numeric in D28259 / R28259C4: got 'n.a.'
## Warning: Expecting numeric in D28260 / R28260C4: got 'n.a.'
## Warning: Expecting numeric in D28261 / R28261C4: got 'n.a.'
## Warning: Expecting numeric in D28262 / R28262C4: got 'n.a.'
## Warning: Expecting numeric in D28263 / R28263C4: got 'n.a.'
## Warning: Expecting numeric in D28264 / R28264C4: got 'n.a.'
## Warning: Expecting numeric in D28265 / R28265C4: got 'n.a.'
## Warning: Expecting numeric in D28266 / R28266C4: got 'n.a.'
## Warning: Expecting numeric in D28267 / R28267C4: got 'n.a.'
## Warning: Expecting numeric in D28268 / R28268C4: got 'n.a.'
## Warning: Expecting numeric in D28269 / R28269C4: got 'n.a.'
## Warning: Expecting numeric in D28270 / R28270C4: got 'n.a.'
## Warning: Expecting numeric in D28271 / R28271C4: got 'n.a.'
## Warning: Expecting numeric in D28272 / R28272C4: got 'n.a.'
## Warning: Expecting numeric in D28273 / R28273C4: got 'n.a.'
## Warning: Expecting numeric in D28274 / R28274C4: got 'n.a.'
## Warning: Expecting numeric in D28275 / R28275C4: got 'n.a.'
## Warning: Expecting numeric in D28276 / R28276C4: got 'n.a.'
## Warning: Expecting numeric in D28277 / R28277C4: got 'n.a.'
## Warning: Expecting numeric in D28278 / R28278C4: got 'n.a.'
## Warning: Expecting numeric in D28279 / R28279C4: got 'n.a.'
## Warning: Expecting numeric in D28280 / R28280C4: got 'n.a.'
## Warning: Expecting numeric in D28281 / R28281C4: got 'n.a.'
## Warning: Expecting numeric in D28282 / R28282C4: got 'n.a.'
## Warning: Expecting numeric in D28283 / R28283C4: got 'n.a.'
## Warning: Expecting numeric in D28284 / R28284C4: got 'n.a.'
## Warning: Expecting numeric in D28285 / R28285C4: got 'n.a.'
## Warning: Expecting numeric in D28286 / R28286C4: got 'n.a.'
## Warning: Expecting numeric in D28287 / R28287C4: got 'n.a.'
## Warning: Expecting numeric in D28288 / R28288C4: got 'n.a.'
## Warning: Expecting numeric in D28289 / R28289C4: got 'n.a.'
## Warning: Expecting numeric in D28290 / R28290C4: got 'n.a.'
## Warning: Expecting numeric in D28291 / R28291C4: got 'n.a.'
## Warning: Expecting numeric in D28292 / R28292C4: got 'n.a.'
## Warning: Expecting numeric in D28293 / R28293C4: got 'n.a.'
## Warning: Expecting numeric in D28294 / R28294C4: got 'n.a.'
## Warning: Expecting numeric in D28295 / R28295C4: got 'n.a.'
## Warning: Expecting numeric in D28296 / R28296C4: got 'n.a.'
## Warning: Expecting numeric in D28297 / R28297C4: got 'n.a.'
## Warning: Expecting numeric in D28298 / R28298C4: got 'n.a.'
## Warning: Expecting numeric in D28299 / R28299C4: got 'n.a.'
## Warning: Expecting numeric in D28300 / R28300C4: got 'n.a.'
## Warning: Expecting numeric in D28301 / R28301C4: got 'n.a.'
## Warning: Expecting numeric in D28302 / R28302C4: got 'n.a.'
## Warning: Expecting numeric in D28303 / R28303C4: got 'n.a.'
## Warning: Expecting numeric in D28304 / R28304C4: got 'n.a.'
## Warning: Expecting numeric in D28305 / R28305C4: got 'n.a.'
## Warning: Expecting numeric in D28306 / R28306C4: got 'n.a.'
## Warning: Expecting numeric in D28307 / R28307C4: got 'n.a.'
## Warning: Expecting numeric in D28308 / R28308C4: got 'n.a.'
## Warning: Expecting numeric in D28309 / R28309C4: got 'n.a.'
## Warning: Expecting numeric in D28310 / R28310C4: got 'n.a.'
## Warning: Expecting numeric in D28311 / R28311C4: got 'n.a.'
## Warning: Expecting numeric in D28312 / R28312C4: got 'n.a.'
## Warning: Expecting numeric in D28313 / R28313C4: got 'n.a.'
## Warning: Expecting numeric in D28314 / R28314C4: got 'n.a.'
## Warning: Expecting numeric in D28315 / R28315C4: got 'n.a.'
## Warning: Expecting numeric in D28316 / R28316C4: got 'n.a.'
## Warning: Expecting numeric in D28317 / R28317C4: got 'n.a.'
## Warning: Expecting numeric in D28318 / R28318C4: got 'n.a.'
## Warning: Expecting numeric in D28319 / R28319C4: got 'n.a.'
## Warning: Expecting numeric in D28320 / R28320C4: got 'n.a.'
## Warning: Expecting numeric in D28321 / R28321C4: got 'n.a.'
## Warning: Expecting numeric in D28322 / R28322C4: got 'n.a.'
## Warning: Expecting numeric in D28323 / R28323C4: got 'n.a.'
## Warning: Expecting numeric in D28324 / R28324C4: got 'n.a.'
## Warning: Expecting numeric in D28325 / R28325C4: got 'n.a.'
## Warning: Expecting numeric in D28326 / R28326C4: got 'n.a.'
## Warning: Expecting numeric in D28327 / R28327C4: got 'n.a.'
## Warning: Expecting numeric in D28328 / R28328C4: got 'n.a.'
## Warning: Expecting numeric in D28329 / R28329C4: got 'n.a.'
## Warning: Expecting numeric in D28330 / R28330C4: got 'n.a.'
## Warning: Expecting numeric in D28331 / R28331C4: got 'n.a.'
## Warning: Expecting numeric in D28332 / R28332C4: got 'n.a.'
## Warning: Expecting numeric in D28333 / R28333C4: got 'n.a.'
## Warning: Expecting numeric in D28334 / R28334C4: got 'n.a.'
## Warning: Expecting numeric in D28335 / R28335C4: got 'n.a.'
## Warning: Expecting numeric in D28336 / R28336C4: got 'n.a.'
## Warning: Expecting numeric in D28337 / R28337C4: got 'n.a.'
## Warning: Expecting numeric in D28338 / R28338C4: got 'n.a.'
## Warning: Expecting numeric in D28339 / R28339C4: got 'n.a.'
## Warning: Expecting numeric in D28340 / R28340C4: got 'n.a.'
## Warning: Expecting numeric in D28341 / R28341C4: got 'n.a.'
## Warning: Expecting numeric in D28342 / R28342C4: got 'n.a.'
## Warning: Expecting numeric in D28343 / R28343C4: got 'n.a.'
## Warning: Expecting numeric in D28344 / R28344C4: got 'n.a.'
## Warning: Expecting numeric in D28345 / R28345C4: got 'n.a.'
## Warning: Expecting numeric in D28346 / R28346C4: got 'n.a.'
## Warning: Expecting numeric in D28347 / R28347C4: got 'n.a.'
## Warning: Expecting numeric in D28348 / R28348C4: got 'n.a.'
## Warning: Expecting numeric in D28349 / R28349C4: got 'n.a.'
## Warning: Expecting numeric in D28350 / R28350C4: got 'n.a.'
## Warning: Expecting numeric in D28351 / R28351C4: got 'n.a.'
## Warning: Expecting numeric in D28352 / R28352C4: got 'n.a.'
## Warning: Expecting numeric in D28353 / R28353C4: got 'n.a.'
## Warning: Expecting numeric in D28354 / R28354C4: got 'n.a.'
## Warning: Expecting numeric in D28355 / R28355C4: got 'n.a.'
## Warning: Expecting numeric in D28356 / R28356C4: got 'n.a.'
## Warning: Expecting numeric in D28357 / R28357C4: got 'n.a.'
## Warning: Expecting numeric in D28358 / R28358C4: got 'n.a.'
## Warning: Expecting numeric in D28359 / R28359C4: got 'n.a.'
## Warning: Expecting numeric in D28360 / R28360C4: got 'n.a.'
## Warning: Expecting numeric in D28361 / R28361C4: got 'n.a.'
## Warning: Expecting numeric in D28362 / R28362C4: got 'n.a.'
## Warning: Expecting numeric in D28363 / R28363C4: got 'n.a.'
## Warning: Expecting numeric in D28364 / R28364C4: got 'n.a.'
## Warning: Expecting numeric in D28365 / R28365C4: got 'n.a.'
## Warning: Expecting numeric in D28366 / R28366C4: got 'n.a.'
## Warning: Expecting numeric in D28367 / R28367C4: got 'n.a.'
## Warning: Expecting numeric in D28368 / R28368C4: got 'n.a.'
## Warning: Expecting numeric in D28369 / R28369C4: got 'n.a.'
## Warning: Expecting numeric in D28370 / R28370C4: got 'n.a.'
## Warning: Expecting numeric in D28371 / R28371C4: got 'n.a.'
## Warning: Expecting numeric in D28372 / R28372C4: got 'n.a.'
## Warning: Expecting numeric in D28373 / R28373C4: got 'n.a.'
## Warning: Expecting numeric in D28374 / R28374C4: got 'n.a.'
## Warning: Expecting numeric in D28375 / R28375C4: got 'n.a.'
## Warning: Expecting numeric in D28376 / R28376C4: got 'n.a.'
## Warning: Expecting numeric in D28377 / R28377C4: got 'n.a.'
## Warning: Expecting numeric in D28378 / R28378C4: got 'n.a.'
## Warning: Expecting numeric in D28379 / R28379C4: got 'n.a.'
## Warning: Expecting numeric in D28380 / R28380C4: got 'n.a.'
## Warning: Expecting numeric in D28381 / R28381C4: got 'n.a.'
## Warning: Expecting numeric in D28382 / R28382C4: got 'n.a.'
## Warning: Expecting numeric in D28383 / R28383C4: got 'n.a.'
## Warning: Expecting numeric in D28384 / R28384C4: got 'n.a.'
## Warning: Expecting numeric in D28385 / R28385C4: got 'n.a.'
## Warning: Expecting numeric in D28386 / R28386C4: got 'n.a.'
## Warning: Expecting numeric in D28387 / R28387C4: got 'n.a.'
## Warning: Expecting numeric in D28388 / R28388C4: got 'n.a.'
## Warning: Expecting numeric in D28389 / R28389C4: got 'n.a.'
## Warning: Expecting numeric in D28390 / R28390C4: got 'n.a.'
## Warning: Expecting numeric in D28391 / R28391C4: got 'n.a.'
## Warning: Expecting numeric in D28392 / R28392C4: got 'n.a.'
## Warning: Expecting numeric in D28393 / R28393C4: got 'n.a.'
## Warning: Expecting numeric in D28394 / R28394C4: got 'n.a.'
## Warning: Expecting numeric in D28395 / R28395C4: got 'n.a.'
## Warning: Expecting numeric in D28396 / R28396C4: got 'n.a.'
## Warning: Expecting numeric in D28397 / R28397C4: got 'n.a.'
## Warning: Expecting numeric in D28398 / R28398C4: got 'n.a.'
## Warning: Expecting numeric in D28399 / R28399C4: got 'n.a.'
## Warning: Expecting numeric in D28400 / R28400C4: got 'n.a.'
## Warning: Expecting numeric in D28401 / R28401C4: got 'n.a.'
## Warning: Expecting numeric in D28402 / R28402C4: got 'n.a.'
## Warning: Expecting numeric in D28403 / R28403C4: got 'n.a.'
## Warning: Expecting numeric in D28404 / R28404C4: got 'n.a.'
## Warning: Expecting numeric in D28405 / R28405C4: got 'n.a.'
## Warning: Expecting numeric in D28406 / R28406C4: got 'n.a.'
## Warning: Expecting numeric in D28407 / R28407C4: got 'n.a.'
## Warning: Expecting numeric in D28408 / R28408C4: got 'n.a.'
## Warning: Expecting numeric in D28409 / R28409C4: got 'n.a.'
## Warning: Expecting numeric in D28410 / R28410C4: got 'n.a.'
## Warning: Expecting numeric in D28411 / R28411C4: got 'n.a.'
## Warning: Expecting numeric in D28412 / R28412C4: got 'n.a.'
## Warning: Expecting numeric in D28413 / R28413C4: got 'n.a.'
## Warning: Expecting numeric in D28414 / R28414C4: got 'n.a.'
## Warning: Expecting numeric in D28415 / R28415C4: got 'n.a.'
## Warning: Expecting numeric in D28416 / R28416C4: got 'n.a.'
## Warning: Expecting numeric in D28417 / R28417C4: got 'n.a.'
## Warning: Expecting numeric in D28418 / R28418C4: got 'n.a.'
## Warning: Expecting numeric in D28419 / R28419C4: got 'n.a.'
## Warning: Expecting numeric in D28420 / R28420C4: got 'n.a.'
## Warning: Expecting numeric in D28421 / R28421C4: got 'n.a.'
## Warning: Expecting numeric in D28422 / R28422C4: got 'n.a.'
## Warning: Expecting numeric in D28423 / R28423C4: got 'n.a.'
## Warning: Expecting numeric in D28424 / R28424C4: got 'n.a.'
## Warning: Expecting numeric in D28425 / R28425C4: got 'n.a.'
## Warning: Expecting numeric in D28426 / R28426C4: got 'n.a.'
## Warning: Expecting numeric in D28427 / R28427C4: got 'n.a.'
## Warning: Expecting numeric in D28428 / R28428C4: got 'n.a.'
## Warning: Expecting numeric in D28429 / R28429C4: got 'n.a.'
## Warning: Expecting numeric in D28430 / R28430C4: got 'n.a.'
## Warning: Expecting numeric in D28431 / R28431C4: got 'n.a.'
## Warning: Expecting numeric in D28432 / R28432C4: got 'n.a.'
## Warning: Expecting numeric in D28433 / R28433C4: got 'n.a.'
## Warning: Expecting numeric in D28434 / R28434C4: got 'n.a.'
## Warning: Expecting numeric in D28435 / R28435C4: got 'n.a.'
## Warning: Expecting numeric in D28436 / R28436C4: got 'n.a.'
## Warning: Expecting numeric in D28437 / R28437C4: got 'n.a.'
## Warning: Expecting numeric in D28438 / R28438C4: got 'n.a.'
## Warning: Expecting numeric in D28439 / R28439C4: got 'n.a.'
## Warning: Expecting numeric in D28440 / R28440C4: got 'n.a.'
## Warning: Expecting numeric in D28441 / R28441C4: got 'n.a.'
## Warning: Expecting numeric in D28442 / R28442C4: got 'n.a.'
## Warning: Expecting numeric in D28443 / R28443C4: got 'n.a.'
## Warning: Expecting numeric in D28444 / R28444C4: got 'n.a.'
## Warning: Expecting numeric in D28445 / R28445C4: got 'n.a.'
## Warning: Expecting numeric in D28446 / R28446C4: got 'n.a.'
## Warning: Expecting numeric in D28447 / R28447C4: got 'n.a.'
## Warning: Expecting numeric in D28448 / R28448C4: got 'n.a.'
## Warning: Expecting numeric in D28449 / R28449C4: got 'n.a.'
## Warning: Expecting numeric in D28450 / R28450C4: got 'n.a.'
## Warning: Expecting numeric in D28451 / R28451C4: got 'n.a.'
## Warning: Expecting numeric in D28452 / R28452C4: got 'n.a.'
## Warning: Expecting numeric in D28453 / R28453C4: got 'n.a.'
## Warning: Expecting numeric in D28454 / R28454C4: got 'n.a.'
## Warning: Expecting numeric in D28455 / R28455C4: got 'n.a.'
## Warning: Expecting numeric in D28456 / R28456C4: got 'n.a.'
## Warning: Expecting numeric in D28457 / R28457C4: got 'n.a.'
## Warning: Expecting numeric in D28458 / R28458C4: got 'n.a.'
## Warning: Expecting numeric in D28459 / R28459C4: got 'n.a.'
## Warning: Expecting numeric in D28460 / R28460C4: got 'n.a.'
## Warning: Expecting numeric in D28461 / R28461C4: got 'n.a.'
## Warning: Expecting numeric in D28462 / R28462C4: got 'n.a.'
## Warning: Expecting numeric in D28463 / R28463C4: got 'n.a.'
## Warning: Expecting numeric in D28464 / R28464C4: got 'n.a.'
## Warning: Expecting numeric in D28465 / R28465C4: got 'n.a.'
## Warning: Expecting numeric in D28466 / R28466C4: got 'n.a.'
## Warning: Expecting numeric in D28467 / R28467C4: got 'n.a.'
## Warning: Expecting numeric in D28468 / R28468C4: got 'n.a.'
## Warning: Expecting numeric in D28469 / R28469C4: got 'n.a.'
## Warning: Expecting numeric in D28470 / R28470C4: got 'n.a.'
## Warning: Expecting numeric in D28471 / R28471C4: got 'n.a.'
## Warning: Expecting numeric in D28472 / R28472C4: got 'n.a.'
## Warning: Expecting numeric in D28473 / R28473C4: got 'n.a.'
## Warning: Expecting numeric in D28474 / R28474C4: got 'n.a.'
## Warning: Expecting numeric in D28475 / R28475C4: got 'n.a.'
## Warning: Expecting numeric in D28476 / R28476C4: got 'n.a.'
## Warning: Expecting numeric in D28477 / R28477C4: got 'n.a.'
## Warning: Expecting numeric in D28478 / R28478C4: got 'n.a.'
## Warning: Expecting numeric in D28479 / R28479C4: got 'n.a.'
## Warning: Expecting numeric in D28480 / R28480C4: got 'n.a.'
## Warning: Expecting numeric in D28481 / R28481C4: got 'n.a.'
## Warning: Expecting numeric in D28482 / R28482C4: got 'n.a.'
## Warning: Expecting numeric in D28483 / R28483C4: got 'n.a.'
## Warning: Expecting numeric in D28484 / R28484C4: got 'n.a.'
## Warning: Expecting numeric in D28485 / R28485C4: got 'n.a.'
## Warning: Expecting numeric in D28486 / R28486C4: got 'n.a.'
## Warning: Expecting numeric in D28487 / R28487C4: got 'n.a.'
## Warning: Expecting numeric in D28488 / R28488C4: got 'n.a.'
## Warning: Expecting numeric in D28489 / R28489C4: got 'n.a.'
## Warning: Expecting numeric in D28490 / R28490C4: got 'n.a.'
## Warning: Expecting numeric in D28491 / R28491C4: got 'n.a.'
## Warning: Expecting numeric in D28492 / R28492C4: got 'n.a.'
## Warning: Expecting numeric in D28493 / R28493C4: got 'n.a.'
## Warning: Expecting numeric in D28494 / R28494C4: got 'n.a.'
## Warning: Expecting numeric in D28495 / R28495C4: got 'n.a.'
## Warning: Expecting numeric in D28496 / R28496C4: got 'n.a.'
## Warning: Expecting numeric in D28497 / R28497C4: got 'n.a.'
## Warning: Expecting numeric in D28498 / R28498C4: got 'n.a.'
## Warning: Expecting numeric in D28499 / R28499C4: got 'n.a.'
## Warning: Expecting numeric in D28500 / R28500C4: got 'n.a.'
## Warning: Expecting numeric in D28501 / R28501C4: got 'n.a.'
## Warning: Expecting numeric in D28502 / R28502C4: got 'n.a.'
## Warning: Expecting numeric in D28503 / R28503C4: got 'n.a.'
## Warning: Expecting numeric in D28504 / R28504C4: got 'n.a.'
## Warning: Expecting numeric in D28505 / R28505C4: got 'n.a.'
## Warning: Expecting numeric in D28506 / R28506C4: got 'n.a.'
## Warning: Expecting numeric in D28507 / R28507C4: got 'n.a.'
## Warning: Expecting numeric in D28508 / R28508C4: got 'n.a.'
## Warning: Expecting numeric in D28509 / R28509C4: got 'n.a.'
## Warning: Expecting numeric in D28510 / R28510C4: got 'n.a.'
## Warning: Expecting numeric in D28511 / R28511C4: got 'n.a.'
## Warning: Expecting numeric in D28512 / R28512C4: got 'n.a.'
## Warning: Expecting numeric in D28513 / R28513C4: got 'n.a.'
## Warning: Expecting numeric in D28514 / R28514C4: got 'n.a.'
## Warning: Expecting numeric in D28515 / R28515C4: got 'n.a.'
## Warning: Expecting numeric in D28516 / R28516C4: got 'n.a.'
## Warning: Expecting numeric in D28517 / R28517C4: got 'n.a.'
## Warning: Expecting numeric in D28518 / R28518C4: got 'n.a.'
## Warning: Expecting numeric in D28519 / R28519C4: got 'n.a.'
## Warning: Expecting numeric in D28520 / R28520C4: got 'n.a.'
## Warning: Expecting numeric in D28521 / R28521C4: got 'n.a.'
## Warning: Expecting numeric in D28522 / R28522C4: got 'n.a.'
## Warning: Expecting numeric in D28523 / R28523C4: got 'n.a.'
## Warning: Expecting numeric in D28524 / R28524C4: got 'n.a.'
## Warning: Expecting numeric in D28525 / R28525C4: got 'n.a.'
## Warning: Expecting numeric in D28526 / R28526C4: got 'n.a.'
## Warning: Expecting numeric in D28527 / R28527C4: got 'n.a.'
## Warning: Expecting numeric in D28528 / R28528C4: got 'n.a.'
## Warning: Expecting numeric in D28529 / R28529C4: got 'n.a.'
## Warning: Expecting numeric in D28530 / R28530C4: got 'n.a.'
## Warning: Expecting numeric in D28531 / R28531C4: got 'n.a.'
## Warning: Expecting numeric in D28532 / R28532C4: got 'n.a.'
## Warning: Expecting numeric in D28533 / R28533C4: got 'n.a.'
## Warning: Expecting numeric in D28534 / R28534C4: got 'n.a.'
## Warning: Expecting numeric in D28535 / R28535C4: got 'n.a.'
## Warning: Expecting numeric in D28536 / R28536C4: got 'n.a.'
## Warning: Expecting numeric in D28537 / R28537C4: got 'n.a.'
## Warning: Expecting numeric in D28538 / R28538C4: got 'n.a.'
## Warning: Expecting numeric in D28539 / R28539C4: got 'n.a.'
## Warning: Expecting numeric in D28540 / R28540C4: got 'n.a.'
## Warning: Expecting numeric in D28541 / R28541C4: got 'n.a.'
## Warning: Expecting numeric in D28542 / R28542C4: got 'n.a.'
## Warning: Expecting numeric in D28543 / R28543C4: got 'n.a.'
## Warning: Expecting numeric in D28544 / R28544C4: got 'n.a.'
## Warning: Expecting numeric in D28545 / R28545C4: got 'n.a.'
## Warning: Expecting numeric in D28546 / R28546C4: got 'n.a.'
## Warning: Expecting numeric in D28547 / R28547C4: got 'n.a.'
## Warning: Expecting numeric in D28548 / R28548C4: got 'n.a.'
## Warning: Expecting numeric in D28549 / R28549C4: got 'n.a.'
## Warning: Expecting numeric in D28550 / R28550C4: got 'n.a.'
## Warning: Expecting numeric in D28551 / R28551C4: got 'n.a.'
## Warning: Expecting numeric in D28552 / R28552C4: got 'n.a.'
## Warning: Expecting numeric in D28553 / R28553C4: got 'n.a.'
## Warning: Expecting numeric in D28554 / R28554C4: got 'n.a.'
## Warning: Expecting numeric in D28555 / R28555C4: got 'n.a.'
## Warning: Expecting numeric in D28556 / R28556C4: got 'n.a.'
## Warning: Expecting numeric in D28557 / R28557C4: got 'n.a.'
## Warning: Expecting numeric in D28558 / R28558C4: got 'n.a.'
## Warning: Expecting numeric in D28559 / R28559C4: got 'n.a.'
## Warning: Expecting numeric in D28560 / R28560C4: got 'n.a.'
## Warning: Expecting numeric in D28561 / R28561C4: got 'n.a.'
## Warning: Expecting numeric in D28562 / R28562C4: got 'n.a.'
## Warning: Expecting numeric in D28563 / R28563C4: got 'n.a.'
## Warning: Expecting numeric in D28564 / R28564C4: got 'n.a.'
## Warning: Expecting numeric in D28565 / R28565C4: got 'n.a.'
## Warning: Expecting numeric in D28566 / R28566C4: got 'n.a.'
## Warning: Expecting numeric in D28567 / R28567C4: got 'n.a.'
## Warning: Expecting numeric in D28568 / R28568C4: got 'n.a.'
## Warning: Expecting numeric in D28569 / R28569C4: got 'n.a.'
## Warning: Expecting numeric in D28570 / R28570C4: got 'n.a.'
## Warning: Expecting numeric in D28571 / R28571C4: got 'n.a.'
## Warning: Expecting numeric in D28572 / R28572C4: got 'n.a.'
## Warning: Expecting numeric in D28573 / R28573C4: got 'n.a.'
## Warning: Expecting numeric in D28574 / R28574C4: got 'n.a.'
## Warning: Expecting numeric in D28575 / R28575C4: got 'n.a.'
## Warning: Expecting numeric in D28576 / R28576C4: got 'n.a.'
## Warning: Expecting numeric in D28577 / R28577C4: got 'n.a.'
## Warning: Expecting numeric in D28578 / R28578C4: got 'n.a.'
## Warning: Expecting numeric in D28579 / R28579C4: got 'n.a.'
## Warning: Expecting numeric in D28580 / R28580C4: got 'n.a.'
## Warning: Expecting numeric in D28581 / R28581C4: got 'n.a.'
## Warning: Expecting numeric in D28582 / R28582C4: got 'n.a.'
## Warning: Expecting numeric in D28583 / R28583C4: got 'n.a.'
## Warning: Expecting numeric in D28584 / R28584C4: got 'n.a.'
## Warning: Expecting numeric in D28585 / R28585C4: got 'n.a.'
## Warning: Expecting numeric in D28586 / R28586C4: got 'n.a.'
## Warning: Expecting numeric in D28587 / R28587C4: got 'n.a.'
## Warning: Expecting numeric in D28588 / R28588C4: got 'n.a.'
## Warning: Expecting numeric in D28589 / R28589C4: got 'n.a.'
## Warning: Expecting numeric in D28590 / R28590C4: got 'n.a.'
## Warning: Expecting numeric in D28591 / R28591C4: got 'n.a.'
## Warning: Expecting numeric in D28592 / R28592C4: got 'n.a.'
## Warning: Expecting numeric in D28593 / R28593C4: got 'n.a.'
## Warning: Expecting numeric in D28594 / R28594C4: got 'n.a.'
## Warning: Expecting numeric in D28595 / R28595C4: got 'n.a.'
## Warning: Expecting numeric in D28596 / R28596C4: got 'n.a.'
## Warning: Expecting numeric in D28597 / R28597C4: got 'n.a.'
## Warning: Expecting numeric in D28598 / R28598C4: got 'n.a.'
## Warning: Expecting numeric in D28599 / R28599C4: got 'n.a.'
## Warning: Expecting numeric in D28600 / R28600C4: got 'n.a.'
## Warning: Expecting numeric in D28601 / R28601C4: got 'n.a.'
## Warning: Expecting numeric in D28602 / R28602C4: got 'n.a.'
## Warning: Expecting numeric in D28603 / R28603C4: got 'n.a.'
## Warning: Expecting numeric in D28604 / R28604C4: got 'n.a.'
## Warning: Expecting numeric in D28605 / R28605C4: got 'n.a.'
## Warning: Expecting numeric in D28606 / R28606C4: got 'n.a.'
## Warning: Expecting numeric in D28607 / R28607C4: got 'n.a.'
## Warning: Expecting numeric in D28608 / R28608C4: got 'n.a.'
## Warning: Expecting numeric in D28609 / R28609C4: got 'n.a.'
## Warning: Expecting numeric in D28610 / R28610C4: got 'n.a.'
## Warning: Expecting numeric in D28611 / R28611C4: got 'n.a.'
## Warning: Expecting numeric in D28612 / R28612C4: got 'n.a.'
## Warning: Expecting numeric in D28613 / R28613C4: got 'n.a.'
## Warning: Expecting numeric in D28614 / R28614C4: got 'n.a.'
## Warning: Expecting numeric in D28615 / R28615C4: got 'n.a.'
## Warning: Expecting numeric in D28616 / R28616C4: got 'n.a.'
## Warning: Expecting numeric in D28617 / R28617C4: got 'n.a.'
## Warning: Expecting numeric in D28618 / R28618C4: got 'n.a.'
## Warning: Expecting numeric in D28619 / R28619C4: got 'n.a.'
## Warning: Expecting numeric in D28620 / R28620C4: got 'n.a.'
## Warning: Expecting numeric in D28621 / R28621C4: got 'n.a.'
## Warning: Expecting numeric in D28622 / R28622C4: got 'n.a.'
## Warning: Expecting numeric in D28623 / R28623C4: got 'n.a.'
## Warning: Expecting numeric in D28624 / R28624C4: got 'n.a.'
## Warning: Expecting numeric in D28625 / R28625C4: got 'n.a.'
## Warning: Expecting numeric in D28626 / R28626C4: got 'n.a.'
## Warning: Expecting numeric in D28627 / R28627C4: got 'n.a.'
## Warning: Expecting numeric in D28628 / R28628C4: got 'n.a.'
## Warning: Expecting numeric in D28629 / R28629C4: got 'n.a.'
## Warning: Expecting numeric in D28630 / R28630C4: got 'n.a.'
## Warning: Expecting numeric in D28631 / R28631C4: got 'n.a.'
## Warning: Expecting numeric in D28632 / R28632C4: got 'n.a.'
## Warning: Expecting numeric in D28633 / R28633C4: got 'n.a.'
## Warning: Expecting numeric in D28634 / R28634C4: got 'n.a.'
## Warning: Expecting numeric in D28635 / R28635C4: got 'n.a.'
## Warning: Expecting numeric in D28636 / R28636C4: got 'n.a.'
## Warning: Expecting numeric in D28637 / R28637C4: got 'n.a.'
## Warning: Expecting numeric in D28638 / R28638C4: got 'n.a.'
## Warning: Expecting numeric in D28639 / R28639C4: got 'n.a.'
## Warning: Expecting numeric in D28640 / R28640C4: got 'n.a.'
## Warning: Expecting numeric in D28641 / R28641C4: got 'n.a.'
## Warning: Expecting numeric in D28642 / R28642C4: got 'n.a.'
## Warning: Expecting numeric in D28643 / R28643C4: got 'n.a.'
## Warning: Expecting numeric in D28644 / R28644C4: got 'n.a.'
## Warning: Expecting numeric in D28645 / R28645C4: got 'n.a.'
## Warning: Expecting numeric in D28646 / R28646C4: got 'n.a.'
## Warning: Expecting numeric in D28647 / R28647C4: got 'n.a.'
## Warning: Expecting numeric in D28648 / R28648C4: got 'n.a.'
## Warning: Expecting numeric in D28649 / R28649C4: got 'n.a.'
## Warning: Expecting numeric in D28650 / R28650C4: got 'n.a.'
## Warning: Expecting numeric in D28651 / R28651C4: got 'n.a.'
## Warning: Expecting numeric in D28652 / R28652C4: got 'n.a.'
## Warning: Expecting numeric in D28653 / R28653C4: got 'n.a.'
## Warning: Expecting numeric in D28654 / R28654C4: got 'n.a.'
## Warning: Expecting numeric in D28655 / R28655C4: got 'n.a.'
## Warning: Expecting numeric in D28656 / R28656C4: got 'n.a.'
## Warning: Expecting numeric in D28657 / R28657C4: got 'n.a.'
## Warning: Expecting numeric in D28658 / R28658C4: got 'n.a.'
## Warning: Expecting numeric in D28659 / R28659C4: got 'n.a.'
## Warning: Expecting numeric in D28660 / R28660C4: got 'n.a.'
## Warning: Expecting numeric in D28661 / R28661C4: got 'n.a.'
## Warning: Expecting numeric in D28662 / R28662C4: got 'n.a.'
## Warning: Expecting numeric in D28663 / R28663C4: got 'n.a.'
## Warning: Expecting numeric in D28664 / R28664C4: got 'n.a.'
## Warning: Expecting numeric in D28665 / R28665C4: got 'n.a.'
## Warning: Expecting numeric in D28666 / R28666C4: got 'n.a.'
## Warning: Expecting numeric in D28667 / R28667C4: got 'n.a.'
## Warning: Expecting numeric in D28668 / R28668C4: got 'n.a.'
## Warning: Expecting numeric in D28669 / R28669C4: got 'n.a.'
## Warning: Expecting numeric in D28670 / R28670C4: got 'n.a.'
## Warning: Expecting numeric in D28671 / R28671C4: got 'n.a.'
## Warning: Expecting numeric in D28672 / R28672C4: got 'n.a.'
## Warning: Expecting numeric in D28673 / R28673C4: got 'n.a.'
## Warning: Expecting numeric in D28674 / R28674C4: got 'n.a.'
## Warning: Expecting numeric in D28675 / R28675C4: got 'n.a.'
## Warning: Expecting numeric in D28676 / R28676C4: got 'n.a.'
## Warning: Expecting numeric in D28677 / R28677C4: got 'n.a.'
## Warning: Expecting numeric in D28678 / R28678C4: got 'n.a.'
## Warning: Expecting numeric in D28679 / R28679C4: got 'n.a.'
## Warning: Expecting numeric in D28680 / R28680C4: got 'n.a.'
## Warning: Expecting numeric in D28681 / R28681C4: got 'n.a.'
## Warning: Expecting numeric in D28682 / R28682C4: got 'n.a.'
## Warning: Expecting numeric in D28683 / R28683C4: got 'n.a.'
## Warning: Expecting numeric in D28684 / R28684C4: got 'n.a.'
## Warning: Expecting numeric in D28685 / R28685C4: got 'n.a.'
## Warning: Expecting numeric in D28686 / R28686C4: got 'n.a.'
## Warning: Expecting numeric in D28687 / R28687C4: got 'n.a.'
## Warning: Expecting numeric in D28688 / R28688C4: got 'n.a.'
## Warning: Expecting numeric in D28689 / R28689C4: got 'n.a.'
## Warning: Expecting numeric in D28690 / R28690C4: got 'n.a.'
## Warning: Expecting numeric in D28691 / R28691C4: got 'n.a.'
## Warning: Expecting numeric in D28692 / R28692C4: got 'n.a.'
## Warning: Expecting numeric in D28693 / R28693C4: got 'n.a.'
## Warning: Expecting numeric in D28694 / R28694C4: got 'n.a.'
## Warning: Expecting numeric in D28695 / R28695C4: got 'n.a.'
## Warning: Expecting numeric in D28696 / R28696C4: got 'n.a.'
## Warning: Expecting numeric in D28697 / R28697C4: got 'n.a.'
## Warning: Expecting numeric in D28698 / R28698C4: got 'n.a.'
## Warning: Expecting numeric in D28699 / R28699C4: got 'n.a.'
## Warning: Expecting numeric in D28700 / R28700C4: got 'n.a.'
## Warning: Expecting numeric in D28701 / R28701C4: got 'n.a.'
## Warning: Expecting numeric in D28702 / R28702C4: got 'n.a.'
## Warning: Expecting numeric in D28703 / R28703C4: got 'n.a.'
## Warning: Expecting numeric in D28704 / R28704C4: got 'n.a.'
## Warning: Expecting numeric in D28705 / R28705C4: got 'n.a.'
## Warning: Expecting numeric in D28706 / R28706C4: got 'n.a.'
## Warning: Expecting numeric in D28707 / R28707C4: got 'n.a.'
## Warning: Expecting numeric in D28708 / R28708C4: got 'n.a.'
## Warning: Expecting numeric in D28709 / R28709C4: got 'n.a.'
## Warning: Expecting numeric in D28710 / R28710C4: got 'n.a.'
## Warning: Expecting numeric in D28711 / R28711C4: got 'n.a.'
## Warning: Expecting numeric in D28712 / R28712C4: got 'n.a.'
## Warning: Expecting numeric in D28713 / R28713C4: got 'n.a.'
## Warning: Expecting numeric in D28714 / R28714C4: got 'n.a.'
## Warning: Expecting numeric in D28715 / R28715C4: got 'n.a.'
## Warning: Expecting numeric in D28716 / R28716C4: got 'n.a.'
## Warning: Expecting numeric in D28717 / R28717C4: got 'n.a.'
## Warning: Expecting numeric in D28718 / R28718C4: got 'n.a.'
## Warning: Expecting numeric in D28719 / R28719C4: got 'n.a.'
## Warning: Expecting numeric in D28720 / R28720C4: got 'n.a.'
## Warning: Expecting numeric in D28721 / R28721C4: got 'n.a.'
## Warning: Expecting numeric in D28722 / R28722C4: got 'n.a.'
## Warning: Expecting numeric in D28723 / R28723C4: got 'n.a.'
## Warning: Expecting numeric in D28724 / R28724C4: got 'n.a.'
## Warning: Expecting numeric in D28725 / R28725C4: got 'n.a.'
## Warning: Expecting numeric in D28726 / R28726C4: got 'n.a.'
## Warning: Expecting numeric in D28727 / R28727C4: got 'n.a.'
## Warning: Expecting numeric in D28728 / R28728C4: got 'n.a.'
## Warning: Expecting numeric in D28729 / R28729C4: got 'n.a.'
## Warning: Expecting numeric in D28730 / R28730C4: got 'n.a.'
## Warning: Expecting numeric in D28731 / R28731C4: got 'n.a.'
## Warning: Expecting numeric in D28732 / R28732C4: got 'n.a.'
## Warning: Expecting numeric in D28733 / R28733C4: got 'n.a.'
## Warning: Expecting numeric in D28734 / R28734C4: got 'n.a.'
## Warning: Expecting numeric in D28735 / R28735C4: got 'n.a.'
## Warning: Expecting numeric in D28736 / R28736C4: got 'n.a.'
## Warning: Expecting numeric in D28737 / R28737C4: got 'n.a.'
## Warning: Expecting numeric in D28738 / R28738C4: got 'n.a.'
## Warning: Expecting numeric in D28739 / R28739C4: got 'n.a.'
## Warning: Expecting numeric in D28740 / R28740C4: got 'n.a.'
## Warning: Expecting numeric in D28741 / R28741C4: got 'n.a.'
## Warning: Expecting numeric in D28742 / R28742C4: got 'n.a.'
## Warning: Expecting numeric in D28743 / R28743C4: got 'n.a.'
## Warning: Expecting numeric in D28744 / R28744C4: got 'n.a.'
## Warning: Expecting numeric in D28745 / R28745C4: got 'n.a.'
## Warning: Expecting numeric in D28746 / R28746C4: got 'n.a.'
## Warning: Expecting numeric in D28747 / R28747C4: got 'n.a.'
## Warning: Expecting numeric in D28748 / R28748C4: got 'n.a.'
## Warning: Expecting numeric in D28749 / R28749C4: got 'n.a.'
## Warning: Expecting numeric in D28750 / R28750C4: got 'n.a.'
## Warning: Expecting numeric in D28751 / R28751C4: got 'n.a.'
## Warning: Expecting numeric in D28752 / R28752C4: got 'n.a.'
## Warning: Expecting numeric in D28753 / R28753C4: got 'n.a.'
## Warning: Expecting numeric in D28754 / R28754C4: got 'n.a.'
## Warning: Expecting numeric in D28755 / R28755C4: got 'n.a.'
## Warning: Expecting numeric in D28756 / R28756C4: got 'n.a.'
## Warning: Expecting numeric in D28757 / R28757C4: got 'n.a.'
## Warning: Expecting numeric in D28758 / R28758C4: got 'n.a.'
## Warning: Expecting numeric in D28759 / R28759C4: got 'n.a.'
## Warning: Expecting numeric in D28760 / R28760C4: got 'n.a.'
## Warning: Expecting numeric in D28761 / R28761C4: got 'n.a.'
## Warning: Expecting numeric in D28762 / R28762C4: got 'n.a.'
## Warning: Expecting numeric in D28763 / R28763C4: got 'n.a.'
## Warning: Expecting numeric in D28764 / R28764C4: got 'n.a.'
## Warning: Expecting numeric in D28765 / R28765C4: got 'n.a.'
## Warning: Expecting numeric in D28766 / R28766C4: got 'n.a.'
## Warning: Expecting numeric in D28767 / R28767C4: got 'n.a.'
## Warning: Expecting numeric in D28768 / R28768C4: got 'n.a.'
## Warning: Expecting numeric in D28769 / R28769C4: got 'n.a.'
## Warning: Expecting numeric in D28770 / R28770C4: got 'n.a.'
## Warning: Expecting numeric in D28771 / R28771C4: got 'n.a.'
## Warning: Expecting numeric in D28772 / R28772C4: got 'n.a.'
## Warning: Expecting numeric in D28773 / R28773C4: got 'n.a.'
## Warning: Expecting numeric in D28774 / R28774C4: got 'n.a.'
## Warning: Expecting numeric in D28775 / R28775C4: got 'n.a.'
## Warning: Expecting numeric in D28776 / R28776C4: got 'n.a.'
## Warning: Expecting numeric in D28777 / R28777C4: got 'n.a.'
## Warning: Expecting numeric in D28778 / R28778C4: got 'n.a.'
## Warning: Expecting numeric in D28779 / R28779C4: got 'n.a.'
## Warning: Expecting numeric in D28780 / R28780C4: got 'n.a.'
## Warning: Expecting numeric in D28781 / R28781C4: got 'n.a.'
## Warning: Expecting numeric in D28782 / R28782C4: got 'n.a.'
## Warning: Expecting numeric in D28783 / R28783C4: got 'n.a.'
## Warning: Expecting numeric in D28784 / R28784C4: got 'n.a.'
## Warning: Expecting numeric in D28785 / R28785C4: got 'n.a.'
## Warning: Expecting numeric in D28786 / R28786C4: got 'n.a.'
## Warning: Expecting numeric in D28787 / R28787C4: got 'n.a.'
## Warning: Expecting numeric in D28788 / R28788C4: got 'n.a.'
## Warning: Expecting numeric in D28789 / R28789C4: got 'n.a.'
## Warning: Expecting numeric in D28790 / R28790C4: got 'n.a.'
## Warning: Expecting numeric in D28791 / R28791C4: got 'n.a.'
## Warning: Expecting numeric in D28792 / R28792C4: got 'n.a.'
## Warning: Expecting numeric in D28793 / R28793C4: got 'n.a.'
## Warning: Expecting numeric in D28794 / R28794C4: got 'n.a.'
## Warning: Expecting numeric in D28795 / R28795C4: got 'n.a.'
## Warning: Expecting numeric in D28796 / R28796C4: got 'n.a.'
## Warning: Expecting numeric in D28797 / R28797C4: got 'n.a.'
## Warning: Expecting numeric in D28798 / R28798C4: got 'n.a.'
## Warning: Expecting numeric in D28799 / R28799C4: got 'n.a.'
## Warning: Expecting numeric in D28800 / R28800C4: got 'n.a.'
## Warning: Expecting numeric in D28801 / R28801C4: got 'n.a.'
## Warning: Expecting numeric in D28802 / R28802C4: got 'n.a.'
## Warning: Expecting numeric in D28803 / R28803C4: got 'n.a.'
## Warning: Expecting numeric in D28804 / R28804C4: got 'n.a.'
## Warning: Expecting numeric in D28805 / R28805C4: got 'n.a.'
## Warning: Expecting numeric in D28806 / R28806C4: got 'n.a.'
## Warning: Expecting numeric in D28807 / R28807C4: got 'n.a.'
## Warning: Expecting numeric in D28808 / R28808C4: got 'n.a.'
## Warning: Expecting numeric in D28809 / R28809C4: got 'n.a.'
## Warning: Expecting numeric in D28810 / R28810C4: got 'n.a.'
## Warning: Expecting numeric in D28811 / R28811C4: got 'n.a.'
## Warning: Expecting numeric in D28812 / R28812C4: got 'n.a.'
## Warning: Expecting numeric in D28813 / R28813C4: got 'n.a.'
## Warning: Expecting numeric in D28814 / R28814C4: got 'n.a.'
## Warning: Expecting numeric in D28815 / R28815C4: got 'n.a.'
## Warning: Expecting numeric in D28816 / R28816C4: got 'n.a.'
## Warning: Expecting numeric in D28817 / R28817C4: got 'n.a.'
## Warning: Expecting numeric in D28818 / R28818C4: got 'n.a.'
## Warning: Expecting numeric in D28819 / R28819C4: got 'n.a.'
## Warning: Expecting numeric in D28820 / R28820C4: got 'n.a.'
## Warning: Expecting numeric in D28821 / R28821C4: got 'n.a.'
## Warning: Expecting numeric in D28822 / R28822C4: got 'n.a.'
## Warning: Expecting numeric in D28823 / R28823C4: got 'n.a.'
## Warning: Expecting numeric in D28824 / R28824C4: got 'n.a.'
## Warning: Expecting numeric in D28825 / R28825C4: got 'n.a.'
## Warning: Expecting numeric in D28826 / R28826C4: got 'n.a.'
## Warning: Expecting numeric in D28827 / R28827C4: got 'n.a.'
## Warning: Expecting numeric in D28828 / R28828C4: got 'n.a.'
## Warning: Expecting numeric in D28829 / R28829C4: got 'n.a.'
## Warning: Expecting numeric in D28830 / R28830C4: got 'n.a.'
## Warning: Expecting numeric in D28831 / R28831C4: got 'n.a.'
## Warning: Expecting numeric in D28832 / R28832C4: got 'n.a.'
## Warning: Expecting numeric in D28833 / R28833C4: got 'n.a.'
## Warning: Expecting numeric in D28834 / R28834C4: got 'n.a.'
## Warning: Expecting numeric in D28835 / R28835C4: got 'n.a.'
## Warning: Expecting numeric in D28836 / R28836C4: got 'n.a.'
## Warning: Expecting numeric in D28837 / R28837C4: got 'n.a.'
## Warning: Expecting numeric in D28838 / R28838C4: got 'n.a.'
## Warning: Expecting numeric in D28839 / R28839C4: got 'n.a.'
## Warning: Expecting numeric in D28840 / R28840C4: got 'n.a.'
## Warning: Expecting numeric in D28841 / R28841C4: got 'n.a.'
## Warning: Expecting numeric in D28842 / R28842C4: got 'n.a.'
## Warning: Expecting numeric in D28843 / R28843C4: got 'n.a.'
## Warning: Expecting numeric in D28844 / R28844C4: got 'n.a.'
## Warning: Expecting numeric in D28845 / R28845C4: got 'n.a.'
## Warning: Expecting numeric in D28846 / R28846C4: got 'n.a.'
## Warning: Expecting numeric in D28847 / R28847C4: got 'n.a.'
## Warning: Expecting numeric in D28848 / R28848C4: got 'n.a.'
## Warning: Expecting numeric in D28849 / R28849C4: got 'n.a.'
## Warning: Expecting numeric in D28850 / R28850C4: got 'n.a.'
## Warning: Expecting numeric in D28851 / R28851C4: got 'n.a.'
## Warning: Expecting numeric in D28852 / R28852C4: got 'n.a.'
## Warning: Expecting numeric in D28853 / R28853C4: got 'n.a.'
## Warning: Expecting numeric in D28854 / R28854C4: got 'n.a.'
## Warning: Expecting numeric in D28855 / R28855C4: got 'n.a.'
## Warning: Expecting numeric in D28856 / R28856C4: got 'n.a.'
## Warning: Expecting numeric in D28857 / R28857C4: got 'n.a.'
## Warning: Expecting numeric in D28858 / R28858C4: got 'n.a.'
## Warning: Expecting numeric in D28859 / R28859C4: got 'n.a.'
## Warning: Expecting numeric in D28860 / R28860C4: got 'n.a.'
## Warning: Expecting numeric in D28861 / R28861C4: got 'n.a.'
## Warning: Expecting numeric in D28862 / R28862C4: got 'n.a.'
## Warning: Expecting numeric in D28863 / R28863C4: got 'n.a.'
## Warning: Expecting numeric in D28864 / R28864C4: got 'n.a.'
## Warning: Expecting numeric in D28865 / R28865C4: got 'n.a.'
## Warning: Expecting numeric in D28866 / R28866C4: got 'n.a.'
## Warning: Expecting numeric in D28867 / R28867C4: got 'n.a.'
## Warning: Expecting numeric in D28868 / R28868C4: got 'n.a.'
## Warning: Expecting numeric in D28869 / R28869C4: got 'n.a.'
## Warning: Expecting numeric in D28870 / R28870C4: got 'n.a.'
## Warning: Expecting numeric in D28871 / R28871C4: got 'n.a.'
## Warning: Expecting numeric in D28872 / R28872C4: got 'n.a.'
## Warning: Expecting numeric in D28873 / R28873C4: got 'n.a.'
## Warning: Expecting numeric in D28874 / R28874C4: got 'n.a.'
## Warning: Expecting numeric in D28875 / R28875C4: got 'n.a.'
## Warning: Expecting numeric in D28876 / R28876C4: got 'n.a.'
## Warning: Expecting numeric in D28877 / R28877C4: got 'n.a.'
## Warning: Expecting numeric in D28878 / R28878C4: got 'n.a.'
## Warning: Expecting numeric in D28879 / R28879C4: got 'n.a.'
## Warning: Expecting numeric in D28880 / R28880C4: got 'n.a.'
## Warning: Expecting numeric in D28881 / R28881C4: got 'n.a.'
## Warning: Expecting numeric in D28882 / R28882C4: got 'n.a.'
## Warning: Expecting numeric in D28883 / R28883C4: got 'n.a.'
## Warning: Expecting numeric in D28884 / R28884C4: got 'n.a.'
## Warning: Expecting numeric in D28885 / R28885C4: got 'n.a.'
## Warning: Expecting numeric in D28886 / R28886C4: got 'n.a.'
## Warning: Expecting numeric in D28887 / R28887C4: got 'n.a.'
## Warning: Expecting numeric in D28888 / R28888C4: got 'n.a.'
## Warning: Expecting numeric in D28889 / R28889C4: got 'n.a.'
## Warning: Expecting numeric in D28890 / R28890C4: got 'n.a.'
## Warning: Expecting numeric in D28891 / R28891C4: got 'n.a.'
## Warning: Expecting numeric in D28892 / R28892C4: got 'n.a.'
## Warning: Expecting numeric in D28893 / R28893C4: got 'n.a.'
## Warning: Expecting numeric in D28894 / R28894C4: got 'n.a.'
## Warning: Expecting numeric in D28895 / R28895C4: got 'n.a.'
## Warning: Expecting numeric in D28896 / R28896C4: got 'n.a.'
## Warning: Expecting numeric in D28897 / R28897C4: got 'n.a.'
## Warning: Expecting numeric in D28898 / R28898C4: got 'n.a.'
## Warning: Expecting numeric in D28899 / R28899C4: got 'n.a.'
## Warning: Expecting numeric in D28900 / R28900C4: got 'n.a.'
## Warning: Expecting numeric in D28901 / R28901C4: got 'n.a.'
## Warning: Expecting numeric in D28902 / R28902C4: got 'n.a.'
## Warning: Expecting numeric in D28903 / R28903C4: got 'n.a.'
## Warning: Expecting numeric in D28904 / R28904C4: got 'n.a.'
## Warning: Expecting numeric in D28905 / R28905C4: got 'n.a.'
## Warning: Expecting numeric in D28906 / R28906C4: got 'n.a.'
## Warning: Expecting numeric in D28907 / R28907C4: got 'n.a.'
## Warning: Expecting numeric in D28908 / R28908C4: got 'n.a.'
## Warning: Expecting numeric in D28909 / R28909C4: got 'n.a.'
## Warning: Expecting numeric in D28910 / R28910C4: got 'n.a.'
## Warning: Expecting numeric in D28911 / R28911C4: got 'n.a.'
## Warning: Expecting numeric in D28912 / R28912C4: got 'n.a.'
## Warning: Expecting numeric in D28913 / R28913C4: got 'n.a.'
## Warning: Expecting numeric in D28914 / R28914C4: got 'n.a.'
## Warning: Expecting numeric in D28915 / R28915C4: got 'n.a.'
## Warning: Expecting numeric in D28916 / R28916C4: got 'n.a.'
## Warning: Expecting numeric in D28917 / R28917C4: got 'n.a.'
## Warning: Expecting numeric in D28918 / R28918C4: got 'n.a.'
## Warning: Expecting numeric in D28919 / R28919C4: got 'n.a.'
## Warning: Expecting numeric in D28920 / R28920C4: got 'n.a.'
## Warning: Expecting numeric in D28921 / R28921C4: got 'n.a.'
## Warning: Expecting numeric in D28922 / R28922C4: got 'n.a.'
## Warning: Expecting numeric in D28923 / R28923C4: got 'n.a.'
## Warning: Expecting numeric in D28924 / R28924C4: got 'n.a.'
## Warning: Expecting numeric in D28925 / R28925C4: got 'n.a.'
## Warning: Expecting numeric in D28926 / R28926C4: got 'n.a.'
## Warning: Expecting numeric in D28927 / R28927C4: got 'n.a.'
## Warning: Expecting numeric in D28928 / R28928C4: got 'n.a.'
## Warning: Expecting numeric in D28929 / R28929C4: got 'n.a.'
## Warning: Expecting numeric in D28930 / R28930C4: got 'n.a.'
## Warning: Expecting numeric in D28931 / R28931C4: got 'n.a.'
## Warning: Expecting numeric in D28932 / R28932C4: got 'n.a.'
## Warning: Expecting numeric in D28933 / R28933C4: got 'n.a.'
## Warning: Expecting numeric in D28934 / R28934C4: got 'n.a.'
## Warning: Expecting numeric in D28935 / R28935C4: got 'n.a.'
## Warning: Expecting numeric in D28936 / R28936C4: got 'n.a.'
## Warning: Expecting numeric in D28937 / R28937C4: got 'n.a.'
## Warning: Expecting numeric in D28938 / R28938C4: got 'n.a.'
## Warning: Expecting numeric in D28939 / R28939C4: got 'n.a.'
## Warning: Expecting numeric in D28940 / R28940C4: got 'n.a.'
## Warning: Expecting numeric in D28941 / R28941C4: got 'n.a.'
## Warning: Expecting numeric in D28942 / R28942C4: got 'n.a.'
## Warning: Expecting numeric in D28943 / R28943C4: got 'n.a.'
## Warning: Expecting numeric in D28944 / R28944C4: got 'n.a.'
## Warning: Expecting numeric in D28945 / R28945C4: got 'n.a.'
## Warning: Expecting numeric in D28946 / R28946C4: got 'n.a.'
## Warning: Expecting numeric in D28947 / R28947C4: got 'n.a.'
## Warning: Expecting numeric in D28948 / R28948C4: got 'n.a.'
## Warning: Expecting numeric in D28949 / R28949C4: got 'n.a.'
## Warning: Expecting numeric in D28950 / R28950C4: got 'n.a.'
## Warning: Expecting numeric in D28951 / R28951C4: got 'n.a.'
## Warning: Expecting numeric in D28952 / R28952C4: got 'n.a.'
## Warning: Expecting numeric in D28953 / R28953C4: got 'n.a.'
## Warning: Expecting numeric in D28954 / R28954C4: got 'n.a.'
## Warning: Expecting numeric in D28955 / R28955C4: got 'n.a.'
## Warning: Expecting numeric in D28956 / R28956C4: got 'n.a.'
## Warning: Expecting numeric in D28957 / R28957C4: got 'n.a.'
## Warning: Expecting numeric in D28958 / R28958C4: got 'n.a.'
## Warning: Expecting numeric in D28959 / R28959C4: got 'n.a.'
## Warning: Expecting numeric in D28960 / R28960C4: got 'n.a.'
## Warning: Expecting numeric in D28961 / R28961C4: got 'n.a.'
## Warning: Expecting numeric in D28962 / R28962C4: got 'n.a.'
## Warning: Expecting numeric in D28963 / R28963C4: got 'n.a.'
## Warning: Expecting numeric in D28964 / R28964C4: got 'n.a.'
## Warning: Expecting numeric in D28965 / R28965C4: got 'n.a.'
## Warning: Expecting numeric in D28966 / R28966C4: got 'n.a.'
## Warning: Expecting numeric in D28967 / R28967C4: got 'n.a.'
## Warning: Expecting numeric in D28968 / R28968C4: got 'n.a.'
## Warning: Expecting numeric in D28969 / R28969C4: got 'n.a.'
## Warning: Expecting numeric in D28970 / R28970C4: got 'n.a.'
## Warning: Expecting numeric in D28971 / R28971C4: got 'n.a.'
## Warning: Expecting numeric in D28972 / R28972C4: got 'n.a.'
## Warning: Expecting numeric in D28973 / R28973C4: got 'n.a.'
## Warning: Expecting numeric in D28974 / R28974C4: got 'n.a.'
## Warning: Expecting numeric in D28975 / R28975C4: got 'n.a.'
## Warning: Expecting numeric in D28976 / R28976C4: got 'n.a.'
## Warning: Expecting numeric in D28977 / R28977C4: got 'n.a.'
## Warning: Expecting numeric in D28978 / R28978C4: got 'n.a.'
## Warning: Expecting numeric in D28979 / R28979C4: got 'n.a.'
## Warning: Expecting numeric in D28980 / R28980C4: got 'n.a.'
## Warning: Expecting numeric in D28981 / R28981C4: got 'n.a.'
## Warning: Expecting numeric in D28982 / R28982C4: got 'n.a.'
## Warning: Expecting numeric in D28983 / R28983C4: got 'n.a.'
## Warning: Expecting numeric in D28984 / R28984C4: got 'n.a.'
## Warning: Expecting numeric in D28985 / R28985C4: got 'n.a.'
## Warning: Expecting numeric in D28986 / R28986C4: got 'n.a.'
## Warning: Expecting numeric in D28987 / R28987C4: got 'n.a.'
## Warning: Expecting numeric in D28988 / R28988C4: got 'n.a.'
## Warning: Expecting numeric in D28989 / R28989C4: got 'n.a.'
## Warning: Expecting numeric in D28990 / R28990C4: got 'n.a.'
## Warning: Expecting numeric in D28991 / R28991C4: got 'n.a.'
## Warning: Expecting numeric in D28992 / R28992C4: got 'n.a.'
## Warning: Expecting numeric in D28993 / R28993C4: got 'n.a.'
## Warning: Expecting numeric in D28994 / R28994C4: got 'n.a.'
## Warning: Expecting numeric in D28995 / R28995C4: got 'n.a.'
## Warning: Expecting numeric in D28996 / R28996C4: got 'n.a.'
## Warning: Expecting numeric in D28997 / R28997C4: got 'n.a.'
## Warning: Expecting numeric in D28998 / R28998C4: got 'n.a.'
## Warning: Expecting numeric in D28999 / R28999C4: got 'n.a.'
## Warning: Expecting numeric in D29000 / R29000C4: got 'n.a.'
## Warning: Expecting numeric in D29001 / R29001C4: got 'n.a.'
## Warning: Expecting numeric in D29002 / R29002C4: got 'n.a.'
## Warning: Expecting numeric in D29003 / R29003C4: got 'n.a.'
## Warning: Expecting numeric in D29004 / R29004C4: got 'n.a.'
## Warning: Expecting numeric in D29005 / R29005C4: got 'n.a.'
## Warning: Expecting numeric in D29006 / R29006C4: got 'n.a.'
## Warning: Expecting numeric in D29007 / R29007C4: got 'n.a.'
## Warning: Expecting numeric in D29008 / R29008C4: got 'n.a.'
## Warning: Expecting numeric in D29009 / R29009C4: got 'n.a.'
## Warning: Expecting numeric in D29010 / R29010C4: got 'n.a.'
## Warning: Expecting numeric in D29011 / R29011C4: got 'n.a.'
## Warning: Expecting numeric in D29012 / R29012C4: got 'n.a.'
## Warning: Expecting numeric in D29013 / R29013C4: got 'n.a.'
## Warning: Expecting numeric in D29014 / R29014C4: got 'n.a.'
## Warning: Expecting numeric in D29015 / R29015C4: got 'n.a.'
## Warning: Expecting numeric in D29016 / R29016C4: got 'n.a.'
## Warning: Expecting numeric in D29017 / R29017C4: got 'n.a.'
## Warning: Expecting numeric in D29018 / R29018C4: got 'n.a.'
## Warning: Expecting numeric in D29019 / R29019C4: got 'n.a.'
## Warning: Expecting numeric in D29020 / R29020C4: got 'n.a.'
## Warning: Expecting numeric in D29021 / R29021C4: got 'n.a.'
## Warning: Expecting numeric in D29022 / R29022C4: got 'n.a.'
## Warning: Expecting numeric in D29023 / R29023C4: got 'n.a.'
## Warning: Expecting numeric in D29024 / R29024C4: got 'n.a.'
## Warning: Expecting numeric in D29025 / R29025C4: got 'n.a.'
## Warning: Expecting numeric in D29026 / R29026C4: got 'n.a.'
## Warning: Expecting numeric in D29027 / R29027C4: got 'n.a.'
## Warning: Expecting numeric in D29028 / R29028C4: got 'n.a.'
## Warning: Expecting numeric in D29029 / R29029C4: got 'n.a.'
## Warning: Expecting numeric in D29030 / R29030C4: got 'n.a.'
## Warning: Expecting numeric in D29031 / R29031C4: got 'n.a.'
## Warning: Expecting numeric in D29032 / R29032C4: got 'n.a.'
## Warning: Expecting numeric in D29033 / R29033C4: got 'n.a.'
## Warning: Expecting numeric in D29034 / R29034C4: got 'n.a.'
## Warning: Expecting numeric in D29035 / R29035C4: got 'n.a.'
## Warning: Expecting numeric in D29036 / R29036C4: got 'n.a.'
## Warning: Expecting numeric in D29037 / R29037C4: got 'n.a.'
## Warning: Expecting numeric in D29038 / R29038C4: got 'n.a.'
## Warning: Expecting numeric in D29039 / R29039C4: got 'n.a.'
## Warning: Expecting numeric in D29040 / R29040C4: got 'n.a.'
## Warning: Expecting numeric in D29041 / R29041C4: got 'n.a.'
## Warning: Expecting numeric in D29042 / R29042C4: got 'n.a.'
## Warning: Expecting numeric in D29043 / R29043C4: got 'n.a.'
## Warning: Expecting numeric in D29044 / R29044C4: got 'n.a.'
## Warning: Expecting numeric in D29045 / R29045C4: got 'n.a.'
## Warning: Expecting numeric in D29046 / R29046C4: got 'n.a.'
## Warning: Expecting numeric in D29047 / R29047C4: got 'n.a.'
## Warning: Expecting numeric in D29048 / R29048C4: got 'n.a.'
## Warning: Expecting numeric in D29049 / R29049C4: got 'n.a.'
## Warning: Expecting numeric in D29050 / R29050C4: got 'n.a.'
## Warning: Expecting numeric in D29051 / R29051C4: got 'n.a.'
## Warning: Expecting numeric in D29052 / R29052C4: got 'n.a.'
## Warning: Expecting numeric in D29053 / R29053C4: got 'n.a.'
## Warning: Expecting numeric in D29054 / R29054C4: got 'n.a.'
## Warning: Expecting numeric in D29055 / R29055C4: got 'n.a.'
## Warning: Expecting numeric in D29056 / R29056C4: got 'n.a.'
## Warning: Expecting numeric in D29057 / R29057C4: got 'n.a.'
## Warning: Expecting numeric in D29058 / R29058C4: got 'n.a.'
## Warning: Expecting numeric in D29059 / R29059C4: got 'n.a.'
## Warning: Expecting numeric in D29060 / R29060C4: got 'n.a.'
## Warning: Expecting numeric in D29061 / R29061C4: got 'n.a.'
## Warning: Expecting numeric in D29062 / R29062C4: got 'n.a.'
## Warning: Expecting numeric in D29063 / R29063C4: got 'n.a.'
## Warning: Expecting numeric in D29064 / R29064C4: got 'n.a.'
## Warning: Expecting numeric in D29065 / R29065C4: got 'n.a.'
## Warning: Expecting numeric in D29066 / R29066C4: got 'n.a.'
## Warning: Expecting numeric in D29067 / R29067C4: got 'n.a.'
## Warning: Expecting numeric in D29068 / R29068C4: got 'n.a.'
## Warning: Expecting numeric in D29069 / R29069C4: got 'n.a.'
## Warning: Expecting numeric in D29070 / R29070C4: got 'n.a.'
## Warning: Expecting numeric in D29071 / R29071C4: got 'n.a.'
## Warning: Expecting numeric in D29072 / R29072C4: got 'n.a.'
## Warning: Expecting numeric in D29073 / R29073C4: got 'n.a.'
## Warning: Expecting numeric in D29074 / R29074C4: got 'n.a.'
## Warning: Expecting numeric in D29075 / R29075C4: got 'n.a.'
## Warning: Expecting numeric in D29076 / R29076C4: got 'n.a.'
## Warning: Expecting numeric in D29077 / R29077C4: got 'n.a.'
## Warning: Expecting numeric in D29078 / R29078C4: got 'n.a.'
## Warning: Expecting numeric in D29079 / R29079C4: got 'n.a.'
## Warning: Expecting numeric in D29080 / R29080C4: got 'n.a.'
## Warning: Expecting numeric in D29081 / R29081C4: got 'n.a.'
## Warning: Expecting numeric in D29082 / R29082C4: got 'n.a.'
## Warning: Expecting numeric in D29083 / R29083C4: got 'n.a.'
## Warning: Expecting numeric in D29084 / R29084C4: got 'n.a.'
## Warning: Expecting numeric in D29085 / R29085C4: got 'n.a.'
## Warning: Expecting numeric in D29086 / R29086C4: got 'n.a.'
## Warning: Expecting numeric in D29087 / R29087C4: got 'n.a.'
## Warning: Expecting numeric in D29088 / R29088C4: got 'n.a.'
## Warning: Expecting numeric in D29089 / R29089C4: got 'n.a.'
## Warning: Expecting numeric in D29090 / R29090C4: got 'n.a.'
## Warning: Expecting numeric in D29091 / R29091C4: got 'n.a.'
## Warning: Expecting numeric in D29092 / R29092C4: got 'n.a.'
## Warning: Expecting numeric in D29093 / R29093C4: got 'n.a.'
## Warning: Expecting numeric in D29094 / R29094C4: got 'n.a.'
## Warning: Expecting numeric in D29095 / R29095C4: got 'n.a.'
## Warning: Expecting numeric in D29096 / R29096C4: got 'n.a.'
## Warning: Expecting numeric in D29097 / R29097C4: got 'n.a.'
## Warning: Expecting numeric in D29098 / R29098C4: got 'n.a.'
## Warning: Expecting numeric in D29099 / R29099C4: got 'n.a.'
## Warning: Expecting numeric in D29100 / R29100C4: got 'n.a.'
## Warning: Expecting numeric in D29101 / R29101C4: got 'n.a.'
## Warning: Expecting numeric in D29102 / R29102C4: got 'n.a.'
## Warning: Expecting numeric in D29103 / R29103C4: got 'n.a.'
## Warning: Expecting numeric in D29104 / R29104C4: got 'n.a.'
## Warning: Expecting numeric in D29105 / R29105C4: got 'n.a.'
## Warning: Expecting numeric in D29106 / R29106C4: got 'n.a.'
## Warning: Expecting numeric in D29107 / R29107C4: got 'n.a.'
## Warning: Expecting numeric in D29108 / R29108C4: got 'n.a.'
## Warning: Expecting numeric in D29109 / R29109C4: got 'n.a.'
## Warning: Expecting numeric in D29110 / R29110C4: got 'n.a.'
## Warning: Expecting numeric in D29111 / R29111C4: got 'n.a.'
## Warning: Expecting numeric in D29112 / R29112C4: got 'n.a.'
## Warning: Expecting numeric in D29113 / R29113C4: got 'n.a.'
## Warning: Expecting numeric in D29114 / R29114C4: got 'n.a.'
## Warning: Expecting numeric in D29115 / R29115C4: got 'n.a.'
## Warning: Expecting numeric in D29116 / R29116C4: got 'n.a.'
## Warning: Expecting numeric in D29117 / R29117C4: got 'n.a.'
## Warning: Expecting numeric in D29118 / R29118C4: got 'n.a.'
## Warning: Expecting numeric in D29119 / R29119C4: got 'n.a.'
## Warning: Expecting numeric in D29120 / R29120C4: got 'n.a.'
## Warning: Expecting numeric in D29121 / R29121C4: got 'n.a.'
## Warning: Expecting numeric in D29122 / R29122C4: got 'n.a.'
## Warning: Expecting numeric in D29123 / R29123C4: got 'n.a.'
## Warning: Expecting numeric in D29124 / R29124C4: got 'n.a.'
## Warning: Expecting numeric in D29125 / R29125C4: got 'n.a.'
## Warning: Expecting numeric in D29126 / R29126C4: got 'n.a.'
## Warning: Expecting numeric in D29127 / R29127C4: got 'n.a.'
## Warning: Expecting numeric in D29128 / R29128C4: got 'n.a.'
## Warning: Expecting numeric in D29129 / R29129C4: got 'n.a.'
## Warning: Expecting numeric in D29130 / R29130C4: got 'n.a.'
## Warning: Expecting numeric in D29131 / R29131C4: got 'n.a.'
## Warning: Expecting numeric in D29132 / R29132C4: got 'n.a.'
## Warning: Expecting numeric in D29133 / R29133C4: got 'n.a.'
## Warning: Expecting numeric in D29134 / R29134C4: got 'n.a.'
## Warning: Expecting numeric in D29135 / R29135C4: got 'n.a.'
## Warning: Expecting numeric in D29136 / R29136C4: got 'n.a.'
## Warning: Expecting numeric in D29137 / R29137C4: got 'n.a.'
## Warning: Expecting numeric in D29138 / R29138C4: got 'n.a.'
## Warning: Expecting numeric in D29139 / R29139C4: got 'n.a.'
## Warning: Expecting numeric in D29140 / R29140C4: got 'n.a.'
## Warning: Expecting numeric in D29141 / R29141C4: got 'n.a.'
## Warning: Expecting numeric in D29142 / R29142C4: got 'n.a.'
## Warning: Expecting numeric in D29143 / R29143C4: got 'n.a.'
## Warning: Expecting numeric in D29144 / R29144C4: got 'n.a.'
## Warning: Expecting numeric in D29145 / R29145C4: got 'n.a.'
## Warning: Expecting numeric in D29146 / R29146C4: got 'n.a.'
## Warning: Expecting numeric in D29147 / R29147C4: got 'n.a.'
## Warning: Expecting numeric in D29148 / R29148C4: got 'n.a.'
## Warning: Expecting numeric in D29149 / R29149C4: got 'n.a.'
## Warning: Expecting numeric in D29150 / R29150C4: got 'n.a.'
## Warning: Expecting numeric in D29151 / R29151C4: got 'n.a.'
## Warning: Expecting numeric in D29152 / R29152C4: got 'n.a.'
## Warning: Expecting numeric in D29153 / R29153C4: got 'n.a.'
## Warning: Expecting numeric in D29154 / R29154C4: got 'n.a.'
## Warning: Expecting numeric in D29155 / R29155C4: got 'n.a.'
## Warning: Expecting numeric in D29156 / R29156C4: got 'n.a.'
## Warning: Expecting numeric in D29157 / R29157C4: got 'n.a.'
## Warning: Expecting numeric in D29158 / R29158C4: got 'n.a.'
## Warning: Expecting numeric in D29159 / R29159C4: got 'n.a.'
## Warning: Expecting numeric in D29160 / R29160C4: got 'n.a.'
## Warning: Expecting numeric in D29161 / R29161C4: got 'n.a.'
## Warning: Expecting numeric in D29162 / R29162C4: got 'n.a.'
## Warning: Expecting numeric in D29163 / R29163C4: got 'n.a.'
## Warning: Expecting numeric in D29164 / R29164C4: got 'n.a.'
## Warning: Expecting numeric in D29165 / R29165C4: got 'n.a.'
## Warning: Expecting numeric in D29166 / R29166C4: got 'n.a.'
## Warning: Expecting numeric in D29167 / R29167C4: got 'n.a.'
## Warning: Expecting numeric in D29168 / R29168C4: got 'n.a.'
## Warning: Expecting numeric in D29169 / R29169C4: got 'n.a.'
## Warning: Expecting numeric in D29170 / R29170C4: got 'n.a.'
## Warning: Expecting numeric in D29171 / R29171C4: got 'n.a.'
## Warning: Expecting numeric in D29172 / R29172C4: got 'n.a.'
## Warning: Expecting numeric in D29173 / R29173C4: got 'n.a.'
## Warning: Expecting numeric in D29174 / R29174C4: got 'n.a.'
## Warning: Expecting numeric in D29175 / R29175C4: got 'n.a.'
## Warning: Expecting numeric in D29176 / R29176C4: got 'n.a.'
## Warning: Expecting numeric in D29177 / R29177C4: got 'n.a.'
## Warning: Expecting numeric in D29178 / R29178C4: got 'n.a.'
## Warning: Expecting numeric in D29179 / R29179C4: got 'n.a.'
## Warning: Expecting numeric in D29180 / R29180C4: got 'n.a.'
## Warning: Expecting numeric in D29181 / R29181C4: got 'n.a.'
## Warning: Expecting numeric in D29182 / R29182C4: got 'n.a.'
## Warning: Expecting numeric in D29183 / R29183C4: got 'n.a.'
## Warning: Expecting numeric in D29184 / R29184C4: got 'n.a.'
## Warning: Expecting numeric in D29185 / R29185C4: got 'n.a.'
## Warning: Expecting numeric in D29186 / R29186C4: got 'n.a.'
## Warning: Expecting numeric in D29187 / R29187C4: got 'n.a.'
## Warning: Expecting numeric in D29188 / R29188C4: got 'n.a.'
## Warning: Expecting numeric in D29189 / R29189C4: got 'n.a.'
## Warning: Expecting numeric in D29190 / R29190C4: got 'n.a.'
## Warning: Expecting numeric in D29191 / R29191C4: got 'n.a.'
## Warning: Expecting numeric in D29192 / R29192C4: got 'n.a.'
## Warning: Expecting numeric in D29193 / R29193C4: got 'n.a.'
## Warning: Expecting numeric in D29194 / R29194C4: got 'n.a.'
## Warning: Expecting numeric in D29195 / R29195C4: got 'n.a.'
## Warning: Expecting numeric in D29196 / R29196C4: got 'n.a.'
## Warning: Expecting numeric in D29197 / R29197C4: got 'n.a.'
## Warning: Expecting numeric in D29198 / R29198C4: got 'n.a.'
## Warning: Expecting numeric in D29199 / R29199C4: got 'n.a.'
## Warning: Expecting numeric in D29200 / R29200C4: got 'n.a.'
## Warning: Expecting numeric in D29201 / R29201C4: got 'n.a.'
## Warning: Expecting numeric in D29202 / R29202C4: got 'n.a.'
## Warning: Expecting numeric in D29203 / R29203C4: got 'n.a.'
## Warning: Expecting numeric in D29204 / R29204C4: got 'n.a.'
## Warning: Expecting numeric in D29205 / R29205C4: got 'n.a.'
## Warning: Expecting numeric in D29206 / R29206C4: got 'n.a.'
## Warning: Expecting numeric in D29207 / R29207C4: got 'n.a.'
## Warning: Expecting numeric in D29208 / R29208C4: got 'n.a.'
## Warning: Expecting numeric in D29209 / R29209C4: got 'n.a.'
## Warning: Expecting numeric in D29210 / R29210C4: got 'n.a.'
## Warning: Expecting numeric in D29211 / R29211C4: got 'n.a.'
## Warning: Expecting numeric in D29212 / R29212C4: got 'n.a.'
## Warning: Expecting numeric in D29213 / R29213C4: got 'n.a.'
## Warning: Expecting numeric in D29214 / R29214C4: got 'n.a.'
## Warning: Expecting numeric in D29215 / R29215C4: got 'n.a.'
## Warning: Expecting numeric in D29216 / R29216C4: got 'n.a.'
## Warning: Expecting numeric in D29217 / R29217C4: got 'n.a.'
## Warning: Expecting numeric in D29218 / R29218C4: got 'n.a.'
## Warning: Expecting numeric in D29219 / R29219C4: got 'n.a.'
## Warning: Expecting numeric in D29220 / R29220C4: got 'n.a.'
## Warning: Expecting numeric in D29221 / R29221C4: got 'n.a.'
## Warning: Expecting numeric in D29222 / R29222C4: got 'n.a.'
## Warning: Expecting numeric in D29223 / R29223C4: got 'n.a.'
## Warning: Expecting numeric in D29224 / R29224C4: got 'n.a.'
## Warning: Expecting numeric in D29225 / R29225C4: got 'n.a.'
## Warning: Expecting numeric in D29226 / R29226C4: got 'n.a.'
## Warning: Expecting numeric in D29227 / R29227C4: got 'n.a.'
## Warning: Expecting numeric in D29228 / R29228C4: got 'n.a.'
## Warning: Expecting numeric in D29229 / R29229C4: got 'n.a.'
## Warning: Expecting numeric in D29230 / R29230C4: got 'n.a.'
## Warning: Expecting numeric in D29231 / R29231C4: got 'n.a.'
## Warning: Expecting numeric in D29232 / R29232C4: got 'n.a.'
## Warning: Expecting numeric in D29233 / R29233C4: got 'n.a.'
## Warning: Expecting numeric in D29234 / R29234C4: got 'n.a.'
## Warning: Expecting numeric in D29235 / R29235C4: got 'n.a.'
## Warning: Expecting numeric in D29236 / R29236C4: got 'n.a.'
## Warning: Expecting numeric in D29237 / R29237C4: got 'n.a.'
## Warning: Expecting numeric in D29238 / R29238C4: got 'n.a.'
## Warning: Expecting numeric in D29239 / R29239C4: got 'n.a.'
## Warning: Expecting numeric in D29240 / R29240C4: got 'n.a.'
## Warning: Expecting numeric in D29241 / R29241C4: got 'n.a.'
## Warning: Expecting numeric in D29242 / R29242C4: got 'n.a.'
## Warning: Expecting numeric in D29243 / R29243C4: got 'n.a.'
## Warning: Expecting numeric in D29244 / R29244C4: got 'n.a.'
## Warning: Expecting numeric in D29245 / R29245C4: got 'n.a.'
## Warning: Expecting numeric in D29246 / R29246C4: got 'n.a.'
## Warning: Expecting numeric in D29247 / R29247C4: got 'n.a.'
## Warning: Expecting numeric in D29248 / R29248C4: got 'n.a.'
## Warning: Expecting numeric in D29249 / R29249C4: got 'n.a.'
## Warning: Expecting numeric in D29250 / R29250C4: got 'n.a.'
## Warning: Expecting numeric in D29251 / R29251C4: got 'n.a.'
## Warning: Expecting numeric in D29252 / R29252C4: got 'n.a.'
## Warning: Expecting numeric in D29253 / R29253C4: got 'n.a.'
## Warning: Expecting numeric in D29254 / R29254C4: got 'n.a.'
## Warning: Expecting numeric in D29255 / R29255C4: got 'n.a.'
## Warning: Expecting numeric in D29256 / R29256C4: got 'n.a.'
## Warning: Expecting numeric in D29257 / R29257C4: got 'n.a.'
## Warning: Expecting numeric in D29258 / R29258C4: got 'n.a.'
## Warning: Expecting numeric in D29259 / R29259C4: got 'n.a.'
## Warning: Expecting numeric in D29260 / R29260C4: got 'n.a.'
## Warning: Expecting numeric in D29261 / R29261C4: got 'n.a.'
## Warning: Expecting numeric in D29262 / R29262C4: got 'n.a.'
## Warning: Expecting numeric in D29263 / R29263C4: got 'n.a.'
## Warning: Expecting numeric in D29264 / R29264C4: got 'n.a.'
## Warning: Expecting numeric in D29265 / R29265C4: got 'n.a.'
## Warning: Expecting numeric in D29266 / R29266C4: got 'n.a.'
## Warning: Expecting numeric in D29267 / R29267C4: got 'n.a.'
## Warning: Expecting numeric in D29268 / R29268C4: got 'n.a.'
## Warning: Expecting numeric in D29269 / R29269C4: got 'n.a.'
## Warning: Expecting numeric in D29270 / R29270C4: got 'n.a.'
## Warning: Expecting numeric in D29271 / R29271C4: got 'n.a.'
## Warning: Expecting numeric in D29272 / R29272C4: got 'n.a.'
## Warning: Expecting numeric in D29273 / R29273C4: got 'n.a.'
## Warning: Expecting numeric in D29274 / R29274C4: got 'n.a.'
## Warning: Expecting numeric in D29275 / R29275C4: got 'n.a.'
## Warning: Expecting numeric in D29276 / R29276C4: got 'n.a.'
## Warning: Expecting numeric in D29277 / R29277C4: got 'n.a.'
## Warning: Expecting numeric in D29278 / R29278C4: got 'n.a.'
## Warning: Expecting numeric in D29279 / R29279C4: got 'n.a.'
## Warning: Expecting numeric in D29280 / R29280C4: got 'n.a.'
## Warning: Expecting numeric in D29281 / R29281C4: got 'n.a.'
## Warning: Expecting numeric in D29282 / R29282C4: got 'n.a.'
## Warning: Expecting numeric in D29283 / R29283C4: got 'n.a.'
## Warning: Expecting numeric in D29284 / R29284C4: got 'n.a.'
## Warning: Expecting numeric in D29285 / R29285C4: got 'n.a.'
## Warning: Expecting numeric in D29286 / R29286C4: got 'n.a.'
## Warning: Expecting numeric in D29287 / R29287C4: got 'n.a.'
## Warning: Expecting numeric in D29288 / R29288C4: got 'n.a.'
## Warning: Expecting numeric in D29289 / R29289C4: got 'n.a.'
## Warning: Expecting numeric in D29290 / R29290C4: got 'n.a.'
## Warning: Expecting numeric in D29291 / R29291C4: got 'n.a.'
## Warning: Expecting numeric in D29292 / R29292C4: got 'n.a.'
## Warning: Expecting numeric in D29293 / R29293C4: got 'n.a.'
## Warning: Expecting numeric in D29294 / R29294C4: got 'n.a.'
## Warning: Expecting numeric in D29295 / R29295C4: got 'n.a.'
## Warning: Expecting numeric in D29296 / R29296C4: got 'n.a.'
## Warning: Expecting numeric in D29297 / R29297C4: got 'n.a.'
## Warning: Expecting numeric in D29298 / R29298C4: got 'n.a.'
## Warning: Expecting numeric in D29299 / R29299C4: got 'n.a.'
## Warning: Expecting numeric in D29300 / R29300C4: got 'n.a.'
## Warning: Expecting numeric in D29301 / R29301C4: got 'n.a.'
## Warning: Expecting numeric in D29302 / R29302C4: got 'n.a.'
## Warning: Expecting numeric in D29303 / R29303C4: got 'n.a.'
## Warning: Expecting numeric in D29304 / R29304C4: got 'n.a.'
## Warning: Expecting numeric in D29305 / R29305C4: got 'n.a.'
## Warning: Expecting numeric in D29306 / R29306C4: got 'n.a.'
## Warning: Expecting numeric in D29307 / R29307C4: got 'n.a.'
## Warning: Expecting numeric in D29308 / R29308C4: got 'n.a.'
## Warning: Expecting numeric in D29309 / R29309C4: got 'n.a.'
## Warning: Expecting numeric in D29310 / R29310C4: got 'n.a.'
## Warning: Expecting numeric in D29311 / R29311C4: got 'n.a.'
## Warning: Expecting numeric in D29312 / R29312C4: got 'n.a.'
## Warning: Expecting numeric in D29313 / R29313C4: got 'n.a.'
## Warning: Expecting numeric in D29314 / R29314C4: got 'n.a.'
## Warning: Expecting numeric in D29315 / R29315C4: got 'n.a.'
## Warning: Expecting numeric in D29316 / R29316C4: got 'n.a.'
## Warning: Expecting numeric in D29317 / R29317C4: got 'n.a.'
## Warning: Expecting numeric in D29318 / R29318C4: got 'n.a.'
## Warning: Expecting numeric in D29319 / R29319C4: got 'n.a.'
## Warning: Expecting numeric in D29320 / R29320C4: got 'n.a.'
## Warning: Expecting numeric in D29321 / R29321C4: got 'n.a.'
## Warning: Expecting numeric in D29322 / R29322C4: got 'n.a.'
## Warning: Expecting numeric in D29323 / R29323C4: got 'n.a.'
## Warning: Expecting numeric in D29324 / R29324C4: got 'n.a.'
## Warning: Expecting numeric in D29325 / R29325C4: got 'n.a.'
## Warning: Expecting numeric in D29326 / R29326C4: got 'n.a.'
## Warning: Expecting numeric in D29327 / R29327C4: got 'n.a.'
## Warning: Expecting numeric in D29328 / R29328C4: got 'n.a.'
## Warning: Expecting numeric in D29329 / R29329C4: got 'n.a.'
## Warning: Expecting numeric in D29330 / R29330C4: got 'n.a.'
## Warning: Expecting numeric in D29331 / R29331C4: got 'n.a.'
## Warning: Expecting numeric in D29332 / R29332C4: got 'n.a.'
## Warning: Expecting numeric in D29333 / R29333C4: got 'n.a.'
## Warning: Expecting numeric in D29334 / R29334C4: got 'n.a.'
## Warning: Expecting numeric in D29335 / R29335C4: got 'n.a.'
## Warning: Expecting numeric in D29336 / R29336C4: got 'n.a.'
## Warning: Expecting numeric in D29337 / R29337C4: got 'n.a.'
## Warning: Expecting numeric in D29338 / R29338C4: got 'n.a.'
## Warning: Expecting numeric in D29339 / R29339C4: got 'n.a.'
## Warning: Expecting numeric in D29340 / R29340C4: got 'n.a.'
## Warning: Expecting numeric in D29341 / R29341C4: got 'n.a.'
## Warning: Expecting numeric in D29342 / R29342C4: got 'n.a.'
## Warning: Expecting numeric in D29343 / R29343C4: got 'n.a.'
## Warning: Expecting numeric in D29344 / R29344C4: got 'n.a.'
## Warning: Expecting numeric in D29345 / R29345C4: got 'n.a.'
## Warning: Expecting numeric in D29346 / R29346C4: got 'n.a.'
## Warning: Expecting numeric in D29347 / R29347C4: got 'n.a.'
## Warning: Expecting numeric in D29348 / R29348C4: got 'n.a.'
## Warning: Expecting numeric in D29349 / R29349C4: got 'n.a.'
## Warning: Expecting numeric in D29350 / R29350C4: got 'n.a.'
## Warning: Expecting numeric in D29351 / R29351C4: got 'n.a.'
## Warning: Expecting numeric in D29352 / R29352C4: got 'n.a.'
## Warning: Expecting numeric in D29353 / R29353C4: got 'n.a.'
## Warning: Expecting numeric in D29354 / R29354C4: got 'n.a.'
## Warning: Expecting numeric in D29355 / R29355C4: got 'n.a.'
## Warning: Expecting numeric in D29356 / R29356C4: got 'n.a.'
## Warning: Expecting numeric in D29357 / R29357C4: got 'n.a.'
## Warning: Expecting numeric in D29358 / R29358C4: got 'n.a.'
## Warning: Expecting numeric in D29359 / R29359C4: got 'n.a.'
## Warning: Expecting numeric in D29360 / R29360C4: got 'n.a.'
## Warning: Expecting numeric in D29361 / R29361C4: got 'n.a.'
## Warning: Expecting numeric in D29362 / R29362C4: got 'n.a.'
## Warning: Expecting numeric in D29363 / R29363C4: got 'n.a.'
## Warning: Expecting numeric in D29364 / R29364C4: got 'n.a.'
## Warning: Expecting numeric in D29365 / R29365C4: got 'n.a.'
## Warning: Expecting numeric in D29366 / R29366C4: got 'n.a.'
## Warning: Expecting numeric in D29367 / R29367C4: got 'n.a.'
## Warning: Expecting numeric in D29368 / R29368C4: got 'n.a.'
## Warning: Expecting numeric in D29369 / R29369C4: got 'n.a.'
## Warning: Expecting numeric in D29370 / R29370C4: got 'n.a.'
## Warning: Expecting numeric in D29371 / R29371C4: got 'n.a.'
## Warning: Expecting numeric in D29372 / R29372C4: got 'n.a.'
## Warning: Expecting numeric in D29373 / R29373C4: got 'n.a.'
## Warning: Expecting numeric in D29374 / R29374C4: got 'n.a.'
## Warning: Expecting numeric in D29375 / R29375C4: got 'n.a.'
## Warning: Expecting numeric in D29376 / R29376C4: got 'n.a.'
## Warning: Expecting numeric in D29377 / R29377C4: got 'n.a.'
## Warning: Expecting numeric in D29378 / R29378C4: got 'n.a.'
## Warning: Expecting numeric in D29379 / R29379C4: got 'n.a.'
## Warning: Expecting numeric in D29380 / R29380C4: got 'n.a.'
## Warning: Expecting numeric in D29381 / R29381C4: got 'n.a.'
## Warning: Expecting numeric in D29382 / R29382C4: got 'n.a.'
## Warning: Expecting numeric in D29383 / R29383C4: got 'n.a.'
## Warning: Expecting numeric in D29384 / R29384C4: got 'n.a.'
## Warning: Expecting numeric in D29385 / R29385C4: got 'n.a.'
## Warning: Expecting numeric in D29386 / R29386C4: got 'n.a.'
## Warning: Expecting numeric in D29387 / R29387C4: got 'n.a.'
## Warning: Expecting numeric in D29388 / R29388C4: got 'n.a.'
## Warning: Expecting numeric in D29389 / R29389C4: got 'n.a.'
## Warning: Expecting numeric in D29390 / R29390C4: got 'n.a.'
## Warning: Expecting numeric in D29391 / R29391C4: got 'n.a.'
## Warning: Expecting numeric in D29392 / R29392C4: got 'n.a.'
## Warning: Expecting numeric in D29393 / R29393C4: got 'n.a.'
## Warning: Expecting numeric in D29394 / R29394C4: got 'n.a.'
## Warning: Expecting numeric in D29395 / R29395C4: got 'n.a.'
## Warning: Expecting numeric in D29396 / R29396C4: got 'n.a.'
## Warning: Expecting numeric in D29397 / R29397C4: got 'n.a.'
## Warning: Expecting numeric in D29398 / R29398C4: got 'n.a.'
## Warning: Expecting numeric in D29399 / R29399C4: got 'n.a.'
## Warning: Expecting numeric in D29400 / R29400C4: got 'n.a.'
## Warning: Expecting numeric in D29401 / R29401C4: got 'n.a.'
## Warning: Expecting numeric in D29402 / R29402C4: got 'n.a.'
## Warning: Expecting numeric in D29403 / R29403C4: got 'n.a.'
## Warning: Expecting numeric in D29404 / R29404C4: got 'n.a.'
## Warning: Expecting numeric in D29405 / R29405C4: got 'n.a.'
## Warning: Expecting numeric in D29406 / R29406C4: got 'n.a.'
## Warning: Expecting numeric in D29407 / R29407C4: got 'n.a.'
## Warning: Expecting numeric in D29408 / R29408C4: got 'n.a.'
## Warning: Expecting numeric in D29409 / R29409C4: got 'n.a.'
## Warning: Expecting numeric in D29410 / R29410C4: got 'n.a.'
## Warning: Expecting numeric in D29411 / R29411C4: got 'n.a.'
## Warning: Expecting numeric in D29412 / R29412C4: got 'n.a.'
## Warning: Expecting numeric in D29413 / R29413C4: got 'n.a.'
## Warning: Expecting numeric in D29414 / R29414C4: got 'n.a.'
## Warning: Expecting numeric in D29415 / R29415C4: got 'n.a.'
## Warning: Expecting numeric in D29416 / R29416C4: got 'n.a.'
## Warning: Expecting numeric in D29417 / R29417C4: got 'n.a.'
## Warning: Expecting numeric in D29418 / R29418C4: got 'n.a.'
## Warning: Expecting numeric in D29419 / R29419C4: got 'n.a.'
## Warning: Expecting numeric in D29420 / R29420C4: got 'n.a.'
## Warning: Expecting numeric in D29421 / R29421C4: got 'n.a.'
## Warning: Expecting numeric in D29422 / R29422C4: got 'n.a.'
## Warning: Expecting numeric in D29423 / R29423C4: got 'n.a.'
## Warning: Expecting numeric in D29424 / R29424C4: got 'n.a.'
## Warning: Expecting numeric in D29425 / R29425C4: got 'n.a.'
## Warning: Expecting numeric in D29426 / R29426C4: got 'n.a.'
## Warning: Expecting numeric in D29427 / R29427C4: got 'n.a.'
## Warning: Expecting numeric in D29428 / R29428C4: got 'n.a.'
## Warning: Expecting numeric in D29429 / R29429C4: got 'n.a.'
## Warning: Expecting numeric in D29430 / R29430C4: got 'n.a.'
## Warning: Expecting numeric in D29431 / R29431C4: got 'n.a.'
## Warning: Expecting numeric in D29432 / R29432C4: got 'n.a.'
## Warning: Expecting numeric in D29433 / R29433C4: got 'n.a.'
## Warning: Expecting numeric in D29434 / R29434C4: got 'n.a.'
## Warning: Expecting numeric in D29435 / R29435C4: got 'n.a.'
## Warning: Expecting numeric in D29436 / R29436C4: got 'n.a.'
## Warning: Expecting numeric in D29437 / R29437C4: got 'n.a.'
## Warning: Expecting numeric in D29438 / R29438C4: got 'n.a.'
## Warning: Expecting numeric in D29439 / R29439C4: got 'n.a.'
## Warning: Expecting numeric in D29440 / R29440C4: got 'n.a.'
## Warning: Expecting numeric in D29441 / R29441C4: got 'n.a.'
## Warning: Expecting numeric in D29442 / R29442C4: got 'n.a.'
## Warning: Expecting numeric in D29443 / R29443C4: got 'n.a.'
## Warning: Expecting numeric in D29444 / R29444C4: got 'n.a.'
## Warning: Expecting numeric in D29445 / R29445C4: got 'n.a.'
## Warning: Expecting numeric in D29446 / R29446C4: got 'n.a.'
## Warning: Expecting numeric in D29447 / R29447C4: got 'n.a.'
## Warning: Expecting numeric in D29448 / R29448C4: got 'n.a.'
## Warning: Expecting numeric in D29449 / R29449C4: got 'n.a.'
## Warning: Expecting numeric in D29450 / R29450C4: got 'n.a.'
## Warning: Expecting numeric in D29451 / R29451C4: got 'n.a.'
## Warning: Expecting numeric in D29452 / R29452C4: got 'n.a.'
## Warning: Expecting numeric in D29453 / R29453C4: got 'n.a.'
## Warning: Expecting numeric in D29454 / R29454C4: got 'n.a.'
## Warning: Expecting numeric in D29455 / R29455C4: got 'n.a.'
## Warning: Expecting numeric in D29456 / R29456C4: got 'n.a.'
## Warning: Expecting numeric in D29457 / R29457C4: got 'n.a.'
## Warning: Expecting numeric in D29458 / R29458C4: got 'n.a.'
## Warning: Expecting numeric in D29459 / R29459C4: got 'n.a.'
## Warning: Expecting numeric in D29460 / R29460C4: got 'n.a.'
## Warning: Expecting numeric in D29461 / R29461C4: got 'n.a.'
## Warning: Expecting numeric in D29462 / R29462C4: got 'n.a.'
## Warning: Expecting numeric in D29463 / R29463C4: got 'n.a.'
## Warning: Expecting numeric in D29464 / R29464C4: got 'n.a.'
## Warning: Expecting numeric in D29465 / R29465C4: got 'n.a.'
## Warning: Expecting numeric in D29466 / R29466C4: got 'n.a.'
## Warning: Expecting numeric in D29467 / R29467C4: got 'n.a.'
## Warning: Expecting numeric in D29468 / R29468C4: got 'n.a.'
## Warning: Expecting numeric in D29469 / R29469C4: got 'n.a.'
## Warning: Expecting numeric in D29470 / R29470C4: got 'n.a.'
## Warning: Expecting numeric in D29471 / R29471C4: got 'n.a.'
## Warning: Expecting numeric in D29472 / R29472C4: got 'n.a.'
## Warning: Expecting numeric in D29473 / R29473C4: got 'n.a.'
## Warning: Expecting numeric in D29474 / R29474C4: got 'n.a.'
## Warning: Expecting numeric in D29475 / R29475C4: got 'n.a.'
## Warning: Expecting numeric in D29476 / R29476C4: got 'n.a.'
## Warning: Expecting numeric in D29477 / R29477C4: got 'n.a.'
## Warning: Expecting numeric in D29478 / R29478C4: got 'n.a.'
## Warning: Expecting numeric in D29479 / R29479C4: got 'n.a.'
## Warning: Expecting numeric in D29480 / R29480C4: got 'n.a.'
## Warning: Expecting numeric in D29481 / R29481C4: got 'n.a.'
## Warning: Expecting numeric in D29482 / R29482C4: got 'n.a.'
## Warning: Expecting numeric in D29483 / R29483C4: got 'n.a.'
## Warning: Expecting numeric in D29484 / R29484C4: got 'n.a.'
## Warning: Expecting numeric in D29485 / R29485C4: got 'n.a.'
## Warning: Expecting numeric in D29486 / R29486C4: got 'n.a.'
## Warning: Expecting numeric in D29487 / R29487C4: got 'n.a.'
## Warning: Expecting numeric in D29488 / R29488C4: got 'n.a.'
## Warning: Expecting numeric in D29489 / R29489C4: got 'n.a.'
## Warning: Expecting numeric in D29490 / R29490C4: got 'n.a.'
## Warning: Expecting numeric in D29491 / R29491C4: got 'n.a.'
## Warning: Expecting numeric in D29492 / R29492C4: got 'n.a.'
## Warning: Expecting numeric in D29493 / R29493C4: got 'n.a.'
## Warning: Expecting numeric in D29494 / R29494C4: got 'n.a.'
## Warning: Expecting numeric in D29495 / R29495C4: got 'n.a.'
## Warning: Expecting numeric in D29496 / R29496C4: got 'n.a.'
## Warning: Expecting numeric in D29497 / R29497C4: got 'n.a.'
## Warning: Expecting numeric in D29498 / R29498C4: got 'n.a.'
## Warning: Expecting numeric in D29499 / R29499C4: got 'n.a.'
## Warning: Expecting numeric in D29500 / R29500C4: got 'n.a.'
## Warning: Expecting numeric in D29501 / R29501C4: got 'n.a.'
## Warning: Expecting numeric in D29502 / R29502C4: got 'n.a.'
## Warning: Expecting numeric in D29503 / R29503C4: got 'n.a.'
## Warning: Expecting numeric in D29504 / R29504C4: got 'n.a.'
## Warning: Expecting numeric in D29505 / R29505C4: got 'n.a.'
## Warning: Expecting numeric in D29506 / R29506C4: got 'n.a.'
## Warning: Expecting numeric in D29507 / R29507C4: got 'n.a.'
## Warning: Expecting numeric in D29508 / R29508C4: got 'n.a.'
## Warning: Expecting numeric in D29509 / R29509C4: got 'n.a.'
## Warning: Expecting numeric in D29510 / R29510C4: got 'n.a.'
## Warning: Expecting numeric in D29511 / R29511C4: got 'n.a.'
## Warning: Expecting numeric in D29512 / R29512C4: got 'n.a.'
## Warning: Expecting numeric in D29513 / R29513C4: got 'n.a.'
## Warning: Expecting numeric in D29514 / R29514C4: got 'n.a.'
## Warning: Expecting numeric in D29515 / R29515C4: got 'n.a.'
## Warning: Expecting numeric in D29516 / R29516C4: got 'n.a.'
## Warning: Expecting numeric in D29517 / R29517C4: got 'n.a.'
## Warning: Expecting numeric in D29518 / R29518C4: got 'n.a.'
## Warning: Expecting numeric in D29519 / R29519C4: got 'n.a.'
## Warning: Expecting numeric in D29520 / R29520C4: got 'n.a.'
## Warning: Expecting numeric in D29521 / R29521C4: got 'n.a.'
## Warning: Expecting numeric in D29522 / R29522C4: got 'n.a.'
## Warning: Expecting numeric in D29523 / R29523C4: got 'n.a.'
## Warning: Expecting numeric in D29524 / R29524C4: got 'n.a.'
## Warning: Expecting numeric in D29525 / R29525C4: got 'n.a.'
## Warning: Expecting numeric in D29526 / R29526C4: got 'n.a.'
## Warning: Expecting numeric in D29527 / R29527C4: got 'n.a.'
## Warning: Expecting numeric in D29528 / R29528C4: got 'n.a.'
## Warning: Expecting numeric in D29529 / R29529C4: got 'n.a.'
## Warning: Expecting numeric in D29530 / R29530C4: got 'n.a.'
## Warning: Expecting numeric in D29531 / R29531C4: got 'n.a.'
## Warning: Expecting numeric in D29532 / R29532C4: got 'n.a.'
## Warning: Expecting numeric in D29533 / R29533C4: got 'n.a.'
## Warning: Expecting numeric in D29534 / R29534C4: got 'n.a.'
## Warning: Expecting numeric in D29535 / R29535C4: got 'n.a.'
## Warning: Expecting numeric in D29536 / R29536C4: got 'n.a.'
## Warning: Expecting numeric in D29537 / R29537C4: got 'n.a.'
## Warning: Expecting numeric in D29538 / R29538C4: got 'n.a.'
## Warning: Expecting numeric in D29539 / R29539C4: got 'n.a.'
## Warning: Expecting numeric in D29540 / R29540C4: got 'n.a.'
## Warning: Expecting numeric in D29541 / R29541C4: got 'n.a.'
## Warning: Expecting numeric in D29542 / R29542C4: got 'n.a.'
## Warning: Expecting numeric in D29543 / R29543C4: got 'n.a.'
## Warning: Expecting numeric in D29544 / R29544C4: got 'n.a.'
## Warning: Expecting numeric in D29545 / R29545C4: got 'n.a.'
## Warning: Expecting numeric in D29546 / R29546C4: got 'n.a.'
## Warning: Expecting numeric in D29547 / R29547C4: got 'n.a.'
## Warning: Expecting numeric in D29548 / R29548C4: got 'n.a.'
## Warning: Expecting numeric in D29549 / R29549C4: got 'n.a.'
## Warning: Expecting numeric in D29550 / R29550C4: got 'n.a.'
## Warning: Expecting numeric in D29551 / R29551C4: got 'n.a.'
## Warning: Expecting numeric in D29552 / R29552C4: got 'n.a.'
## Warning: Expecting numeric in D29553 / R29553C4: got 'n.a.'
## Warning: Expecting numeric in D29554 / R29554C4: got 'n.a.'
## Warning: Expecting numeric in D29555 / R29555C4: got 'n.a.'
## Warning: Expecting numeric in D29556 / R29556C4: got 'n.a.'
## Warning: Expecting numeric in D29557 / R29557C4: got 'n.a.'
## Warning: Expecting numeric in D29558 / R29558C4: got 'n.a.'
## Warning: Expecting numeric in D29559 / R29559C4: got 'n.a.'
## Warning: Expecting numeric in D29560 / R29560C4: got 'n.a.'
## Warning: Expecting numeric in D29561 / R29561C4: got 'n.a.'
## Warning: Expecting numeric in D29562 / R29562C4: got 'n.a.'
## Warning: Expecting numeric in D29563 / R29563C4: got 'n.a.'
## Warning: Expecting numeric in D29564 / R29564C4: got 'n.a.'
## Warning: Expecting numeric in D29565 / R29565C4: got 'n.a.'
## Warning: Expecting numeric in D29566 / R29566C4: got 'n.a.'
## Warning: Expecting numeric in D29567 / R29567C4: got 'n.a.'
## Warning: Expecting numeric in D29568 / R29568C4: got 'n.a.'
## Warning: Expecting numeric in D29569 / R29569C4: got 'n.a.'
## Warning: Expecting numeric in D29570 / R29570C4: got 'n.a.'
## Warning: Expecting numeric in D29571 / R29571C4: got 'n.a.'
## Warning: Expecting numeric in D29572 / R29572C4: got 'n.a.'
## Warning: Expecting numeric in D29573 / R29573C4: got 'n.a.'
## Warning: Expecting numeric in D29574 / R29574C4: got 'n.a.'
## Warning: Expecting numeric in D29575 / R29575C4: got 'n.a.'
## Warning: Expecting numeric in D29576 / R29576C4: got 'n.a.'
## Warning: Expecting numeric in D29577 / R29577C4: got 'n.a.'
## Warning: Expecting numeric in D29578 / R29578C4: got 'n.a.'
## Warning: Expecting numeric in D29579 / R29579C4: got 'n.a.'
## Warning: Expecting numeric in D29580 / R29580C4: got 'n.a.'
## Warning: Expecting numeric in D29581 / R29581C4: got 'n.a.'
## Warning: Expecting numeric in D29582 / R29582C4: got 'n.a.'
## Warning: Expecting numeric in D29583 / R29583C4: got 'n.a.'
## Warning: Expecting numeric in D29584 / R29584C4: got 'n.a.'
## Warning: Expecting numeric in D29585 / R29585C4: got 'n.a.'
## Warning: Expecting numeric in D29586 / R29586C4: got 'n.a.'
## Warning: Expecting numeric in D29587 / R29587C4: got 'n.a.'
## Warning: Expecting numeric in D29588 / R29588C4: got 'n.a.'
## Warning: Expecting numeric in D29589 / R29589C4: got 'n.a.'
## Warning: Expecting numeric in D29590 / R29590C4: got 'n.a.'
## Warning: Expecting numeric in D29591 / R29591C4: got 'n.a.'
## Warning: Expecting numeric in D29592 / R29592C4: got 'n.a.'
## Warning: Expecting numeric in D29593 / R29593C4: got 'n.a.'
## Warning: Expecting numeric in D29594 / R29594C4: got 'n.a.'
## Warning: Expecting numeric in D29595 / R29595C4: got 'n.a.'
## Warning: Expecting numeric in D29596 / R29596C4: got 'n.a.'
## Warning: Expecting numeric in D29597 / R29597C4: got 'n.a.'
## Warning: Expecting numeric in D29598 / R29598C4: got 'n.a.'
## Warning: Expecting numeric in D29599 / R29599C4: got 'n.a.'
## Warning: Expecting numeric in D29600 / R29600C4: got 'n.a.'
## Warning: Expecting numeric in D29601 / R29601C4: got 'n.a.'
## Warning: Expecting numeric in D29602 / R29602C4: got 'n.a.'
## Warning: Expecting numeric in D29603 / R29603C4: got 'n.a.'
## Warning: Expecting numeric in D29604 / R29604C4: got 'n.a.'
## Warning: Expecting numeric in D29605 / R29605C4: got 'n.a.'
## Warning: Expecting numeric in D29606 / R29606C4: got 'n.a.'
## Warning: Expecting numeric in D29607 / R29607C4: got 'n.a.'
## Warning: Expecting numeric in D29608 / R29608C4: got 'n.a.'
## Warning: Expecting numeric in D29609 / R29609C4: got 'n.a.'
## Warning: Expecting numeric in D29610 / R29610C4: got 'n.a.'
## Warning: Expecting numeric in D29611 / R29611C4: got 'n.a.'
## Warning: Expecting numeric in D29612 / R29612C4: got 'n.a.'
## Warning: Expecting numeric in D29613 / R29613C4: got 'n.a.'
## Warning: Expecting numeric in D29614 / R29614C4: got 'n.a.'
## Warning: Expecting numeric in D29615 / R29615C4: got 'n.a.'
## Warning: Expecting numeric in D29616 / R29616C4: got 'n.a.'
## Warning: Expecting numeric in D29617 / R29617C4: got 'n.a.'
## Warning: Expecting numeric in D29618 / R29618C4: got 'n.a.'
## Warning: Expecting numeric in D29619 / R29619C4: got 'n.a.'
## Warning: Expecting numeric in D29620 / R29620C4: got 'n.a.'
## Warning: Expecting numeric in D29621 / R29621C4: got 'n.a.'
## Warning: Expecting numeric in D29622 / R29622C4: got 'n.a.'
## Warning: Expecting numeric in D29623 / R29623C4: got 'n.a.'
## Warning: Expecting numeric in D29624 / R29624C4: got 'n.a.'
## Warning: Expecting numeric in D29625 / R29625C4: got 'n.a.'
## Warning: Expecting numeric in D29626 / R29626C4: got 'n.a.'
## Warning: Expecting numeric in D29627 / R29627C4: got 'n.a.'
## Warning: Expecting numeric in D29628 / R29628C4: got 'n.a.'
## Warning: Expecting numeric in D29629 / R29629C4: got 'n.a.'
## Warning: Expecting numeric in D29630 / R29630C4: got 'n.a.'
## Warning: Expecting numeric in D29631 / R29631C4: got 'n.a.'
## Warning: Expecting numeric in D29632 / R29632C4: got 'n.a.'
## Warning: Expecting numeric in D29633 / R29633C4: got 'n.a.'
## Warning: Expecting numeric in D29634 / R29634C4: got 'n.a.'
## Warning: Expecting numeric in D29635 / R29635C4: got 'n.a.'
## Warning: Expecting numeric in D29636 / R29636C4: got 'n.a.'
## Warning: Expecting numeric in D29637 / R29637C4: got 'n.a.'
## Warning: Expecting numeric in D29638 / R29638C4: got 'n.a.'
## Warning: Expecting numeric in D29639 / R29639C4: got 'n.a.'
## Warning: Expecting numeric in D29640 / R29640C4: got 'n.a.'
## Warning: Expecting numeric in D29641 / R29641C4: got 'n.a.'
## Warning: Expecting numeric in D29642 / R29642C4: got 'n.a.'
## Warning: Expecting numeric in D29643 / R29643C4: got 'n.a.'
## Warning: Expecting numeric in D29644 / R29644C4: got 'n.a.'
## Warning: Expecting numeric in D29645 / R29645C4: got 'n.a.'
## Warning: Expecting numeric in D29646 / R29646C4: got 'n.a.'
## Warning: Expecting numeric in D29647 / R29647C4: got 'n.a.'
## Warning: Expecting numeric in D29648 / R29648C4: got 'n.a.'
## Warning: Expecting numeric in D29649 / R29649C4: got 'n.a.'
## Warning: Expecting numeric in D29650 / R29650C4: got 'n.a.'
## Warning: Expecting numeric in D29651 / R29651C4: got 'n.a.'
## Warning: Expecting numeric in D29652 / R29652C4: got 'n.a.'
## Warning: Expecting numeric in D29653 / R29653C4: got 'n.a.'
## Warning: Expecting numeric in D29654 / R29654C4: got 'n.a.'
## Warning: Expecting numeric in D29655 / R29655C4: got 'n.a.'
## Warning: Expecting numeric in D29656 / R29656C4: got 'n.a.'
## Warning: Expecting numeric in D29657 / R29657C4: got 'n.a.'
## Warning: Expecting numeric in D29658 / R29658C4: got 'n.a.'
## Warning: Expecting numeric in D29659 / R29659C4: got 'n.a.'
## Warning: Expecting numeric in D29660 / R29660C4: got 'n.a.'
## Warning: Expecting numeric in D29661 / R29661C4: got 'n.a.'
## Warning: Expecting numeric in D29662 / R29662C4: got 'n.a.'
## Warning: Expecting numeric in D29663 / R29663C4: got 'n.a.'
## Warning: Expecting numeric in D29664 / R29664C4: got 'n.a.'
## Warning: Expecting numeric in D29665 / R29665C4: got 'n.a.'
## Warning: Expecting numeric in D29666 / R29666C4: got 'n.a.'
## Warning: Expecting numeric in D29667 / R29667C4: got 'n.a.'
## Warning: Expecting numeric in D29668 / R29668C4: got 'n.a.'
## Warning: Expecting numeric in D29669 / R29669C4: got 'n.a.'
## Warning: Expecting numeric in D29670 / R29670C4: got 'n.a.'
## Warning: Expecting numeric in D29671 / R29671C4: got 'n.a.'
## Warning: Expecting numeric in D29672 / R29672C4: got 'n.a.'
## Warning: Expecting numeric in D29673 / R29673C4: got 'n.a.'
## Warning: Expecting numeric in D29674 / R29674C4: got 'n.a.'
## Warning: Expecting numeric in D29675 / R29675C4: got 'n.a.'
## Warning: Expecting numeric in D29676 / R29676C4: got 'n.a.'
## Warning: Expecting numeric in D29677 / R29677C4: got 'n.a.'
## Warning: Expecting numeric in D29678 / R29678C4: got 'n.a.'
## Warning: Expecting numeric in D29679 / R29679C4: got 'n.a.'
## Warning: Expecting numeric in D29680 / R29680C4: got 'n.a.'
## Warning: Expecting numeric in D29681 / R29681C4: got 'n.a.'
## Warning: Expecting numeric in D29682 / R29682C4: got 'n.a.'
## Warning: Expecting numeric in D29683 / R29683C4: got 'n.a.'
## Warning: Expecting numeric in D29684 / R29684C4: got 'n.a.'
## Warning: Expecting numeric in D29685 / R29685C4: got 'n.a.'
## Warning: Expecting numeric in D29686 / R29686C4: got 'n.a.'
## Warning: Expecting numeric in D29687 / R29687C4: got 'n.a.'
## Warning: Expecting numeric in D29688 / R29688C4: got 'n.a.'
## Warning: Expecting numeric in D29689 / R29689C4: got 'n.a.'
## Warning: Expecting numeric in D29690 / R29690C4: got 'n.a.'
## Warning: Expecting numeric in D29691 / R29691C4: got 'n.a.'
## Warning: Expecting numeric in D29692 / R29692C4: got 'n.a.'
## Warning: Expecting numeric in D29693 / R29693C4: got 'n.a.'
## Warning: Expecting numeric in D29694 / R29694C4: got 'n.a.'
## Warning: Expecting numeric in D29695 / R29695C4: got 'n.a.'
## Warning: Expecting numeric in D29696 / R29696C4: got 'n.a.'
## Warning: Expecting numeric in D29697 / R29697C4: got 'n.a.'
## Warning: Expecting numeric in D29698 / R29698C4: got 'n.a.'
## Warning: Expecting numeric in D29699 / R29699C4: got 'n.a.'
## Warning: Expecting numeric in D29700 / R29700C4: got 'n.a.'
## Warning: Expecting numeric in D29701 / R29701C4: got 'n.a.'
## Warning: Expecting numeric in D29702 / R29702C4: got 'n.a.'
## Warning: Expecting numeric in D29703 / R29703C4: got 'n.a.'
## Warning: Expecting numeric in D29704 / R29704C4: got 'n.a.'
## Warning: Expecting numeric in D29705 / R29705C4: got 'n.a.'
## Warning: Expecting numeric in D29706 / R29706C4: got 'n.a.'
## Warning: Expecting numeric in D29707 / R29707C4: got 'n.a.'
## Warning: Expecting numeric in D29708 / R29708C4: got 'n.a.'
## Warning: Expecting numeric in D29709 / R29709C4: got 'n.a.'
## Warning: Expecting numeric in D29710 / R29710C4: got 'n.a.'
## Warning: Expecting numeric in D29711 / R29711C4: got 'n.a.'
## Warning: Expecting numeric in D29712 / R29712C4: got 'n.a.'
## Warning: Expecting numeric in D29713 / R29713C4: got 'n.a.'
## Warning: Expecting numeric in D29714 / R29714C4: got 'n.a.'
## Warning: Expecting numeric in D29715 / R29715C4: got 'n.a.'
## Warning: Expecting numeric in D29716 / R29716C4: got 'n.a.'
## Warning: Expecting numeric in D29717 / R29717C4: got 'n.a.'
## Warning: Expecting numeric in D29718 / R29718C4: got 'n.a.'
## Warning: Expecting numeric in D29719 / R29719C4: got 'n.a.'
## Warning: Expecting numeric in D29720 / R29720C4: got 'n.a.'
## Warning: Expecting numeric in D29721 / R29721C4: got 'n.a.'
## Warning: Expecting numeric in D29722 / R29722C4: got 'n.a.'
## Warning: Expecting numeric in D29723 / R29723C4: got 'n.a.'
## Warning: Expecting numeric in D29724 / R29724C4: got 'n.a.'
## Warning: Expecting numeric in D29725 / R29725C4: got 'n.a.'
## Warning: Expecting numeric in D29726 / R29726C4: got 'n.a.'
## Warning: Expecting numeric in D29727 / R29727C4: got 'n.a.'
## Warning: Expecting numeric in D29728 / R29728C4: got 'n.a.'
## Warning: Expecting numeric in D29729 / R29729C4: got 'n.a.'
## Warning: Expecting numeric in D29730 / R29730C4: got 'n.a.'
## Warning: Expecting numeric in D29731 / R29731C4: got 'n.a.'
## Warning: Expecting numeric in D29732 / R29732C4: got 'n.a.'
## Warning: Expecting numeric in D29733 / R29733C4: got 'n.a.'
## Warning: Expecting numeric in D29734 / R29734C4: got 'n.a.'
## Warning: Expecting numeric in D29735 / R29735C4: got 'n.a.'
## Warning: Expecting numeric in D29736 / R29736C4: got 'n.a.'
## Warning: Expecting numeric in D29737 / R29737C4: got 'n.a.'
## Warning: Expecting numeric in D29738 / R29738C4: got 'n.a.'
## Warning: Expecting numeric in D29739 / R29739C4: got 'n.a.'
## Warning: Expecting numeric in D29740 / R29740C4: got 'n.a.'
## Warning: Expecting numeric in D29741 / R29741C4: got 'n.a.'
## Warning: Expecting numeric in D29742 / R29742C4: got 'n.a.'
## Warning: Expecting numeric in D29743 / R29743C4: got 'n.a.'
## Warning: Expecting numeric in D29744 / R29744C4: got 'n.a.'
## Warning: Expecting numeric in D29745 / R29745C4: got 'n.a.'
## Warning: Expecting numeric in D29746 / R29746C4: got 'n.a.'
## Warning: Expecting numeric in D29747 / R29747C4: got 'n.a.'
## Warning: Expecting numeric in D29748 / R29748C4: got 'n.a.'
## Warning: Expecting numeric in D29749 / R29749C4: got 'n.a.'
## Warning: Expecting numeric in D29750 / R29750C4: got 'n.a.'
## Warning: Expecting numeric in D29751 / R29751C4: got 'n.a.'
## Warning: Expecting numeric in D29752 / R29752C4: got 'n.a.'
## Warning: Expecting numeric in D29753 / R29753C4: got 'n.a.'
## Warning: Expecting numeric in D29754 / R29754C4: got 'n.a.'
## Warning: Expecting numeric in D29755 / R29755C4: got 'n.a.'
## Warning: Expecting numeric in D29756 / R29756C4: got 'n.a.'
## Warning: Expecting numeric in D29757 / R29757C4: got 'n.a.'
## Warning: Expecting numeric in D29758 / R29758C4: got 'n.a.'
## Warning: Expecting numeric in D29759 / R29759C4: got 'n.a.'
## Warning: Expecting numeric in D29760 / R29760C4: got 'n.a.'
## Warning: Expecting numeric in D29761 / R29761C4: got 'n.a.'
## Warning: Expecting numeric in D29762 / R29762C4: got 'n.a.'
## Warning: Expecting numeric in D29763 / R29763C4: got 'n.a.'
## Warning: Expecting numeric in D29764 / R29764C4: got 'n.a.'
## Warning: Expecting numeric in D29765 / R29765C4: got 'n.a.'
## Warning: Expecting numeric in D29766 / R29766C4: got 'n.a.'
## Warning: Expecting numeric in D29767 / R29767C4: got 'n.a.'
## Warning: Expecting numeric in D29768 / R29768C4: got 'n.a.'
## Warning: Expecting numeric in D29769 / R29769C4: got 'n.a.'
## Warning: Expecting numeric in D29770 / R29770C4: got 'n.a.'
## Warning: Expecting numeric in D29771 / R29771C4: got 'n.a.'
## Warning: Expecting numeric in D29772 / R29772C4: got 'n.a.'
## Warning: Expecting numeric in D29773 / R29773C4: got 'n.a.'
## Warning: Expecting numeric in D29774 / R29774C4: got 'n.a.'
## Warning: Expecting numeric in D29775 / R29775C4: got 'n.a.'
## Warning: Expecting numeric in D29776 / R29776C4: got 'n.a.'
## Warning: Expecting numeric in D29777 / R29777C4: got 'n.a.'
## Warning: Expecting numeric in D29778 / R29778C4: got 'n.a.'
## Warning: Expecting numeric in D29779 / R29779C4: got 'n.a.'
## Warning: Expecting numeric in D29780 / R29780C4: got 'n.a.'
## Warning: Expecting numeric in D29781 / R29781C4: got 'n.a.'
## Warning: Expecting numeric in D29782 / R29782C4: got 'n.a.'
## Warning: Expecting numeric in D29783 / R29783C4: got 'n.a.'
## Warning: Expecting numeric in D29784 / R29784C4: got 'n.a.'
## Warning: Expecting numeric in D29785 / R29785C4: got 'n.a.'
## Warning: Expecting numeric in D29786 / R29786C4: got 'n.a.'
## Warning: Expecting numeric in D29787 / R29787C4: got 'n.a.'
## Warning: Expecting numeric in D29788 / R29788C4: got 'n.a.'
## Warning: Expecting numeric in D29789 / R29789C4: got 'n.a.'
## Warning: Expecting numeric in D29790 / R29790C4: got 'n.a.'
## Warning: Expecting numeric in D29791 / R29791C4: got 'n.a.'
## Warning: Expecting numeric in D29792 / R29792C4: got 'n.a.'
## Warning: Expecting numeric in D29793 / R29793C4: got 'n.a.'
## Warning: Expecting numeric in D29794 / R29794C4: got 'n.a.'
## Warning: Expecting numeric in D29795 / R29795C4: got 'n.a.'
## Warning: Expecting numeric in D29796 / R29796C4: got 'n.a.'
## Warning: Expecting numeric in D29797 / R29797C4: got 'n.a.'
## Warning: Expecting numeric in D29798 / R29798C4: got 'n.a.'
## Warning: Expecting numeric in D29799 / R29799C4: got 'n.a.'
## Warning: Expecting numeric in D29800 / R29800C4: got 'n.a.'
## Warning: Expecting numeric in D29801 / R29801C4: got 'n.a.'
## Warning: Expecting numeric in D29802 / R29802C4: got 'n.a.'
## Warning: Expecting numeric in D29803 / R29803C4: got 'n.a.'
## Warning: Expecting numeric in D29804 / R29804C4: got 'n.a.'
## Warning: Expecting numeric in D29805 / R29805C4: got 'n.a.'
## Warning: Expecting numeric in D29806 / R29806C4: got 'n.a.'
## Warning: Expecting numeric in D29807 / R29807C4: got 'n.a.'
## Warning: Expecting numeric in D29808 / R29808C4: got 'n.a.'
## Warning: Expecting numeric in D29809 / R29809C4: got 'n.a.'
## Warning: Expecting numeric in D29810 / R29810C4: got 'n.a.'
## Warning: Expecting numeric in D29811 / R29811C4: got 'n.a.'
## Warning: Expecting numeric in D29812 / R29812C4: got 'n.a.'
## Warning: Expecting numeric in D29813 / R29813C4: got 'n.a.'
## Warning: Expecting numeric in D29814 / R29814C4: got 'n.a.'
## Warning: Expecting numeric in D29815 / R29815C4: got 'n.a.'
## Warning: Expecting numeric in D29816 / R29816C4: got 'n.a.'
## Warning: Expecting numeric in D29817 / R29817C4: got 'n.a.'
## Warning: Expecting numeric in D29818 / R29818C4: got 'n.a.'
## Warning: Expecting numeric in D29819 / R29819C4: got 'n.a.'
## Warning: Expecting numeric in D29820 / R29820C4: got 'n.a.'
## Warning: Expecting numeric in D29821 / R29821C4: got 'n.a.'
## Warning: Expecting numeric in D29822 / R29822C4: got 'n.a.'
## Warning: Expecting numeric in D29823 / R29823C4: got 'n.a.'
## Warning: Expecting numeric in D29824 / R29824C4: got 'n.a.'
## Warning: Expecting numeric in D29825 / R29825C4: got 'n.a.'
## Warning: Expecting numeric in D29826 / R29826C4: got 'n.a.'
## Warning: Expecting numeric in D29827 / R29827C4: got 'n.a.'
## Warning: Expecting numeric in D29828 / R29828C4: got 'n.a.'
## Warning: Expecting numeric in D29829 / R29829C4: got 'n.a.'
## Warning: Expecting numeric in D29830 / R29830C4: got 'n.a.'
## Warning: Expecting numeric in D29831 / R29831C4: got 'n.a.'
## Warning: Expecting numeric in D29832 / R29832C4: got 'n.a.'
## Warning: Expecting numeric in D29833 / R29833C4: got 'n.a.'
## Warning: Expecting numeric in D29834 / R29834C4: got 'n.a.'
## Warning: Expecting numeric in D29835 / R29835C4: got 'n.a.'
## Warning: Expecting numeric in D29836 / R29836C4: got 'n.a.'
## Warning: Expecting numeric in D29837 / R29837C4: got 'n.a.'
## Warning: Expecting numeric in D29838 / R29838C4: got 'n.a.'
## Warning: Expecting numeric in D29839 / R29839C4: got 'n.a.'
## Warning: Expecting numeric in D29840 / R29840C4: got 'n.a.'
## Warning: Expecting numeric in D29841 / R29841C4: got 'n.a.'
## Warning: Expecting numeric in D29842 / R29842C4: got 'n.a.'
## Warning: Expecting numeric in D29843 / R29843C4: got 'n.a.'
## Warning: Expecting numeric in D29844 / R29844C4: got 'n.a.'
## Warning: Expecting numeric in D29845 / R29845C4: got 'n.a.'
## Warning: Expecting numeric in D29846 / R29846C4: got 'n.a.'
## Warning: Expecting numeric in D29847 / R29847C4: got 'n.a.'
## Warning: Expecting numeric in D29848 / R29848C4: got 'n.a.'
## Warning: Expecting numeric in D29849 / R29849C4: got 'n.a.'
## Warning: Expecting numeric in D29850 / R29850C4: got 'n.a.'
## Warning: Expecting numeric in D29851 / R29851C4: got 'n.a.'
## Warning: Expecting numeric in D29852 / R29852C4: got 'n.a.'
## Warning: Expecting numeric in D29853 / R29853C4: got 'n.a.'
## Warning: Expecting numeric in D29854 / R29854C4: got 'n.a.'
## Warning: Expecting numeric in D29855 / R29855C4: got 'n.a.'
## Warning: Expecting numeric in D29856 / R29856C4: got 'n.a.'
## Warning: Expecting numeric in D29857 / R29857C4: got 'n.a.'
## Warning: Expecting numeric in D29858 / R29858C4: got 'n.a.'
## Warning: Expecting numeric in D29859 / R29859C4: got 'n.a.'
## Warning: Expecting numeric in D29860 / R29860C4: got 'n.a.'
## Warning: Expecting numeric in D29861 / R29861C4: got 'n.a.'
## Warning: Expecting numeric in D29862 / R29862C4: got 'n.a.'
## Warning: Expecting numeric in D29863 / R29863C4: got 'n.a.'
## Warning: Expecting numeric in D29864 / R29864C4: got 'n.a.'
## Warning: Expecting numeric in D29865 / R29865C4: got 'n.a.'
## Warning: Expecting numeric in D29866 / R29866C4: got 'n.a.'
## Warning: Expecting numeric in D29867 / R29867C4: got 'n.a.'
## Warning: Expecting numeric in D29868 / R29868C4: got 'n.a.'
## Warning: Expecting numeric in D29869 / R29869C4: got 'n.a.'
## Warning: Expecting numeric in D29870 / R29870C4: got 'n.a.'
## Warning: Expecting numeric in D29871 / R29871C4: got 'n.a.'
## Warning: Expecting numeric in D29872 / R29872C4: got 'n.a.'
## Warning: Expecting numeric in D29873 / R29873C4: got 'n.a.'
## Warning: Expecting numeric in D29874 / R29874C4: got 'n.a.'
## Warning: Expecting numeric in D29875 / R29875C4: got 'n.a.'
## Warning: Expecting numeric in D29876 / R29876C4: got 'n.a.'
## Warning: Expecting numeric in D29877 / R29877C4: got 'n.a.'
## Warning: Expecting numeric in D29878 / R29878C4: got 'n.a.'
## Warning: Expecting numeric in D29879 / R29879C4: got 'n.a.'
## Warning: Expecting numeric in D29880 / R29880C4: got 'n.a.'
## Warning: Expecting numeric in D29881 / R29881C4: got 'n.a.'
## Warning: Expecting numeric in D29882 / R29882C4: got 'n.a.'
## Warning: Expecting numeric in D29883 / R29883C4: got 'n.a.'
## Warning: Expecting numeric in D29884 / R29884C4: got 'n.a.'
## Warning: Expecting numeric in D29885 / R29885C4: got 'n.a.'
## Warning: Expecting numeric in D29886 / R29886C4: got 'n.a.'
## Warning: Expecting numeric in D29887 / R29887C4: got 'n.a.'
## Warning: Expecting numeric in D29888 / R29888C4: got 'n.a.'
## Warning: Expecting numeric in D29889 / R29889C4: got 'n.a.'
## Warning: Expecting numeric in D29890 / R29890C4: got 'n.a.'
## Warning: Expecting numeric in D29891 / R29891C4: got 'n.a.'
## Warning: Expecting numeric in D29892 / R29892C4: got 'n.a.'
## Warning: Expecting numeric in D29893 / R29893C4: got 'n.a.'
## Warning: Expecting numeric in D29894 / R29894C4: got 'n.a.'
## Warning: Expecting numeric in D29895 / R29895C4: got 'n.a.'
## Warning: Expecting numeric in D29896 / R29896C4: got 'n.a.'
## Warning: Expecting numeric in D29897 / R29897C4: got 'n.a.'
## Warning: Expecting numeric in D29898 / R29898C4: got 'n.a.'
## Warning: Expecting numeric in D29899 / R29899C4: got 'n.a.'
## Warning: Expecting numeric in D29900 / R29900C4: got 'n.a.'
## Warning: Expecting numeric in D29901 / R29901C4: got 'n.a.'
## Warning: Expecting numeric in D29902 / R29902C4: got 'n.a.'
## Warning: Expecting numeric in D29903 / R29903C4: got 'n.a.'
## Warning: Expecting numeric in D29904 / R29904C4: got 'n.a.'
## Warning: Expecting numeric in D29905 / R29905C4: got 'n.a.'
## Warning: Expecting numeric in D29906 / R29906C4: got 'n.a.'
## Warning: Expecting numeric in D29907 / R29907C4: got 'n.a.'
## Warning: Expecting numeric in D29908 / R29908C4: got 'n.a.'
## Warning: Expecting numeric in D29909 / R29909C4: got 'n.a.'
## Warning: Expecting numeric in D29910 / R29910C4: got 'n.a.'
## Warning: Expecting numeric in D29911 / R29911C4: got 'n.a.'
## Warning: Expecting numeric in D29912 / R29912C4: got 'n.a.'
## Warning: Expecting numeric in D29913 / R29913C4: got 'n.a.'
## Warning: Expecting numeric in D29914 / R29914C4: got 'n.a.'
## Warning: Expecting numeric in D29915 / R29915C4: got 'n.a.'
## Warning: Expecting numeric in D29916 / R29916C4: got 'n.a.'
## Warning: Expecting numeric in D29917 / R29917C4: got 'n.a.'
## Warning: Expecting numeric in D29918 / R29918C4: got 'n.a.'
## Warning: Expecting numeric in D29919 / R29919C4: got 'n.a.'
## Warning: Expecting numeric in D29920 / R29920C4: got 'n.a.'
## Warning: Expecting numeric in D29921 / R29921C4: got 'n.a.'
## Warning: Expecting numeric in D29922 / R29922C4: got 'n.a.'
## Warning: Expecting numeric in D29923 / R29923C4: got 'n.a.'
## Warning: Expecting numeric in D29924 / R29924C4: got 'n.a.'
## Warning: Expecting numeric in D29925 / R29925C4: got 'n.a.'
## Warning: Expecting numeric in D29926 / R29926C4: got 'n.a.'
## Warning: Expecting numeric in D29927 / R29927C4: got 'n.a.'
## Warning: Expecting numeric in D29928 / R29928C4: got 'n.a.'
## Warning: Expecting numeric in D29929 / R29929C4: got 'n.a.'
## Warning: Expecting numeric in D29930 / R29930C4: got 'n.a.'
## Warning: Expecting numeric in D29931 / R29931C4: got 'n.a.'
## Warning: Expecting numeric in D29932 / R29932C4: got 'n.a.'
## Warning: Expecting numeric in D29933 / R29933C4: got 'n.a.'
## Warning: Expecting numeric in D29934 / R29934C4: got 'n.a.'
## Warning: Expecting numeric in D29935 / R29935C4: got 'n.a.'
## Warning: Expecting numeric in D29936 / R29936C4: got 'n.a.'
## Warning: Expecting numeric in D29937 / R29937C4: got 'n.a.'
## Warning: Expecting numeric in D29938 / R29938C4: got 'n.a.'
## Warning: Expecting numeric in D29939 / R29939C4: got 'n.a.'
## Warning: Expecting numeric in D29940 / R29940C4: got 'n.a.'
## Warning: Expecting numeric in D29941 / R29941C4: got 'n.a.'
## Warning: Expecting numeric in D29942 / R29942C4: got 'n.a.'
## Warning: Expecting numeric in D29943 / R29943C4: got 'n.a.'
## Warning: Expecting numeric in D29944 / R29944C4: got 'n.a.'
## Warning: Expecting numeric in D29945 / R29945C4: got 'n.a.'
## Warning: Expecting numeric in D29946 / R29946C4: got 'n.a.'
## Warning: Expecting numeric in D29947 / R29947C4: got 'n.a.'
## Warning: Expecting numeric in D29948 / R29948C4: got 'n.a.'
## Warning: Expecting numeric in D29949 / R29949C4: got 'n.a.'
## Warning: Expecting numeric in D29950 / R29950C4: got 'n.a.'
## Warning: Expecting numeric in D29951 / R29951C4: got 'n.a.'
## Warning: Expecting numeric in D29952 / R29952C4: got 'n.a.'
## Warning: Expecting numeric in D29953 / R29953C4: got 'n.a.'
## Warning: Expecting numeric in D29954 / R29954C4: got 'n.a.'
## Warning: Expecting numeric in D29955 / R29955C4: got 'n.a.'
## Warning: Expecting numeric in D29956 / R29956C4: got 'n.a.'
## Warning: Expecting numeric in D29957 / R29957C4: got 'n.a.'
## Warning: Expecting numeric in D29958 / R29958C4: got 'n.a.'
## Warning: Expecting numeric in D29959 / R29959C4: got 'n.a.'
## Warning: Expecting numeric in D29960 / R29960C4: got 'n.a.'
## Warning: Expecting numeric in D29961 / R29961C4: got 'n.a.'
## Warning: Expecting numeric in D29962 / R29962C4: got 'n.a.'
## Warning: Expecting numeric in D29963 / R29963C4: got 'n.a.'
## Warning: Expecting numeric in D29964 / R29964C4: got 'n.a.'
## Warning: Expecting numeric in D29965 / R29965C4: got 'n.a.'
## Warning: Expecting numeric in D29966 / R29966C4: got 'n.a.'
## Warning: Expecting numeric in D29967 / R29967C4: got 'n.a.'
## Warning: Expecting numeric in D29968 / R29968C4: got 'n.a.'
## Warning: Expecting numeric in D29969 / R29969C4: got 'n.a.'
## Warning: Expecting numeric in D29970 / R29970C4: got 'n.a.'
## Warning: Expecting numeric in D29971 / R29971C4: got 'n.a.'
## Warning: Expecting numeric in D29972 / R29972C4: got 'n.a.'
## Warning: Expecting numeric in D29973 / R29973C4: got 'n.a.'
## Warning: Expecting numeric in D29974 / R29974C4: got 'n.a.'
## Warning: Expecting numeric in D29975 / R29975C4: got 'n.a.'
## Warning: Expecting numeric in D29976 / R29976C4: got 'n.a.'
## Warning: Expecting numeric in D29977 / R29977C4: got 'n.a.'
## Warning: Expecting numeric in D29978 / R29978C4: got 'n.a.'
## Warning: Expecting numeric in D29979 / R29979C4: got 'n.a.'
## Warning: Expecting numeric in D29980 / R29980C4: got 'n.a.'
## Warning: Expecting numeric in D29981 / R29981C4: got 'n.a.'
## Warning: Expecting numeric in D29982 / R29982C4: got 'n.a.'
## Warning: Expecting numeric in D29983 / R29983C4: got 'n.a.'
## Warning: Expecting numeric in D29984 / R29984C4: got 'n.a.'
## Warning: Expecting numeric in D29985 / R29985C4: got 'n.a.'
## Warning: Expecting numeric in D29986 / R29986C4: got 'n.a.'
## Warning: Expecting numeric in D29987 / R29987C4: got 'n.a.'
## Warning: Expecting numeric in D29988 / R29988C4: got 'n.a.'
## Warning: Expecting numeric in D29989 / R29989C4: got 'n.a.'
## Warning: Expecting numeric in D29990 / R29990C4: got 'n.a.'
## Warning: Expecting numeric in D29991 / R29991C4: got 'n.a.'
## Warning: Expecting numeric in D29992 / R29992C4: got 'n.a.'
## Warning: Expecting numeric in D29993 / R29993C4: got 'n.a.'
## Warning: Expecting numeric in D29994 / R29994C4: got 'n.a.'
## Warning: Expecting numeric in D29995 / R29995C4: got 'n.a.'
## Warning: Expecting numeric in D29996 / R29996C4: got 'n.a.'
## Warning: Expecting numeric in D29997 / R29997C4: got 'n.a.'
## Warning: Expecting numeric in D29998 / R29998C4: got 'n.a.'
## Warning: Expecting numeric in D29999 / R29999C4: got 'n.a.'
## Warning: Expecting numeric in D30000 / R30000C4: got 'n.a.'
## Warning: Expecting numeric in D30001 / R30001C4: got 'n.a.'
## Warning: Expecting numeric in D30002 / R30002C4: got 'n.a.'
## Warning: Expecting numeric in D30003 / R30003C4: got 'n.a.'
## Warning: Expecting numeric in D30004 / R30004C4: got 'n.a.'
## Warning: Expecting numeric in D30005 / R30005C4: got 'n.a.'
## Warning: Expecting numeric in D30006 / R30006C4: got 'n.a.'
## Warning: Expecting numeric in D30007 / R30007C4: got 'n.a.'
## Warning: Expecting numeric in D30008 / R30008C4: got 'n.a.'
## Warning: Expecting numeric in D30009 / R30009C4: got 'n.a.'
## Warning: Expecting numeric in D30010 / R30010C4: got 'n.a.'
## Warning: Expecting numeric in D30011 / R30011C4: got 'n.a.'
## Warning: Expecting numeric in D30012 / R30012C4: got 'n.a.'
## Warning: Expecting numeric in D30013 / R30013C4: got 'n.a.'
## Warning: Expecting numeric in D30014 / R30014C4: got 'n.a.'
## Warning: Expecting numeric in D30015 / R30015C4: got 'n.a.'
## Warning: Expecting numeric in D30016 / R30016C4: got 'n.a.'
## Warning: Expecting numeric in D30017 / R30017C4: got 'n.a.'
## Warning: Expecting numeric in D30018 / R30018C4: got 'n.a.'
## Warning: Expecting numeric in D30019 / R30019C4: got 'n.a.'
## Warning: Expecting numeric in D30020 / R30020C4: got 'n.a.'
## Warning: Expecting numeric in D30021 / R30021C4: got 'n.a.'
## Warning: Expecting numeric in D30022 / R30022C4: got 'n.a.'
## Warning: Expecting numeric in D30023 / R30023C4: got 'n.a.'
## Warning: Expecting numeric in D30024 / R30024C4: got 'n.a.'
## Warning: Expecting numeric in D30025 / R30025C4: got 'n.a.'
## Warning: Expecting numeric in D30026 / R30026C4: got 'n.a.'
## Warning: Expecting numeric in D30027 / R30027C4: got 'n.a.'
## Warning: Expecting numeric in D30028 / R30028C4: got 'n.a.'
## Warning: Expecting numeric in D30029 / R30029C4: got 'n.a.'
## Warning: Expecting numeric in D30030 / R30030C4: got 'n.a.'
## Warning: Expecting numeric in D30031 / R30031C4: got 'n.a.'
## Warning: Expecting numeric in D30032 / R30032C4: got 'n.a.'
## Warning: Expecting numeric in D30033 / R30033C4: got 'n.a.'
## Warning: Expecting numeric in D30034 / R30034C4: got 'n.a.'
## Warning: Expecting numeric in D30035 / R30035C4: got 'n.a.'
## Warning: Expecting numeric in D30036 / R30036C4: got 'n.a.'
## Warning: Expecting numeric in D30037 / R30037C4: got 'n.a.'
## Warning: Expecting numeric in D30038 / R30038C4: got 'n.a.'
## Warning: Expecting numeric in D30039 / R30039C4: got 'n.a.'
## Warning: Expecting numeric in D30040 / R30040C4: got 'n.a.'
## Warning: Expecting numeric in D30041 / R30041C4: got 'n.a.'
## Warning: Expecting numeric in D30042 / R30042C4: got 'n.a.'
## Warning: Expecting numeric in D30043 / R30043C4: got 'n.a.'
## Warning: Expecting numeric in D30044 / R30044C4: got 'n.a.'
## Warning: Expecting numeric in D30045 / R30045C4: got 'n.a.'
## Warning: Expecting numeric in D30046 / R30046C4: got 'n.a.'
## Warning: Expecting numeric in D30047 / R30047C4: got 'n.a.'
## Warning: Expecting numeric in D30048 / R30048C4: got 'n.a.'
## Warning: Expecting numeric in D30049 / R30049C4: got 'n.a.'
## Warning: Expecting numeric in D30050 / R30050C4: got 'n.a.'
## Warning: Expecting numeric in D30051 / R30051C4: got 'n.a.'
## Warning: Expecting numeric in D30052 / R30052C4: got 'n.a.'
## Warning: Expecting numeric in D30053 / R30053C4: got 'n.a.'
## Warning: Expecting numeric in D30054 / R30054C4: got 'n.a.'
## Warning: Expecting numeric in D30055 / R30055C4: got 'n.a.'
## Warning: Expecting numeric in D30056 / R30056C4: got 'n.a.'
## Warning: Expecting numeric in D30057 / R30057C4: got 'n.a.'
## Warning: Expecting numeric in D30058 / R30058C4: got 'n.a.'
## Warning: Expecting numeric in D30059 / R30059C4: got 'n.a.'
## Warning: Expecting numeric in D30060 / R30060C4: got 'n.a.'
## Warning: Expecting numeric in D30061 / R30061C4: got 'n.a.'
## Warning: Expecting numeric in D30062 / R30062C4: got 'n.a.'
## Warning: Expecting numeric in D30063 / R30063C4: got 'n.a.'
## Warning: Expecting numeric in D30064 / R30064C4: got 'n.a.'
## Warning: Expecting numeric in D30065 / R30065C4: got 'n.a.'
## Warning: Expecting numeric in D30066 / R30066C4: got 'n.a.'
## Warning: Expecting numeric in D30067 / R30067C4: got 'n.a.'
## Warning: Expecting numeric in D30068 / R30068C4: got 'n.a.'
## Warning: Expecting numeric in D30069 / R30069C4: got 'n.a.'
## Warning: Expecting numeric in D30070 / R30070C4: got 'n.a.'
## Warning: Expecting numeric in D30071 / R30071C4: got 'n.a.'
## Warning: Expecting numeric in D30072 / R30072C4: got 'n.a.'
## Warning: Expecting numeric in D30073 / R30073C4: got 'n.a.'
## Warning: Expecting numeric in D30074 / R30074C4: got 'n.a.'
## Warning: Expecting numeric in D30075 / R30075C4: got 'n.a.'
## Warning: Expecting numeric in D30076 / R30076C4: got 'n.a.'
## Warning: Expecting numeric in D30077 / R30077C4: got 'n.a.'
## Warning: Expecting numeric in D30078 / R30078C4: got 'n.a.'
## Warning: Expecting numeric in D30079 / R30079C4: got 'n.a.'
## Warning: Expecting numeric in D30080 / R30080C4: got 'n.a.'
## Warning: Expecting numeric in D30081 / R30081C4: got 'n.a.'
## Warning: Expecting numeric in D30082 / R30082C4: got 'n.a.'
## Warning: Expecting numeric in D30083 / R30083C4: got 'n.a.'
## Warning: Expecting numeric in D30084 / R30084C4: got 'n.a.'
## Warning: Expecting numeric in D30085 / R30085C4: got 'n.a.'
## Warning: Expecting numeric in D30086 / R30086C4: got 'n.a.'
## Warning: Expecting numeric in D30087 / R30087C4: got 'n.a.'
## Warning: Expecting numeric in D30088 / R30088C4: got 'n.a.'
## Warning: Expecting numeric in D30089 / R30089C4: got 'n.a.'
## Warning: Expecting numeric in D30090 / R30090C4: got 'n.a.'
## Warning: Expecting numeric in D30091 / R30091C4: got 'n.a.'
## Warning: Expecting numeric in D30092 / R30092C4: got 'n.a.'
## Warning: Expecting numeric in D30093 / R30093C4: got 'n.a.'
## Warning: Expecting numeric in D30094 / R30094C4: got 'n.a.'
## Warning: Expecting numeric in D30095 / R30095C4: got 'n.a.'
## Warning: Expecting numeric in D30096 / R30096C4: got 'n.a.'
## Warning: Expecting numeric in D30097 / R30097C4: got 'n.a.'
## Warning: Expecting numeric in D30098 / R30098C4: got 'n.a.'
## Warning: Expecting numeric in D30099 / R30099C4: got 'n.a.'
## Warning: Expecting numeric in D30100 / R30100C4: got 'n.a.'
## Warning: Expecting numeric in D30101 / R30101C4: got 'n.a.'
## Warning: Expecting numeric in D30102 / R30102C4: got 'n.a.'
## Warning: Expecting numeric in D30103 / R30103C4: got 'n.a.'
## Warning: Expecting numeric in D30104 / R30104C4: got 'n.a.'
## Warning: Expecting numeric in D30105 / R30105C4: got 'n.a.'
## Warning: Expecting numeric in D30106 / R30106C4: got 'n.a.'
## Warning: Expecting numeric in D30107 / R30107C4: got 'n.a.'
## Warning: Expecting numeric in D30108 / R30108C4: got 'n.a.'
## Warning: Expecting numeric in D30109 / R30109C4: got 'n.a.'
## Warning: Expecting numeric in D30110 / R30110C4: got 'n.a.'
## Warning: Expecting numeric in D30111 / R30111C4: got 'n.a.'
## Warning: Expecting numeric in D30112 / R30112C4: got 'n.a.'
## Warning: Expecting numeric in D30113 / R30113C4: got 'n.a.'
## Warning: Expecting numeric in D30114 / R30114C4: got 'n.a.'
## Warning: Expecting numeric in D30115 / R30115C4: got 'n.a.'
## Warning: Expecting numeric in D30116 / R30116C4: got 'n.a.'
## Warning: Expecting numeric in D30117 / R30117C4: got 'n.a.'
## Warning: Expecting numeric in D30118 / R30118C4: got 'n.a.'
## Warning: Expecting numeric in D30119 / R30119C4: got 'n.a.'
## Warning: Expecting numeric in D30120 / R30120C4: got 'n.a.'
## Warning: Expecting numeric in D30121 / R30121C4: got 'n.a.'
## Warning: Expecting numeric in D30122 / R30122C4: got 'n.a.'
## Warning: Expecting numeric in D30123 / R30123C4: got 'n.a.'
## Warning: Expecting numeric in D30124 / R30124C4: got 'n.a.'
## Warning: Expecting numeric in D30125 / R30125C4: got 'n.a.'
## Warning: Expecting numeric in D30126 / R30126C4: got 'n.a.'
## Warning: Expecting numeric in D30127 / R30127C4: got 'n.a.'
## Warning: Expecting numeric in D30128 / R30128C4: got 'n.a.'
## Warning: Expecting numeric in D30129 / R30129C4: got 'n.a.'
## Warning: Expecting numeric in D30130 / R30130C4: got 'n.a.'
## Warning: Expecting numeric in D30131 / R30131C4: got 'n.a.'
## Warning: Expecting numeric in D30132 / R30132C4: got 'n.a.'
## Warning: Expecting numeric in D30133 / R30133C4: got 'n.a.'
## Warning: Expecting numeric in D30134 / R30134C4: got 'n.a.'
## Warning: Expecting numeric in D30135 / R30135C4: got 'n.a.'
## Warning: Expecting numeric in D30136 / R30136C4: got 'n.a.'
## Warning: Expecting numeric in D30137 / R30137C4: got 'n.a.'
## Warning: Expecting numeric in D30138 / R30138C4: got 'n.a.'
## Warning: Expecting numeric in D30139 / R30139C4: got 'n.a.'
## Warning: Expecting numeric in D30140 / R30140C4: got 'n.a.'
## Warning: Expecting numeric in D30141 / R30141C4: got 'n.a.'
## Warning: Expecting numeric in D30142 / R30142C4: got 'n.a.'
## Warning: Expecting numeric in D30143 / R30143C4: got 'n.a.'
## Warning: Expecting numeric in D30144 / R30144C4: got 'n.a.'
## Warning: Expecting numeric in D30145 / R30145C4: got 'n.a.'
## Warning: Expecting numeric in D30146 / R30146C4: got 'n.a.'
## Warning: Expecting numeric in D30147 / R30147C4: got 'n.a.'
## Warning: Expecting numeric in D30148 / R30148C4: got 'n.a.'
## Warning: Expecting numeric in D30149 / R30149C4: got 'n.a.'
## Warning: Expecting numeric in D30150 / R30150C4: got 'n.a.'
## Warning: Expecting numeric in D30151 / R30151C4: got 'n.a.'
## Warning: Expecting numeric in D30152 / R30152C4: got 'n.a.'
## Warning: Expecting numeric in D30153 / R30153C4: got 'n.a.'
## Warning: Expecting numeric in D30154 / R30154C4: got 'n.a.'
## Warning: Expecting numeric in D30155 / R30155C4: got 'n.a.'
## Warning: Expecting numeric in D30156 / R30156C4: got 'n.a.'
## Warning: Expecting numeric in D30157 / R30157C4: got 'n.a.'
## Warning: Expecting numeric in D30158 / R30158C4: got 'n.a.'
## Warning: Expecting numeric in D30159 / R30159C4: got 'n.a.'
## Warning: Expecting numeric in D30160 / R30160C4: got 'n.a.'
## Warning: Expecting numeric in D30161 / R30161C4: got 'n.a.'
## Warning: Expecting numeric in D30162 / R30162C4: got 'n.a.'
## Warning: Expecting numeric in D30163 / R30163C4: got 'n.a.'
## Warning: Expecting numeric in D30164 / R30164C4: got 'n.a.'
## Warning: Expecting numeric in D30165 / R30165C4: got 'n.a.'
## Warning: Expecting numeric in D30166 / R30166C4: got 'n.a.'
## Warning: Expecting numeric in D30167 / R30167C4: got 'n.a.'
## Warning: Expecting numeric in D30168 / R30168C4: got 'n.a.'
## Warning: Expecting numeric in D30169 / R30169C4: got 'n.a.'
## Warning: Expecting numeric in D30170 / R30170C4: got 'n.a.'
## Warning: Expecting numeric in D30171 / R30171C4: got 'n.a.'
## Warning: Expecting numeric in D30172 / R30172C4: got 'n.a.'
## Warning: Expecting numeric in D30173 / R30173C4: got 'n.a.'
## Warning: Expecting numeric in D30174 / R30174C4: got 'n.a.'
## Warning: Expecting numeric in D30175 / R30175C4: got 'n.a.'
## Warning: Expecting numeric in D30176 / R30176C4: got 'n.a.'
## Warning: Expecting numeric in D30177 / R30177C4: got 'n.a.'
## Warning: Expecting numeric in D30178 / R30178C4: got 'n.a.'
## Warning: Expecting numeric in D30179 / R30179C4: got 'n.a.'
## Warning: Expecting numeric in D30180 / R30180C4: got 'n.a.'
## Warning: Expecting numeric in D30181 / R30181C4: got 'n.a.'
## Warning: Expecting numeric in D30182 / R30182C4: got 'n.a.'
## Warning: Expecting numeric in D30183 / R30183C4: got 'n.a.'
## Warning: Expecting numeric in D30184 / R30184C4: got 'n.a.'
## Warning: Expecting numeric in D30185 / R30185C4: got 'n.a.'
## Warning: Expecting numeric in D30186 / R30186C4: got 'n.a.'
## Warning: Expecting numeric in D30187 / R30187C4: got 'n.a.'
## Warning: Expecting numeric in D30188 / R30188C4: got 'n.a.'
## Warning: Expecting numeric in D30189 / R30189C4: got 'n.a.'
## Warning: Expecting numeric in D30190 / R30190C4: got 'n.a.'
## Warning: Expecting numeric in D30191 / R30191C4: got 'n.a.'
## Warning: Expecting numeric in D30192 / R30192C4: got 'n.a.'
## Warning: Expecting numeric in D30193 / R30193C4: got 'n.a.'
## Warning: Expecting numeric in D30194 / R30194C4: got 'n.a.'
## Warning: Expecting numeric in D30195 / R30195C4: got 'n.a.'
## Warning: Expecting numeric in D30196 / R30196C4: got 'n.a.'
## Warning: Expecting numeric in D30197 / R30197C4: got 'n.a.'
## Warning: Expecting numeric in D30198 / R30198C4: got 'n.a.'
## Warning: Expecting numeric in D30199 / R30199C4: got 'n.a.'
## Warning: Expecting numeric in D30200 / R30200C4: got 'n.a.'
## Warning: Expecting numeric in D30201 / R30201C4: got 'n.a.'
## Warning: Expecting numeric in D30202 / R30202C4: got 'n.a.'
## Warning: Expecting numeric in D30203 / R30203C4: got 'n.a.'
## Warning: Expecting numeric in D30204 / R30204C4: got 'n.a.'
## Warning: Expecting numeric in D30205 / R30205C4: got 'n.a.'
## Warning: Expecting numeric in D30206 / R30206C4: got 'n.a.'
## Warning: Expecting numeric in D30207 / R30207C4: got 'n.a.'
## Warning: Expecting numeric in D30208 / R30208C4: got 'n.a.'
## Warning: Expecting numeric in D30209 / R30209C4: got 'n.a.'
## Warning: Expecting numeric in D30210 / R30210C4: got 'n.a.'
## Warning: Expecting numeric in D30211 / R30211C4: got 'n.a.'
## Warning: Expecting numeric in D30212 / R30212C4: got 'n.a.'
## Warning: Expecting numeric in D30213 / R30213C4: got 'n.a.'
## Warning: Expecting numeric in D30214 / R30214C4: got 'n.a.'
## Warning: Expecting numeric in D30215 / R30215C4: got 'n.a.'
## Warning: Expecting numeric in D30216 / R30216C4: got 'n.a.'
## Warning: Expecting numeric in D30217 / R30217C4: got 'n.a.'
## Warning: Expecting numeric in D30218 / R30218C4: got 'n.a.'
## Warning: Expecting numeric in D30219 / R30219C4: got 'n.a.'
## Warning: Expecting numeric in D30220 / R30220C4: got 'n.a.'
## Warning: Expecting numeric in D30221 / R30221C4: got 'n.a.'
## Warning: Expecting numeric in D30222 / R30222C4: got 'n.a.'
## Warning: Expecting numeric in D30223 / R30223C4: got 'n.a.'
## Warning: Expecting numeric in D30224 / R30224C4: got 'n.a.'
## Warning: Expecting numeric in D30225 / R30225C4: got 'n.a.'
## Warning: Expecting numeric in D30226 / R30226C4: got 'n.a.'
## Warning: Expecting numeric in D30227 / R30227C4: got 'n.a.'
## Warning: Expecting numeric in D30228 / R30228C4: got 'n.a.'
## Warning: Expecting numeric in D30229 / R30229C4: got 'n.a.'
## Warning: Expecting numeric in D30230 / R30230C4: got 'n.a.'
## Warning: Expecting numeric in D30231 / R30231C4: got 'n.a.'
## Warning: Expecting numeric in D30232 / R30232C4: got 'n.a.'
## Warning: Expecting numeric in D30233 / R30233C4: got 'n.a.'
## Warning: Expecting numeric in D30234 / R30234C4: got 'n.a.'
## Warning: Expecting numeric in D30235 / R30235C4: got 'n.a.'
## Warning: Expecting numeric in D30236 / R30236C4: got 'n.a.'
## Warning: Expecting numeric in D30237 / R30237C4: got 'n.a.'
## Warning: Expecting numeric in D30238 / R30238C4: got 'n.a.'
## Warning: Expecting numeric in D30239 / R30239C4: got 'n.a.'
## Warning: Expecting numeric in D30240 / R30240C4: got 'n.a.'
## Warning: Expecting numeric in D30241 / R30241C4: got 'n.a.'
## Warning: Expecting numeric in D30242 / R30242C4: got 'n.a.'
## Warning: Expecting numeric in D30243 / R30243C4: got 'n.a.'
## Warning: Expecting numeric in D30244 / R30244C4: got 'n.a.'
## Warning: Expecting numeric in D30245 / R30245C4: got 'n.a.'
## Warning: Expecting numeric in D30246 / R30246C4: got 'n.a.'
## Warning: Expecting numeric in D30247 / R30247C4: got 'n.a.'
## Warning: Expecting numeric in D30248 / R30248C4: got 'n.a.'
## Warning: Expecting numeric in D30249 / R30249C4: got 'n.a.'
## Warning: Expecting numeric in D30250 / R30250C4: got 'n.a.'
## Warning: Expecting numeric in D30251 / R30251C4: got 'n.a.'
## Warning: Expecting numeric in D30252 / R30252C4: got 'n.a.'
## Warning: Expecting numeric in D30253 / R30253C4: got 'n.a.'
## Warning: Expecting numeric in D30254 / R30254C4: got 'n.a.'
## Warning: Expecting numeric in D30255 / R30255C4: got 'n.a.'
## Warning: Expecting numeric in D30256 / R30256C4: got 'n.a.'
## Warning: Expecting numeric in D30257 / R30257C4: got 'n.a.'
## Warning: Expecting numeric in D30258 / R30258C4: got 'n.a.'
## Warning: Expecting numeric in D30259 / R30259C4: got 'n.a.'
## Warning: Expecting numeric in D30260 / R30260C4: got 'n.a.'
## Warning: Expecting numeric in D30261 / R30261C4: got 'n.a.'
## Warning: Expecting numeric in D30262 / R30262C4: got 'n.a.'
## Warning: Expecting numeric in D30263 / R30263C4: got 'n.a.'
## Warning: Expecting numeric in D30264 / R30264C4: got 'n.a.'
## Warning: Expecting numeric in D30265 / R30265C4: got 'n.a.'
## Warning: Expecting numeric in D30266 / R30266C4: got 'n.a.'
## Warning: Expecting numeric in D30267 / R30267C4: got 'n.a.'
## Warning: Expecting numeric in D30268 / R30268C4: got 'n.a.'
## Warning: Expecting numeric in D30269 / R30269C4: got 'n.a.'
## Warning: Expecting numeric in D30270 / R30270C4: got 'n.a.'
## Warning: Expecting numeric in D30271 / R30271C4: got 'n.a.'
## Warning: Expecting numeric in D30272 / R30272C4: got 'n.a.'
## Warning: Expecting numeric in D30273 / R30273C4: got 'n.a.'
## Warning: Expecting numeric in D30274 / R30274C4: got 'n.a.'
## Warning: Expecting numeric in D30275 / R30275C4: got 'n.a.'
## Warning: Expecting numeric in D30276 / R30276C4: got 'n.a.'
## Warning: Expecting numeric in D30277 / R30277C4: got 'n.a.'
## Warning: Expecting numeric in D30278 / R30278C4: got 'n.a.'
## Warning: Expecting numeric in D30279 / R30279C4: got 'n.a.'
## Warning: Expecting numeric in D30280 / R30280C4: got 'n.a.'
## Warning: Expecting numeric in D30281 / R30281C4: got 'n.a.'
## Warning: Expecting numeric in D30282 / R30282C4: got 'n.a.'
## Warning: Expecting numeric in D30283 / R30283C4: got 'n.a.'
## Warning: Expecting numeric in D30284 / R30284C4: got 'n.a.'
## Warning: Expecting numeric in D30285 / R30285C4: got 'n.a.'
## Warning: Expecting numeric in D30286 / R30286C4: got 'n.a.'
## Warning: Expecting numeric in D30287 / R30287C4: got 'n.a.'
## Warning: Expecting numeric in D30288 / R30288C4: got 'n.a.'
## Warning: Expecting numeric in D30289 / R30289C4: got 'n.a.'
## Warning: Expecting numeric in D30290 / R30290C4: got 'n.a.'
## Warning: Expecting numeric in D30291 / R30291C4: got 'n.a.'
## Warning: Expecting numeric in D30292 / R30292C4: got 'n.a.'
## Warning: Expecting numeric in D30293 / R30293C4: got 'n.a.'
## Warning: Expecting numeric in D30294 / R30294C4: got 'n.a.'
## Warning: Expecting numeric in D30295 / R30295C4: got 'n.a.'
## Warning: Expecting numeric in D30296 / R30296C4: got 'n.a.'
## Warning: Expecting numeric in D30297 / R30297C4: got 'n.a.'
## Warning: Expecting numeric in D30298 / R30298C4: got 'n.a.'
## Warning: Expecting numeric in D30299 / R30299C4: got 'n.a.'
## Warning: Expecting numeric in D30300 / R30300C4: got 'n.a.'
## Warning: Expecting numeric in D30301 / R30301C4: got 'n.a.'
## Warning: Expecting numeric in D30302 / R30302C4: got 'n.a.'
## Warning: Expecting numeric in D30303 / R30303C4: got 'n.a.'
## Warning: Expecting numeric in D30304 / R30304C4: got 'n.a.'
## Warning: Expecting numeric in D30305 / R30305C4: got 'n.a.'
## Warning: Expecting numeric in D30306 / R30306C4: got 'n.a.'
## Warning: Expecting numeric in D30307 / R30307C4: got 'n.a.'
## Warning: Expecting numeric in D30308 / R30308C4: got 'n.a.'
## Warning: Expecting numeric in D30309 / R30309C4: got 'n.a.'
## Warning: Expecting numeric in D30310 / R30310C4: got 'n.a.'
## Warning: Expecting numeric in D30311 / R30311C4: got 'n.a.'
## Warning: Expecting numeric in D30312 / R30312C4: got 'n.a.'
## Warning: Expecting numeric in D30313 / R30313C4: got 'n.a.'
## Warning: Expecting numeric in D30314 / R30314C4: got 'n.a.'
## Warning: Expecting numeric in D30315 / R30315C4: got 'n.a.'
## Warning: Expecting numeric in D30316 / R30316C4: got 'n.a.'
## Warning: Expecting numeric in D30317 / R30317C4: got 'n.a.'
## Warning: Expecting numeric in D30318 / R30318C4: got 'n.a.'
## Warning: Expecting numeric in D30319 / R30319C4: got 'n.a.'
## Warning: Expecting numeric in D30320 / R30320C4: got 'n.a.'
## Warning: Expecting numeric in D30321 / R30321C4: got 'n.a.'
## Warning: Expecting numeric in D30322 / R30322C4: got 'n.a.'
## Warning: Expecting numeric in D30323 / R30323C4: got 'n.a.'
## Warning: Expecting numeric in D30324 / R30324C4: got 'n.a.'
## Warning: Expecting numeric in D30325 / R30325C4: got 'n.a.'
## Warning: Expecting numeric in D30326 / R30326C4: got 'n.a.'
## Warning: Expecting numeric in D30327 / R30327C4: got 'n.a.'
## Warning: Expecting numeric in D30328 / R30328C4: got 'n.a.'
## Warning: Expecting numeric in D30329 / R30329C4: got 'n.a.'
## Warning: Expecting numeric in D30330 / R30330C4: got 'n.a.'
## Warning: Expecting numeric in D30331 / R30331C4: got 'n.a.'
## Warning: Expecting numeric in D30332 / R30332C4: got 'n.a.'
## Warning: Expecting numeric in D30333 / R30333C4: got 'n.a.'
## Warning: Expecting numeric in D30334 / R30334C4: got 'n.a.'
## Warning: Expecting numeric in D30335 / R30335C4: got 'n.a.'
## Warning: Expecting numeric in D30336 / R30336C4: got 'n.a.'
## Warning: Expecting numeric in D30337 / R30337C4: got 'n.a.'
## Warning: Expecting numeric in D30338 / R30338C4: got 'n.a.'
## Warning: Expecting numeric in D30339 / R30339C4: got 'n.a.'
## Warning: Expecting numeric in D30340 / R30340C4: got 'n.a.'
## Warning: Expecting numeric in D30341 / R30341C4: got 'n.a.'
## Warning: Expecting numeric in D30342 / R30342C4: got 'n.a.'
## Warning: Expecting numeric in D30343 / R30343C4: got 'n.a.'
## Warning: Expecting numeric in D30344 / R30344C4: got 'n.a.'
## Warning: Expecting numeric in D30345 / R30345C4: got 'n.a.'
## Warning: Expecting numeric in D30346 / R30346C4: got 'n.a.'
## Warning: Expecting numeric in D30347 / R30347C4: got 'n.a.'
## Warning: Expecting numeric in D30348 / R30348C4: got 'n.a.'
## Warning: Expecting numeric in D30349 / R30349C4: got 'n.a.'
## Warning: Expecting numeric in D30350 / R30350C4: got 'n.a.'
## Warning: Expecting numeric in D30351 / R30351C4: got 'n.a.'
## Warning: Expecting numeric in D30352 / R30352C4: got 'n.a.'
## Warning: Expecting numeric in D30353 / R30353C4: got 'n.a.'
## Warning: Expecting numeric in D30354 / R30354C4: got 'n.a.'
## Warning: Expecting numeric in D30355 / R30355C4: got 'n.a.'
## Warning: Expecting numeric in D30356 / R30356C4: got 'n.a.'
## Warning: Expecting numeric in D30357 / R30357C4: got 'n.a.'
## Warning: Expecting numeric in D30358 / R30358C4: got 'n.a.'
## Warning: Expecting numeric in D30359 / R30359C4: got 'n.a.'
## Warning: Expecting numeric in D30360 / R30360C4: got 'n.a.'
## Warning: Expecting numeric in D30361 / R30361C4: got 'n.a.'
## Warning: Expecting numeric in D30362 / R30362C4: got 'n.a.'
## Warning: Expecting numeric in D30363 / R30363C4: got 'n.a.'
## Warning: Expecting numeric in D30364 / R30364C4: got 'n.a.'
## Warning: Expecting numeric in D30365 / R30365C4: got 'n.a.'
## Warning: Expecting numeric in D30366 / R30366C4: got 'n.a.'
## Warning: Expecting numeric in D30367 / R30367C4: got 'n.a.'
## Warning: Expecting numeric in D30368 / R30368C4: got 'n.a.'
## Warning: Expecting numeric in D30369 / R30369C4: got 'n.a.'
## Warning: Expecting numeric in D30370 / R30370C4: got 'n.a.'
## Warning: Expecting numeric in D30371 / R30371C4: got 'n.a.'
## Warning: Expecting numeric in D30372 / R30372C4: got 'n.a.'
## Warning: Expecting numeric in D30373 / R30373C4: got 'n.a.'
## Warning: Expecting numeric in D30374 / R30374C4: got 'n.a.'
## Warning: Expecting numeric in D30375 / R30375C4: got 'n.a.'
## Warning: Expecting numeric in D30376 / R30376C4: got 'n.a.'
## Warning: Expecting numeric in D30377 / R30377C4: got 'n.a.'
## Warning: Expecting numeric in D30378 / R30378C4: got 'n.a.'
## Warning: Expecting numeric in D30379 / R30379C4: got 'n.a.'
## Warning: Expecting numeric in D30380 / R30380C4: got 'n.a.'
## Warning: Expecting numeric in D30381 / R30381C4: got 'n.a.'
## Warning: Expecting numeric in D30382 / R30382C4: got 'n.a.'
## Warning: Expecting numeric in D30383 / R30383C4: got 'n.a.'
## Warning: Expecting numeric in D30384 / R30384C4: got 'n.a.'
## Warning: Expecting numeric in D30385 / R30385C4: got 'n.a.'
## Warning: Expecting numeric in D30386 / R30386C4: got 'n.a.'
## Warning: Expecting numeric in D30387 / R30387C4: got 'n.a.'
## Warning: Expecting numeric in D30388 / R30388C4: got 'n.a.'
## Warning: Expecting numeric in D30389 / R30389C4: got 'n.a.'
## Warning: Expecting numeric in D30390 / R30390C4: got 'n.a.'
## Warning: Expecting numeric in D30391 / R30391C4: got 'n.a.'
## Warning: Expecting numeric in D30392 / R30392C4: got 'n.a.'
## Warning: Expecting numeric in D30393 / R30393C4: got 'n.a.'
## Warning: Expecting numeric in D30394 / R30394C4: got 'n.a.'
## Warning: Expecting numeric in D30395 / R30395C4: got 'n.a.'
## Warning: Expecting numeric in D30396 / R30396C4: got 'n.a.'
## Warning: Expecting numeric in D30397 / R30397C4: got 'n.a.'
## Warning: Expecting numeric in D30398 / R30398C4: got 'n.a.'
## Warning: Expecting numeric in D30399 / R30399C4: got 'n.a.'
## Warning: Expecting numeric in D30400 / R30400C4: got 'n.a.'
## Warning: Expecting numeric in D30401 / R30401C4: got 'n.a.'
## Warning: Expecting numeric in D30402 / R30402C4: got 'n.a.'
## Warning: Expecting numeric in D30403 / R30403C4: got 'n.a.'
## Warning: Expecting numeric in D30404 / R30404C4: got 'n.a.'
## Warning: Expecting numeric in D30405 / R30405C4: got 'n.a.'
## Warning: Expecting numeric in D30406 / R30406C4: got 'n.a.'
## Warning: Expecting numeric in D30407 / R30407C4: got 'n.a.'
## Warning: Expecting numeric in D30408 / R30408C4: got 'n.a.'
## Warning: Expecting numeric in D30409 / R30409C4: got 'n.a.'
## Warning: Expecting numeric in D30410 / R30410C4: got 'n.a.'
## Warning: Expecting numeric in D30411 / R30411C4: got 'n.a.'
## Warning: Expecting numeric in D30412 / R30412C4: got 'n.a.'
## Warning: Expecting numeric in D30413 / R30413C4: got 'n.a.'
## Warning: Expecting numeric in D30414 / R30414C4: got 'n.a.'
## Warning: Expecting numeric in D30415 / R30415C4: got 'n.a.'
## Warning: Expecting numeric in D30416 / R30416C4: got 'n.a.'
## Warning: Expecting numeric in D30417 / R30417C4: got 'n.a.'
## Warning: Expecting numeric in D30418 / R30418C4: got 'n.a.'
## Warning: Expecting numeric in D30419 / R30419C4: got 'n.a.'
## Warning: Expecting numeric in D30420 / R30420C4: got 'n.a.'
## Warning: Expecting numeric in D30421 / R30421C4: got 'n.a.'
## Warning: Expecting numeric in D30422 / R30422C4: got 'n.a.'
## Warning: Expecting numeric in D30423 / R30423C4: got 'n.a.'
## Warning: Expecting numeric in D30424 / R30424C4: got 'n.a.'
## Warning: Expecting numeric in D30425 / R30425C4: got 'n.a.'
## Warning: Expecting numeric in D30426 / R30426C4: got 'n.a.'
## Warning: Expecting numeric in D30427 / R30427C4: got 'n.a.'
## Warning: Expecting numeric in D30428 / R30428C4: got 'n.a.'
## Warning: Expecting numeric in D30429 / R30429C4: got 'n.a.'
## Warning: Expecting numeric in D30430 / R30430C4: got 'n.a.'
## Warning: Expecting numeric in D30431 / R30431C4: got 'n.a.'
## Warning: Expecting numeric in D30432 / R30432C4: got 'n.a.'
## Warning: Expecting numeric in D30433 / R30433C4: got 'n.a.'
## Warning: Expecting numeric in D30434 / R30434C4: got 'n.a.'
## Warning: Expecting numeric in D30435 / R30435C4: got 'n.a.'
## Warning: Expecting numeric in D30436 / R30436C4: got 'n.a.'
## Warning: Expecting numeric in D30437 / R30437C4: got 'n.a.'
## Warning: Expecting numeric in D30438 / R30438C4: got 'n.a.'
## Warning: Expecting numeric in D30439 / R30439C4: got 'n.a.'
## Warning: Expecting numeric in D30440 / R30440C4: got 'n.a.'
## Warning: Expecting numeric in D30441 / R30441C4: got 'n.a.'
## Warning: Expecting numeric in D30442 / R30442C4: got 'n.a.'
## Warning: Expecting numeric in D30443 / R30443C4: got 'n.a.'
## Warning: Expecting numeric in D30444 / R30444C4: got 'n.a.'
## Warning: Expecting numeric in D30445 / R30445C4: got 'n.a.'
## Warning: Expecting numeric in D30446 / R30446C4: got 'n.a.'
## Warning: Expecting numeric in D30447 / R30447C4: got 'n.a.'
## Warning: Expecting numeric in D30448 / R30448C4: got 'n.a.'
## Warning: Expecting numeric in D30449 / R30449C4: got 'n.a.'
## Warning: Expecting numeric in D30450 / R30450C4: got 'n.a.'
## Warning: Expecting numeric in D30451 / R30451C4: got 'n.a.'
## Warning: Expecting numeric in D30452 / R30452C4: got 'n.a.'
## Warning: Expecting numeric in D30453 / R30453C4: got 'n.a.'
## Warning: Expecting numeric in D30454 / R30454C4: got 'n.a.'
## Warning: Expecting numeric in D30455 / R30455C4: got 'n.a.'
## Warning: Expecting numeric in D30456 / R30456C4: got 'n.a.'
## Warning: Expecting numeric in D30457 / R30457C4: got 'n.a.'
## Warning: Expecting numeric in D30458 / R30458C4: got 'n.a.'
## Warning: Expecting numeric in D30459 / R30459C4: got 'n.a.'
## Warning: Expecting numeric in D30460 / R30460C4: got 'n.a.'
## Warning: Expecting numeric in D30461 / R30461C4: got 'n.a.'
## Warning: Expecting numeric in D30462 / R30462C4: got 'n.a.'
## Warning: Expecting numeric in D30463 / R30463C4: got 'n.a.'
## Warning: Expecting numeric in D30464 / R30464C4: got 'n.a.'
## Warning: Expecting numeric in D30465 / R30465C4: got 'n.a.'
## Warning: Expecting numeric in D30466 / R30466C4: got 'n.a.'
## Warning: Expecting numeric in D30467 / R30467C4: got 'n.a.'
## Warning: Expecting numeric in D30468 / R30468C4: got 'n.a.'
## Warning: Expecting numeric in D30469 / R30469C4: got 'n.a.'
## Warning: Expecting numeric in D30470 / R30470C4: got 'n.a.'
## Warning: Expecting numeric in D30471 / R30471C4: got 'n.a.'
## Warning: Expecting numeric in D30472 / R30472C4: got 'n.a.'
## Warning: Expecting numeric in D30473 / R30473C4: got 'n.a.'
## Warning: Expecting numeric in D30474 / R30474C4: got 'n.a.'
## Warning: Expecting numeric in D30475 / R30475C4: got 'n.a.'
## Warning: Expecting numeric in D30476 / R30476C4: got 'n.a.'
## Warning: Expecting numeric in D30477 / R30477C4: got 'n.a.'
## Warning: Expecting numeric in D30478 / R30478C4: got 'n.a.'
## Warning: Expecting numeric in D30479 / R30479C4: got 'n.a.'
## Warning: Expecting numeric in D30480 / R30480C4: got 'n.a.'
## Warning: Expecting numeric in D30481 / R30481C4: got 'n.a.'
## Warning: Expecting numeric in D30482 / R30482C4: got 'n.a.'
## Warning: Expecting numeric in D30483 / R30483C4: got 'n.a.'
## Warning: Expecting numeric in D30484 / R30484C4: got 'n.a.'
## Warning: Expecting numeric in D30485 / R30485C4: got 'n.a.'
## Warning: Expecting numeric in D30486 / R30486C4: got 'n.a.'
## Warning: Expecting numeric in D30487 / R30487C4: got 'n.a.'
## Warning: Expecting numeric in D30488 / R30488C4: got 'n.a.'
## Warning: Expecting numeric in D30489 / R30489C4: got 'n.a.'
## Warning: Expecting numeric in D30490 / R30490C4: got 'n.a.'
## Warning: Expecting numeric in D30491 / R30491C4: got 'n.a.'
## Warning: Expecting numeric in D30492 / R30492C4: got 'n.a.'
## Warning: Expecting numeric in D30493 / R30493C4: got 'n.a.'
## Warning: Expecting numeric in D30494 / R30494C4: got 'n.a.'
## Warning: Expecting numeric in D30495 / R30495C4: got 'n.a.'
## Warning: Expecting numeric in D30496 / R30496C4: got 'n.a.'
## Warning: Expecting numeric in D30497 / R30497C4: got 'n.a.'
## Warning: Expecting numeric in D30498 / R30498C4: got 'n.a.'
## Warning: Expecting numeric in D30499 / R30499C4: got 'n.a.'
## Warning: Expecting numeric in D30500 / R30500C4: got 'n.a.'
## Warning: Expecting numeric in D30501 / R30501C4: got 'n.a.'
## Warning: Expecting numeric in D30502 / R30502C4: got 'n.a.'
## Warning: Expecting numeric in D30503 / R30503C4: got 'n.a.'
## Warning: Expecting numeric in D30504 / R30504C4: got 'n.a.'
## Warning: Expecting numeric in D30505 / R30505C4: got 'n.a.'
## Warning: Expecting numeric in D30506 / R30506C4: got 'n.a.'
## Warning: Expecting numeric in D30507 / R30507C4: got 'n.a.'
## Warning: Expecting numeric in D30508 / R30508C4: got 'n.a.'
## Warning: Expecting numeric in D30509 / R30509C4: got 'n.a.'
## Warning: Expecting numeric in D30510 / R30510C4: got 'n.a.'
## Warning: Expecting numeric in D30511 / R30511C4: got 'n.a.'
## Warning: Expecting numeric in D30512 / R30512C4: got 'n.a.'
## Warning: Expecting numeric in D30513 / R30513C4: got 'n.a.'
## Warning: Expecting numeric in D30514 / R30514C4: got 'n.a.'
## Warning: Expecting numeric in D30515 / R30515C4: got 'n.a.'
## Warning: Expecting numeric in D30516 / R30516C4: got 'n.a.'
## Warning: Expecting numeric in D30517 / R30517C4: got 'n.a.'
## Warning: Expecting numeric in D30518 / R30518C4: got 'n.a.'
## Warning: Expecting numeric in D30519 / R30519C4: got 'n.a.'
## Warning: Expecting numeric in D30520 / R30520C4: got 'n.a.'
## Warning: Expecting numeric in D30521 / R30521C4: got 'n.a.'
## Warning: Expecting numeric in D30522 / R30522C4: got 'n.a.'
## Warning: Expecting numeric in D30523 / R30523C4: got 'n.a.'
## Warning: Expecting numeric in D30524 / R30524C4: got 'n.a.'
## Warning: Expecting numeric in D30525 / R30525C4: got 'n.a.'
## Warning: Expecting numeric in D30526 / R30526C4: got 'n.a.'
## Warning: Expecting numeric in D30527 / R30527C4: got 'n.a.'
## Warning: Expecting numeric in D30528 / R30528C4: got 'n.a.'
## Warning: Expecting numeric in D30529 / R30529C4: got 'n.a.'
## Warning: Expecting numeric in D30530 / R30530C4: got 'n.a.'
## Warning: Expecting numeric in D30531 / R30531C4: got 'n.a.'
## Warning: Expecting numeric in D30532 / R30532C4: got 'n.a.'
## Warning: Expecting numeric in D30533 / R30533C4: got 'n.a.'
## Warning: Expecting numeric in D30534 / R30534C4: got 'n.a.'
## Warning: Expecting numeric in D30535 / R30535C4: got 'n.a.'
## Warning: Expecting numeric in D30536 / R30536C4: got 'n.a.'
## Warning: Expecting numeric in D30537 / R30537C4: got 'n.a.'
## Warning: Expecting numeric in D30538 / R30538C4: got 'n.a.'
## Warning: Expecting numeric in D30539 / R30539C4: got 'n.a.'
## Warning: Expecting numeric in D30540 / R30540C4: got 'n.a.'
## Warning: Expecting numeric in D30541 / R30541C4: got 'n.a.'
## Warning: Expecting numeric in D30542 / R30542C4: got 'n.a.'
## Warning: Expecting numeric in D30543 / R30543C4: got 'n.a.'
## Warning: Expecting numeric in D30544 / R30544C4: got 'n.a.'
## Warning: Expecting numeric in D30545 / R30545C4: got 'n.a.'
## Warning: Expecting numeric in D30546 / R30546C4: got 'n.a.'
## Warning: Expecting numeric in D30547 / R30547C4: got 'n.a.'
## Warning: Expecting numeric in D30548 / R30548C4: got 'n.a.'
## Warning: Expecting numeric in D30549 / R30549C4: got 'n.a.'
## Warning: Expecting numeric in D30550 / R30550C4: got 'n.a.'
## Warning: Expecting numeric in D30551 / R30551C4: got 'n.a.'
## Warning: Expecting numeric in D30552 / R30552C4: got 'n.a.'
## Warning: Expecting numeric in D30553 / R30553C4: got 'n.a.'
## Warning: Expecting numeric in D30554 / R30554C4: got 'n.a.'
## Warning: Expecting numeric in D30555 / R30555C4: got 'n.a.'
## Warning: Expecting numeric in D30556 / R30556C4: got 'n.a.'
## Warning: Expecting numeric in D30557 / R30557C4: got 'n.a.'
## Warning: Expecting numeric in D30558 / R30558C4: got 'n.a.'
## Warning: Expecting numeric in D30559 / R30559C4: got 'n.a.'
## Warning: Expecting numeric in D30560 / R30560C4: got 'n.a.'
## Warning: Expecting numeric in D30561 / R30561C4: got 'n.a.'
## Warning: Expecting numeric in D30562 / R30562C4: got 'n.a.'
## Warning: Expecting numeric in D30563 / R30563C4: got 'n.a.'
## Warning: Expecting numeric in D30564 / R30564C4: got 'n.a.'
## Warning: Expecting numeric in D30565 / R30565C4: got 'n.a.'
## Warning: Expecting numeric in D30566 / R30566C4: got 'n.a.'
## Warning: Expecting numeric in D30567 / R30567C4: got 'n.a.'
## Warning: Expecting numeric in D30568 / R30568C4: got 'n.a.'
## Warning: Expecting numeric in D30569 / R30569C4: got 'n.a.'
## Warning: Expecting numeric in D30570 / R30570C4: got 'n.a.'
## Warning: Expecting numeric in D30571 / R30571C4: got 'n.a.'
## Warning: Expecting numeric in D30572 / R30572C4: got 'n.a.'
## Warning: Expecting numeric in D30573 / R30573C4: got 'n.a.'
## Warning: Expecting numeric in D30574 / R30574C4: got 'n.a.'
## Warning: Expecting numeric in D30575 / R30575C4: got 'n.a.'
## Warning: Expecting numeric in D30576 / R30576C4: got 'n.a.'
## Warning: Expecting numeric in D30577 / R30577C4: got 'n.a.'
## Warning: Expecting numeric in D30578 / R30578C4: got 'n.a.'
## Warning: Expecting numeric in D30579 / R30579C4: got 'n.a.'
## Warning: Expecting numeric in D30580 / R30580C4: got 'n.a.'
## Warning: Expecting numeric in D30581 / R30581C4: got 'n.a.'
## Warning: Expecting numeric in D30582 / R30582C4: got 'n.a.'
## Warning: Expecting numeric in D30583 / R30583C4: got 'n.a.'
## Warning: Expecting numeric in D30584 / R30584C4: got 'n.a.'
## Warning: Expecting numeric in D30585 / R30585C4: got 'n.a.'
## Warning: Expecting numeric in D30586 / R30586C4: got 'n.a.'
## Warning: Expecting numeric in D30587 / R30587C4: got 'n.a.'
## Warning: Expecting numeric in D30588 / R30588C4: got 'n.a.'
## Warning: Expecting numeric in D30589 / R30589C4: got 'n.a.'
## Warning: Expecting numeric in D30590 / R30590C4: got 'n.a.'
## Warning: Expecting numeric in D30591 / R30591C4: got 'n.a.'
## Warning: Expecting numeric in D30592 / R30592C4: got 'n.a.'
## Warning: Expecting numeric in D30593 / R30593C4: got 'n.a.'
## Warning: Expecting numeric in D30594 / R30594C4: got 'n.a.'
## Warning: Expecting numeric in D30595 / R30595C4: got 'n.a.'
## Warning: Expecting numeric in D30596 / R30596C4: got 'n.a.'
## Warning: Expecting numeric in D30597 / R30597C4: got 'n.a.'
## Warning: Expecting numeric in D30598 / R30598C4: got 'n.a.'
## Warning: Expecting numeric in D30599 / R30599C4: got 'n.a.'
## Warning: Expecting numeric in D30600 / R30600C4: got 'n.a.'
## Warning: Expecting numeric in D30601 / R30601C4: got 'n.a.'
## Warning: Expecting numeric in D30602 / R30602C4: got 'n.a.'
## Warning: Expecting numeric in D30603 / R30603C4: got 'n.a.'
## Warning: Expecting numeric in D30604 / R30604C4: got 'n.a.'
## Warning: Expecting numeric in D30605 / R30605C4: got 'n.a.'
## Warning: Expecting numeric in D30606 / R30606C4: got 'n.a.'
## Warning: Expecting numeric in D30607 / R30607C4: got 'n.a.'
## Warning: Expecting numeric in D30608 / R30608C4: got 'n.a.'
## Warning: Expecting numeric in D30609 / R30609C4: got 'n.a.'
## Warning: Expecting numeric in D30610 / R30610C4: got 'n.a.'
## Warning: Expecting numeric in D30611 / R30611C4: got 'n.a.'
## Warning: Expecting numeric in D30612 / R30612C4: got 'n.a.'
## Warning: Expecting numeric in D30613 / R30613C4: got 'n.a.'
## Warning: Expecting numeric in D30614 / R30614C4: got 'n.a.'
## Warning: Expecting numeric in D30615 / R30615C4: got 'n.a.'
## Warning: Expecting numeric in D30616 / R30616C4: got 'n.a.'
## Warning: Expecting numeric in D30617 / R30617C4: got 'n.a.'
## Warning: Expecting numeric in D30618 / R30618C4: got 'n.a.'
## Warning: Expecting numeric in D30619 / R30619C4: got 'n.a.'
## Warning: Expecting numeric in D30620 / R30620C4: got 'n.a.'
## Warning: Expecting numeric in D30621 / R30621C4: got 'n.a.'
## Warning: Expecting numeric in D30622 / R30622C4: got 'n.a.'
## Warning: Expecting numeric in D30623 / R30623C4: got 'n.a.'
## Warning: Expecting numeric in D30624 / R30624C4: got 'n.a.'
## Warning: Expecting numeric in D30625 / R30625C4: got 'n.a.'
## Warning: Expecting numeric in D30626 / R30626C4: got 'n.a.'
## Warning: Expecting numeric in D30627 / R30627C4: got 'n.a.'
## Warning: Expecting numeric in D30628 / R30628C4: got 'n.a.'
## Warning: Expecting numeric in D30629 / R30629C4: got 'n.a.'
## Warning: Expecting numeric in D30630 / R30630C4: got 'n.a.'
## Warning: Expecting numeric in D30631 / R30631C4: got 'n.a.'
## Warning: Expecting numeric in D30632 / R30632C4: got 'n.a.'
## Warning: Expecting numeric in D30633 / R30633C4: got 'n.a.'
## Warning: Expecting numeric in D30634 / R30634C4: got 'n.a.'
## Warning: Expecting numeric in D30635 / R30635C4: got 'n.a.'
## Warning: Expecting numeric in D30636 / R30636C4: got 'n.a.'
## Warning: Expecting numeric in D30637 / R30637C4: got 'n.a.'
## Warning: Expecting numeric in D30638 / R30638C4: got 'n.a.'
## Warning: Expecting numeric in D30639 / R30639C4: got 'n.a.'
## Warning: Expecting numeric in D30640 / R30640C4: got 'n.a.'
## Warning: Expecting numeric in D30641 / R30641C4: got 'n.a.'
## Warning: Expecting numeric in D30642 / R30642C4: got 'n.a.'
## Warning: Expecting numeric in D30643 / R30643C4: got 'n.a.'
## Warning: Expecting numeric in D30644 / R30644C4: got 'n.a.'
## Warning: Expecting numeric in D30645 / R30645C4: got 'n.a.'
## Warning: Expecting numeric in D30646 / R30646C4: got 'n.a.'
## Warning: Expecting numeric in D30647 / R30647C4: got 'n.a.'
## Warning: Expecting numeric in D30648 / R30648C4: got 'n.a.'
## Warning: Expecting numeric in D30649 / R30649C4: got 'n.a.'
## Warning: Expecting numeric in D30650 / R30650C4: got 'n.a.'
## Warning: Expecting numeric in D30651 / R30651C4: got 'n.a.'
## Warning: Expecting numeric in D30652 / R30652C4: got 'n.a.'
## Warning: Expecting numeric in D30653 / R30653C4: got 'n.a.'
## Warning: Expecting numeric in D30654 / R30654C4: got 'n.a.'
## Warning: Expecting numeric in D30655 / R30655C4: got 'n.a.'
## Warning: Expecting numeric in D30656 / R30656C4: got 'n.a.'
## Warning: Expecting numeric in D30657 / R30657C4: got 'n.a.'
## Warning: Expecting numeric in D30658 / R30658C4: got 'n.a.'
## Warning: Expecting numeric in D30659 / R30659C4: got 'n.a.'
## Warning: Expecting numeric in D30660 / R30660C4: got 'n.a.'
## Warning: Expecting numeric in D30661 / R30661C4: got 'n.a.'
## Warning: Expecting numeric in D30662 / R30662C4: got 'n.a.'
## Warning: Expecting numeric in D30663 / R30663C4: got 'n.a.'
## Warning: Expecting numeric in D30664 / R30664C4: got 'n.a.'
## Warning: Expecting numeric in D30665 / R30665C4: got 'n.a.'
## Warning: Expecting numeric in D30666 / R30666C4: got 'n.a.'
## Warning: Expecting numeric in D30667 / R30667C4: got 'n.a.'
## Warning: Expecting numeric in D30668 / R30668C4: got 'n.a.'
## Warning: Expecting numeric in D30669 / R30669C4: got 'n.a.'
## Warning: Expecting numeric in D30670 / R30670C4: got 'n.a.'
## Warning: Expecting numeric in D30671 / R30671C4: got 'n.a.'
## Warning: Expecting numeric in D30672 / R30672C4: got 'n.a.'
## Warning: Expecting numeric in D30673 / R30673C4: got 'n.a.'
## Warning: Expecting numeric in D30674 / R30674C4: got 'n.a.'
## Warning: Expecting numeric in D30675 / R30675C4: got 'n.a.'
## Warning: Expecting numeric in D30676 / R30676C4: got 'n.a.'
## Warning: Expecting numeric in D30677 / R30677C4: got 'n.a.'
## Warning: Expecting numeric in D30678 / R30678C4: got 'n.a.'
## Warning: Expecting numeric in D30679 / R30679C4: got 'n.a.'
## Warning: Expecting numeric in D30680 / R30680C4: got 'n.a.'
## Warning: Expecting numeric in D30681 / R30681C4: got 'n.a.'
## Warning: Expecting numeric in D30682 / R30682C4: got 'n.a.'
## Warning: Expecting numeric in D30683 / R30683C4: got 'n.a.'
## Warning: Expecting numeric in D30684 / R30684C4: got 'n.a.'
## Warning: Expecting numeric in D30685 / R30685C4: got 'n.a.'
## Warning: Expecting numeric in D30686 / R30686C4: got 'n.a.'
## Warning: Expecting numeric in D30687 / R30687C4: got 'n.a.'
## Warning: Expecting numeric in D30688 / R30688C4: got 'n.a.'
## Warning: Expecting numeric in D30689 / R30689C4: got 'n.a.'
## Warning: Expecting numeric in D30690 / R30690C4: got 'n.a.'
## Warning: Expecting numeric in D30691 / R30691C4: got 'n.a.'
## Warning: Expecting numeric in D30692 / R30692C4: got 'n.a.'
## Warning: Expecting numeric in D30693 / R30693C4: got 'n.a.'
## Warning: Expecting numeric in D30694 / R30694C4: got 'n.a.'
## Warning: Expecting numeric in D30695 / R30695C4: got 'n.a.'
## Warning: Expecting numeric in D30696 / R30696C4: got 'n.a.'
## Warning: Expecting numeric in D30697 / R30697C4: got 'n.a.'
## Warning: Expecting numeric in D30698 / R30698C4: got 'n.a.'
## Warning: Expecting numeric in D30699 / R30699C4: got 'n.a.'
## Warning: Expecting numeric in D30700 / R30700C4: got 'n.a.'
## Warning: Expecting numeric in D30701 / R30701C4: got 'n.a.'
## Warning: Expecting numeric in D30702 / R30702C4: got 'n.a.'
## Warning: Expecting numeric in D30703 / R30703C4: got 'n.a.'
## Warning: Expecting numeric in D30704 / R30704C4: got 'n.a.'
## Warning: Expecting numeric in D30705 / R30705C4: got 'n.a.'
## Warning: Expecting numeric in D30706 / R30706C4: got 'n.a.'
## Warning: Expecting numeric in D30707 / R30707C4: got 'n.a.'
## Warning: Expecting numeric in D30708 / R30708C4: got 'n.a.'
## Warning: Expecting numeric in D30709 / R30709C4: got 'n.a.'
## Warning: Expecting numeric in D30710 / R30710C4: got 'n.a.'
## Warning: Expecting numeric in D30711 / R30711C4: got 'n.a.'
## Warning: Expecting numeric in D30712 / R30712C4: got 'n.a.'
## Warning: Expecting numeric in D30713 / R30713C4: got 'n.a.'
## Warning: Expecting numeric in D30714 / R30714C4: got 'n.a.'
## Warning: Expecting numeric in D30715 / R30715C4: got 'n.a.'
## Warning: Expecting numeric in D30716 / R30716C4: got 'n.a.'
## Warning: Expecting numeric in D30717 / R30717C4: got 'n.a.'
## Warning: Expecting numeric in D30718 / R30718C4: got 'n.a.'
## Warning: Expecting numeric in D30719 / R30719C4: got 'n.a.'
## Warning: Expecting numeric in D30720 / R30720C4: got 'n.a.'
## Warning: Expecting numeric in D30721 / R30721C4: got 'n.a.'
## Warning: Expecting numeric in D30722 / R30722C4: got 'n.a.'
## Warning: Expecting numeric in D30723 / R30723C4: got 'n.a.'
## Warning: Expecting numeric in D30724 / R30724C4: got 'n.a.'
## Warning: Expecting numeric in D30725 / R30725C4: got 'n.a.'
## Warning: Expecting numeric in D30726 / R30726C4: got 'n.a.'
## Warning: Expecting numeric in D30727 / R30727C4: got 'n.a.'
## Warning: Expecting numeric in D30728 / R30728C4: got 'n.a.'
## Warning: Expecting numeric in D30729 / R30729C4: got 'n.a.'
## Warning: Expecting numeric in D30730 / R30730C4: got 'n.a.'
## Warning: Expecting numeric in D30731 / R30731C4: got 'n.a.'
## Warning: Expecting numeric in D30732 / R30732C4: got 'n.a.'
## Warning: Expecting numeric in D30733 / R30733C4: got 'n.a.'
## Warning: Expecting numeric in D30734 / R30734C4: got 'n.a.'
## Warning: Expecting numeric in D30735 / R30735C4: got 'n.a.'
## Warning: Expecting numeric in D30736 / R30736C4: got 'n.a.'
## Warning: Expecting numeric in D30737 / R30737C4: got 'n.a.'
## Warning: Expecting numeric in D30738 / R30738C4: got 'n.a.'
## Warning: Expecting numeric in D30739 / R30739C4: got 'n.a.'
## Warning: Expecting numeric in D30740 / R30740C4: got 'n.a.'
## Warning: Expecting numeric in D30741 / R30741C4: got 'n.a.'
## Warning: Expecting numeric in D30742 / R30742C4: got 'n.a.'
## Warning: Expecting numeric in D30743 / R30743C4: got 'n.a.'
## Warning: Expecting numeric in D30744 / R30744C4: got 'n.a.'
## Warning: Expecting numeric in D30745 / R30745C4: got 'n.a.'
## Warning: Expecting numeric in D30746 / R30746C4: got 'n.a.'
## Warning: Expecting numeric in D30747 / R30747C4: got 'n.a.'
## Warning: Expecting numeric in D30748 / R30748C4: got 'n.a.'
## Warning: Expecting numeric in D30749 / R30749C4: got 'n.a.'
## Warning: Expecting numeric in D30750 / R30750C4: got 'n.a.'
## Warning: Expecting numeric in D30751 / R30751C4: got 'n.a.'
## Warning: Expecting numeric in D30752 / R30752C4: got 'n.a.'
## Warning: Expecting numeric in D30753 / R30753C4: got 'n.a.'
## Warning: Expecting numeric in D30754 / R30754C4: got 'n.a.'
## Warning: Expecting numeric in D30755 / R30755C4: got 'n.a.'
## Warning: Expecting numeric in D30756 / R30756C4: got 'n.a.'
## Warning: Expecting numeric in D30757 / R30757C4: got 'n.a.'
## Warning: Expecting numeric in D30758 / R30758C4: got 'n.a.'
## Warning: Expecting numeric in D30759 / R30759C4: got 'n.a.'
## Warning: Expecting numeric in D30760 / R30760C4: got 'n.a.'
## Warning: Expecting numeric in D30761 / R30761C4: got 'n.a.'
## Warning: Expecting numeric in D30762 / R30762C4: got 'n.a.'
## Warning: Expecting numeric in D30763 / R30763C4: got 'n.a.'
## Warning: Expecting numeric in D30764 / R30764C4: got 'n.a.'
## Warning: Expecting numeric in D30765 / R30765C4: got 'n.a.'
## Warning: Expecting numeric in D30766 / R30766C4: got 'n.a.'
## Warning: Expecting numeric in D30767 / R30767C4: got 'n.a.'
## Warning: Expecting numeric in D30768 / R30768C4: got 'n.a.'
## Warning: Expecting numeric in D30769 / R30769C4: got 'n.a.'
## Warning: Expecting numeric in D30770 / R30770C4: got 'n.a.'
## Warning: Expecting numeric in D30771 / R30771C4: got 'n.a.'
## Warning: Expecting numeric in D30772 / R30772C4: got 'n.a.'
## Warning: Expecting numeric in D30773 / R30773C4: got 'n.a.'
## Warning: Expecting numeric in D30774 / R30774C4: got 'n.a.'
## Warning: Expecting numeric in D30775 / R30775C4: got 'n.a.'
## Warning: Expecting numeric in D30776 / R30776C4: got 'n.a.'
## Warning: Expecting numeric in D30777 / R30777C4: got 'n.a.'
## Warning: Expecting numeric in D30778 / R30778C4: got 'n.a.'
## Warning: Expecting numeric in D30779 / R30779C4: got 'n.a.'
## Warning: Expecting numeric in D30780 / R30780C4: got 'n.a.'
## Warning: Expecting numeric in D30781 / R30781C4: got 'n.a.'
## Warning: Expecting numeric in D30782 / R30782C4: got 'n.a.'
## Warning: Expecting numeric in D30783 / R30783C4: got 'n.a.'
## Warning: Expecting numeric in D30784 / R30784C4: got 'n.a.'
## Warning: Expecting numeric in D30785 / R30785C4: got 'n.a.'
## Warning: Expecting numeric in D30786 / R30786C4: got 'n.a.'
## Warning: Expecting numeric in D30787 / R30787C4: got 'n.a.'
## Warning: Expecting numeric in D30788 / R30788C4: got 'n.a.'
## Warning: Expecting numeric in D30789 / R30789C4: got 'n.a.'
## Warning: Expecting numeric in D30790 / R30790C4: got 'n.a.'
## Warning: Expecting numeric in D30791 / R30791C4: got 'n.a.'
## Warning: Expecting numeric in D30792 / R30792C4: got 'n.a.'
## Warning: Expecting numeric in D30793 / R30793C4: got 'n.a.'
## Warning: Expecting numeric in D30794 / R30794C4: got 'n.a.'
## Warning: Expecting numeric in D30795 / R30795C4: got 'n.a.'
## Warning: Expecting numeric in D30796 / R30796C4: got 'n.a.'
## Warning: Expecting numeric in D30797 / R30797C4: got 'n.a.'
## Warning: Expecting numeric in D30798 / R30798C4: got 'n.a.'
## Warning: Expecting numeric in D30799 / R30799C4: got 'n.a.'
## Warning: Expecting numeric in D30800 / R30800C4: got 'n.a.'
## Warning: Expecting numeric in D30801 / R30801C4: got 'n.a.'
## Warning: Expecting numeric in D30802 / R30802C4: got 'n.a.'
## Warning: Expecting numeric in D30803 / R30803C4: got 'n.a.'
## Warning: Expecting numeric in D30804 / R30804C4: got 'n.a.'
## Warning: Expecting numeric in D30805 / R30805C4: got 'n.a.'
## Warning: Expecting numeric in D30806 / R30806C4: got 'n.a.'
## Warning: Expecting numeric in D30807 / R30807C4: got 'n.a.'
## Warning: Expecting numeric in D30808 / R30808C4: got 'n.a.'
## Warning: Expecting numeric in D30809 / R30809C4: got 'n.a.'
## Warning: Expecting numeric in D30810 / R30810C4: got 'n.a.'
## Warning: Expecting numeric in D30811 / R30811C4: got 'n.a.'
## Warning: Expecting numeric in D30812 / R30812C4: got 'n.a.'
## Warning: Expecting numeric in D30813 / R30813C4: got 'n.a.'
## Warning: Expecting numeric in D30814 / R30814C4: got 'n.a.'
## Warning: Expecting numeric in D30815 / R30815C4: got 'n.a.'
## Warning: Expecting numeric in D30816 / R30816C4: got 'n.a.'
## Warning: Expecting numeric in D30817 / R30817C4: got 'n.a.'
## Warning: Expecting numeric in D30818 / R30818C4: got 'n.a.'
## Warning: Expecting numeric in D30819 / R30819C4: got 'n.a.'
## Warning: Expecting numeric in D30820 / R30820C4: got 'n.a.'
## Warning: Expecting numeric in D30821 / R30821C4: got 'n.a.'
## Warning: Expecting numeric in D30822 / R30822C4: got 'n.a.'
## Warning: Expecting numeric in D30823 / R30823C4: got 'n.a.'
## Warning: Expecting numeric in D30824 / R30824C4: got 'n.a.'
## Warning: Expecting numeric in D30825 / R30825C4: got 'n.a.'
## Warning: Expecting numeric in D30826 / R30826C4: got 'n.a.'
## Warning: Expecting numeric in D30827 / R30827C4: got 'n.a.'
## Warning: Expecting numeric in D30828 / R30828C4: got 'n.a.'
## Warning: Expecting numeric in D30829 / R30829C4: got 'n.a.'
## Warning: Expecting numeric in D30830 / R30830C4: got 'n.a.'
## Warning: Expecting numeric in D30831 / R30831C4: got 'n.a.'
## Warning: Expecting numeric in D30832 / R30832C4: got 'n.a.'
## Warning: Expecting numeric in D30833 / R30833C4: got 'n.a.'
## Warning: Expecting numeric in D30834 / R30834C4: got 'n.a.'
## Warning: Expecting numeric in D30835 / R30835C4: got 'n.a.'
## Warning: Expecting numeric in D30836 / R30836C4: got 'n.a.'
## Warning: Expecting numeric in D30837 / R30837C4: got 'n.a.'
## Warning: Expecting numeric in D30838 / R30838C4: got 'n.a.'
## Warning: Expecting numeric in D30839 / R30839C4: got 'n.a.'
## Warning: Expecting numeric in D30840 / R30840C4: got 'n.a.'
## Warning: Expecting numeric in D30841 / R30841C4: got 'n.a.'
## Warning: Expecting numeric in D30842 / R30842C4: got 'n.a.'
## Warning: Expecting numeric in D30843 / R30843C4: got 'n.a.'
## Warning: Expecting numeric in D30844 / R30844C4: got 'n.a.'
## Warning: Expecting numeric in D30845 / R30845C4: got 'n.a.'
## Warning: Expecting numeric in D30846 / R30846C4: got 'n.a.'
## Warning: Expecting numeric in D30847 / R30847C4: got 'n.a.'
## Warning: Expecting numeric in D30848 / R30848C4: got 'n.a.'
## Warning: Expecting numeric in D30849 / R30849C4: got 'n.a.'
## Warning: Expecting numeric in D30850 / R30850C4: got 'n.a.'
## Warning: Expecting numeric in D30851 / R30851C4: got 'n.a.'
## Warning: Expecting numeric in D30852 / R30852C4: got 'n.a.'
## Warning: Expecting numeric in D30853 / R30853C4: got 'n.a.'
## Warning: Expecting numeric in D30854 / R30854C4: got 'n.a.'
## Warning: Expecting numeric in D30855 / R30855C4: got 'n.a.'
## Warning: Expecting numeric in D30856 / R30856C4: got 'n.a.'
## Warning: Expecting numeric in D30857 / R30857C4: got 'n.a.'
## Warning: Expecting numeric in D30858 / R30858C4: got 'n.a.'
## Warning: Expecting numeric in D30859 / R30859C4: got 'n.a.'
## Warning: Expecting numeric in D30860 / R30860C4: got 'n.a.'
## Warning: Expecting numeric in D30861 / R30861C4: got 'n.a.'
## Warning: Expecting numeric in D30862 / R30862C4: got 'n.a.'
## Warning: Expecting numeric in D30863 / R30863C4: got 'n.a.'
## Warning: Expecting numeric in D30864 / R30864C4: got 'n.a.'
## Warning: Expecting numeric in D30865 / R30865C4: got 'n.a.'
## Warning: Expecting numeric in D30866 / R30866C4: got 'n.a.'
## Warning: Expecting numeric in D30867 / R30867C4: got 'n.a.'
## Warning: Expecting numeric in D30868 / R30868C4: got 'n.a.'
## Warning: Expecting numeric in D30869 / R30869C4: got 'n.a.'
## Warning: Expecting numeric in D30870 / R30870C4: got 'n.a.'
## Warning: Expecting numeric in D30871 / R30871C4: got 'n.a.'
## Warning: Expecting numeric in D30872 / R30872C4: got 'n.a.'
## Warning: Expecting numeric in D30873 / R30873C4: got 'n.a.'
## Warning: Expecting numeric in D30874 / R30874C4: got 'n.a.'
## Warning: Expecting numeric in D30875 / R30875C4: got 'n.a.'
## Warning: Expecting numeric in D30876 / R30876C4: got 'n.a.'
## Warning: Expecting numeric in D30877 / R30877C4: got 'n.a.'
## Warning: Expecting numeric in D30878 / R30878C4: got 'n.a.'
## Warning: Expecting numeric in D30879 / R30879C4: got 'n.a.'
## Warning: Expecting numeric in D30880 / R30880C4: got 'n.a.'
## Warning: Expecting numeric in D30881 / R30881C4: got 'n.a.'
## Warning: Expecting numeric in D30882 / R30882C4: got 'n.a.'
## Warning: Expecting numeric in D30883 / R30883C4: got 'n.a.'
## Warning: Expecting numeric in D30884 / R30884C4: got 'n.a.'
## Warning: Expecting numeric in D30885 / R30885C4: got 'n.a.'
## Warning: Expecting numeric in D30886 / R30886C4: got 'n.a.'
## Warning: Expecting numeric in D30887 / R30887C4: got 'n.a.'
## Warning: Expecting numeric in D30888 / R30888C4: got 'n.a.'
## Warning: Expecting numeric in D30889 / R30889C4: got 'n.a.'
## Warning: Expecting numeric in D30890 / R30890C4: got 'n.a.'
## Warning: Expecting numeric in D30891 / R30891C4: got 'n.a.'
## Warning: Expecting numeric in D30892 / R30892C4: got 'n.a.'
## Warning: Expecting numeric in D30893 / R30893C4: got 'n.a.'
## Warning: Expecting numeric in D30894 / R30894C4: got 'n.a.'
## Warning: Expecting numeric in D30895 / R30895C4: got 'n.a.'
## Warning: Expecting numeric in D30896 / R30896C4: got 'n.a.'
## Warning: Expecting numeric in D30897 / R30897C4: got 'n.a.'
## Warning: Expecting numeric in D30898 / R30898C4: got 'n.a.'
## Warning: Expecting numeric in D30899 / R30899C4: got 'n.a.'
## Warning: Expecting numeric in D30900 / R30900C4: got 'n.a.'
## Warning: Expecting numeric in D30901 / R30901C4: got 'n.a.'
## Warning: Expecting numeric in D30902 / R30902C4: got 'n.a.'
## Warning: Expecting numeric in D30903 / R30903C4: got 'n.a.'
## Warning: Expecting numeric in D30904 / R30904C4: got 'n.a.'
## Warning: Expecting numeric in D30905 / R30905C4: got 'n.a.'
## Warning: Expecting numeric in D30906 / R30906C4: got 'n.a.'
## Warning: Expecting numeric in D30907 / R30907C4: got 'n.a.'
## Warning: Expecting numeric in D30908 / R30908C4: got 'n.a.'
## Warning: Expecting numeric in D30909 / R30909C4: got 'n.a.'
## Warning: Expecting numeric in D30910 / R30910C4: got 'n.a.'
## Warning: Expecting numeric in D30911 / R30911C4: got 'n.a.'
## Warning: Expecting numeric in D30912 / R30912C4: got 'n.a.'
## Warning: Expecting numeric in D30913 / R30913C4: got 'n.a.'
## Warning: Expecting numeric in D30914 / R30914C4: got 'n.a.'
## Warning: Expecting numeric in D30915 / R30915C4: got 'n.a.'
## Warning: Expecting numeric in D30916 / R30916C4: got 'n.a.'
## Warning: Expecting numeric in D30917 / R30917C4: got 'n.a.'
## Warning: Expecting numeric in D30918 / R30918C4: got 'n.a.'
## Warning: Expecting numeric in D30919 / R30919C4: got 'n.a.'
## Warning: Expecting numeric in D30920 / R30920C4: got 'n.a.'
## Warning: Expecting numeric in D30921 / R30921C4: got 'n.a.'
## Warning: Expecting numeric in D30922 / R30922C4: got 'n.a.'
## Warning: Expecting numeric in D30923 / R30923C4: got 'n.a.'
## Warning: Expecting numeric in D30924 / R30924C4: got 'n.a.'
## Warning: Expecting numeric in D30925 / R30925C4: got 'n.a.'
## Warning: Expecting numeric in D30926 / R30926C4: got 'n.a.'
## Warning: Expecting numeric in D30927 / R30927C4: got 'n.a.'
## Warning: Expecting numeric in D30928 / R30928C4: got 'n.a.'
## Warning: Expecting numeric in D30929 / R30929C4: got 'n.a.'
## Warning: Expecting numeric in D30930 / R30930C4: got 'n.a.'
## Warning: Expecting numeric in D30931 / R30931C4: got 'n.a.'
## Warning: Expecting numeric in D30932 / R30932C4: got 'n.a.'
## Warning: Expecting numeric in D30933 / R30933C4: got 'n.a.'
## Warning: Expecting numeric in D30934 / R30934C4: got 'n.a.'
## Warning: Expecting numeric in D30935 / R30935C4: got 'n.a.'
## Warning: Expecting numeric in D30936 / R30936C4: got 'n.a.'
## Warning: Expecting numeric in D30937 / R30937C4: got 'n.a.'
## Warning: Expecting numeric in D30938 / R30938C4: got 'n.a.'
## Warning: Expecting numeric in D30939 / R30939C4: got 'n.a.'
## Warning: Expecting numeric in D30940 / R30940C4: got 'n.a.'
## Warning: Expecting numeric in D30941 / R30941C4: got 'n.a.'
## Warning: Expecting numeric in D30942 / R30942C4: got 'n.a.'
## Warning: Expecting numeric in D30943 / R30943C4: got 'n.a.'
## Warning: Expecting numeric in D30944 / R30944C4: got 'n.a.'
## Warning: Expecting numeric in D30945 / R30945C4: got 'n.a.'
## Warning: Expecting numeric in D30946 / R30946C4: got 'n.a.'
## Warning: Expecting numeric in D30947 / R30947C4: got 'n.a.'
## Warning: Expecting numeric in D30948 / R30948C4: got 'n.a.'
## Warning: Expecting numeric in D30949 / R30949C4: got 'n.a.'
## Warning: Expecting numeric in D30950 / R30950C4: got 'n.a.'
## Warning: Expecting numeric in D30951 / R30951C4: got 'n.a.'
## Warning: Expecting numeric in D30952 / R30952C4: got 'n.a.'
## Warning: Expecting numeric in D30953 / R30953C4: got 'n.a.'
## Warning: Expecting numeric in D30954 / R30954C4: got 'n.a.'
## Warning: Expecting numeric in D30955 / R30955C4: got 'n.a.'
## Warning: Expecting numeric in D30956 / R30956C4: got 'n.a.'
## Warning: Expecting numeric in D30957 / R30957C4: got 'n.a.'
## Warning: Expecting numeric in D30958 / R30958C4: got 'n.a.'
## Warning: Expecting numeric in D30959 / R30959C4: got 'n.a.'
## Warning: Expecting numeric in D30960 / R30960C4: got 'n.a.'
## Warning: Expecting numeric in D30961 / R30961C4: got 'n.a.'
## Warning: Expecting numeric in D30962 / R30962C4: got 'n.a.'
## Warning: Expecting numeric in D30963 / R30963C4: got 'n.a.'
## Warning: Expecting numeric in D30964 / R30964C4: got 'n.a.'
## Warning: Expecting numeric in D30965 / R30965C4: got 'n.a.'
## Warning: Expecting numeric in D30966 / R30966C4: got 'n.a.'
## Warning: Expecting numeric in D30967 / R30967C4: got 'n.a.'
## Warning: Expecting numeric in D30968 / R30968C4: got 'n.a.'
## Warning: Expecting numeric in D30969 / R30969C4: got 'n.a.'
## Warning: Expecting numeric in D30970 / R30970C4: got 'n.a.'
## Warning: Expecting numeric in D30971 / R30971C4: got 'n.a.'
## Warning: Expecting numeric in D30972 / R30972C4: got 'n.a.'
## Warning: Expecting numeric in D30973 / R30973C4: got 'n.a.'
## Warning: Expecting numeric in D30974 / R30974C4: got 'n.a.'
## Warning: Expecting numeric in D30975 / R30975C4: got 'n.a.'
## Warning: Expecting numeric in D30976 / R30976C4: got 'n.a.'
## Warning: Expecting numeric in D30977 / R30977C4: got 'n.a.'
## Warning: Expecting numeric in D30978 / R30978C4: got 'n.a.'
## Warning: Expecting numeric in D30979 / R30979C4: got 'n.a.'
## Warning: Expecting numeric in D30980 / R30980C4: got 'n.a.'
## Warning: Expecting numeric in D30981 / R30981C4: got 'n.a.'
## Warning: Expecting numeric in D30982 / R30982C4: got 'n.a.'
## Warning: Expecting numeric in D30983 / R30983C4: got 'n.a.'
## Warning: Expecting numeric in D30984 / R30984C4: got 'n.a.'
## Warning: Expecting numeric in D30985 / R30985C4: got 'n.a.'
## Warning: Expecting numeric in D30986 / R30986C4: got 'n.a.'
## Warning: Expecting numeric in D30987 / R30987C4: got 'n.a.'
## Warning: Expecting numeric in D30988 / R30988C4: got 'n.a.'
## Warning: Expecting numeric in D30989 / R30989C4: got 'n.a.'
## Warning: Expecting numeric in D30990 / R30990C4: got 'n.a.'
## Warning: Expecting numeric in D30991 / R30991C4: got 'n.a.'
## Warning: Expecting numeric in D30992 / R30992C4: got 'n.a.'
## Warning: Expecting numeric in D30993 / R30993C4: got 'n.a.'
## Warning: Expecting numeric in D30994 / R30994C4: got 'n.a.'
## Warning: Expecting numeric in D30995 / R30995C4: got 'n.a.'
## Warning: Expecting numeric in D30996 / R30996C4: got 'n.a.'
## Warning: Expecting numeric in D30997 / R30997C4: got 'n.a.'
## Warning: Expecting numeric in D30998 / R30998C4: got 'n.a.'
## Warning: Expecting numeric in D30999 / R30999C4: got 'n.a.'
## Warning: Expecting numeric in D31000 / R31000C4: got 'n.a.'
## Warning: Expecting numeric in D31001 / R31001C4: got 'n.a.'
## Warning: Expecting numeric in D31002 / R31002C4: got 'n.a.'
## Warning: Expecting numeric in D31003 / R31003C4: got 'n.a.'
## Warning: Expecting numeric in D31004 / R31004C4: got 'n.a.'
## Warning: Expecting numeric in D31005 / R31005C4: got 'n.a.'
## Warning: Expecting numeric in D31006 / R31006C4: got 'n.a.'
## Warning: Expecting numeric in D31007 / R31007C4: got 'n.a.'
## Warning: Expecting numeric in D31008 / R31008C4: got 'n.a.'
## Warning: Expecting numeric in D31009 / R31009C4: got 'n.a.'
## Warning: Expecting numeric in D31010 / R31010C4: got 'n.a.'
## Warning: Expecting numeric in D31011 / R31011C4: got 'n.a.'
## Warning: Expecting numeric in D31012 / R31012C4: got 'n.a.'
## Warning: Expecting numeric in D31013 / R31013C4: got 'n.a.'
## Warning: Expecting numeric in D31014 / R31014C4: got 'n.a.'
## Warning: Expecting numeric in D31015 / R31015C4: got 'n.a.'
## Warning: Expecting numeric in D31016 / R31016C4: got 'n.a.'
## Warning: Expecting numeric in D31017 / R31017C4: got 'n.a.'
## Warning: Expecting numeric in D31018 / R31018C4: got 'n.a.'
## Warning: Expecting numeric in D31019 / R31019C4: got 'n.a.'
## Warning: Expecting numeric in D31020 / R31020C4: got 'n.a.'
## Warning: Expecting numeric in D31021 / R31021C4: got 'n.a.'
## Warning: Expecting numeric in D31022 / R31022C4: got 'n.a.'
## Warning: Expecting numeric in D31023 / R31023C4: got 'n.a.'
## Warning: Expecting numeric in D31024 / R31024C4: got 'n.a.'
## Warning: Expecting numeric in D31025 / R31025C4: got 'n.a.'
## Warning: Expecting numeric in D31026 / R31026C4: got 'n.a.'
## Warning: Expecting numeric in D31027 / R31027C4: got 'n.a.'
## Warning: Expecting numeric in D31028 / R31028C4: got 'n.a.'
## Warning: Expecting numeric in D31029 / R31029C4: got 'n.a.'
## Warning: Expecting numeric in D31030 / R31030C4: got 'n.a.'
## Warning: Expecting numeric in D31031 / R31031C4: got 'n.a.'
## Warning: Expecting numeric in D31032 / R31032C4: got 'n.a.'
## Warning: Expecting numeric in D31033 / R31033C4: got 'n.a.'
## Warning: Expecting numeric in D31034 / R31034C4: got 'n.a.'
## Warning: Expecting numeric in D31035 / R31035C4: got 'n.a.'
## Warning: Expecting numeric in D31036 / R31036C4: got 'n.a.'
## Warning: Expecting numeric in D31037 / R31037C4: got 'n.a.'
## Warning: Expecting numeric in D31038 / R31038C4: got 'n.a.'
## Warning: Expecting numeric in D31039 / R31039C4: got 'n.a.'
## Warning: Expecting numeric in D31040 / R31040C4: got 'n.a.'
## Warning: Expecting numeric in D31041 / R31041C4: got 'n.a.'
## Warning: Expecting numeric in D31042 / R31042C4: got 'n.a.'
## Warning: Expecting numeric in D31043 / R31043C4: got 'n.a.'
## Warning: Expecting numeric in D31044 / R31044C4: got 'n.a.'
## Warning: Expecting numeric in D31045 / R31045C4: got 'n.a.'
## Warning: Expecting numeric in D31046 / R31046C4: got 'n.a.'
## Warning: Expecting numeric in D31047 / R31047C4: got 'n.a.'
## Warning: Expecting numeric in D31048 / R31048C4: got 'n.a.'
## Warning: Expecting numeric in D31049 / R31049C4: got 'n.a.'
## Warning: Expecting numeric in D31050 / R31050C4: got 'n.a.'
## Warning: Expecting numeric in D31051 / R31051C4: got 'n.a.'
## Warning: Expecting numeric in D31052 / R31052C4: got 'n.a.'
## Warning: Expecting numeric in D31053 / R31053C4: got 'n.a.'
## Warning: Expecting numeric in D31054 / R31054C4: got 'n.a.'
## Warning: Expecting numeric in D31055 / R31055C4: got 'n.a.'
## Warning: Expecting numeric in D31056 / R31056C4: got 'n.a.'
## Warning: Expecting numeric in D31057 / R31057C4: got 'n.a.'
## Warning: Expecting numeric in D31058 / R31058C4: got 'n.a.'
## Warning: Expecting numeric in D31059 / R31059C4: got 'n.a.'
## Warning: Expecting numeric in D31060 / R31060C4: got 'n.a.'
## Warning: Expecting numeric in D31061 / R31061C4: got 'n.a.'
## Warning: Expecting numeric in D31062 / R31062C4: got 'n.a.'
## Warning: Expecting numeric in D31063 / R31063C4: got 'n.a.'
## Warning: Expecting numeric in D31064 / R31064C4: got 'n.a.'
## Warning: Expecting numeric in D31065 / R31065C4: got 'n.a.'
## Warning: Expecting numeric in D31066 / R31066C4: got 'n.a.'
## Warning: Expecting numeric in D31067 / R31067C4: got 'n.a.'
## Warning: Expecting numeric in D31068 / R31068C4: got 'n.a.'
## Warning: Expecting numeric in D31069 / R31069C4: got 'n.a.'
## Warning: Expecting numeric in D31070 / R31070C4: got 'n.a.'
## Warning: Expecting numeric in D31071 / R31071C4: got 'n.a.'
## Warning: Expecting numeric in D31072 / R31072C4: got 'n.a.'
## Warning: Expecting numeric in D31073 / R31073C4: got 'n.a.'
## Warning: Expecting numeric in D31074 / R31074C4: got 'n.a.'
## Warning: Expecting numeric in D31075 / R31075C4: got 'n.a.'
## Warning: Expecting numeric in D31076 / R31076C4: got 'n.a.'
## Warning: Expecting numeric in D31077 / R31077C4: got 'n.a.'
## Warning: Expecting numeric in D31078 / R31078C4: got 'n.a.'
## Warning: Expecting numeric in D31079 / R31079C4: got 'n.a.'
## Warning: Expecting numeric in D31080 / R31080C4: got 'n.a.'
## Warning: Expecting numeric in D31081 / R31081C4: got 'n.a.'
## Warning: Expecting numeric in D31082 / R31082C4: got 'n.a.'
## Warning: Expecting numeric in D31083 / R31083C4: got 'n.a.'
## Warning: Expecting numeric in D31084 / R31084C4: got 'n.a.'
## Warning: Expecting numeric in D31085 / R31085C4: got 'n.a.'
## Warning: Expecting numeric in D31086 / R31086C4: got 'n.a.'
## Warning: Expecting numeric in D31087 / R31087C4: got 'n.a.'
## Warning: Expecting numeric in D31088 / R31088C4: got 'n.a.'
## Warning: Expecting numeric in D31089 / R31089C4: got 'n.a.'
## Warning: Expecting numeric in D31090 / R31090C4: got 'n.a.'
## Warning: Expecting numeric in D31091 / R31091C4: got 'n.a.'
## Warning: Expecting numeric in D31092 / R31092C4: got 'n.a.'
## Warning: Expecting numeric in D31093 / R31093C4: got 'n.a.'
## Warning: Expecting numeric in D31094 / R31094C4: got 'n.a.'
## Warning: Expecting numeric in D31095 / R31095C4: got 'n.a.'
## Warning: Expecting numeric in D31096 / R31096C4: got 'n.a.'
## Warning: Expecting numeric in D31097 / R31097C4: got 'n.a.'
## Warning: Expecting numeric in D31098 / R31098C4: got 'n.a.'
## Warning: Expecting numeric in D31099 / R31099C4: got 'n.a.'
## Warning: Expecting numeric in D31100 / R31100C4: got 'n.a.'
## Warning: Expecting numeric in D31101 / R31101C4: got 'n.a.'
## Warning: Expecting numeric in D31102 / R31102C4: got 'n.a.'
## Warning: Expecting numeric in D31103 / R31103C4: got 'n.a.'
## Warning: Expecting numeric in D31104 / R31104C4: got 'n.a.'
## Warning: Expecting numeric in D31105 / R31105C4: got 'n.a.'
## Warning: Expecting numeric in D31106 / R31106C4: got 'n.a.'
## Warning: Expecting numeric in D31107 / R31107C4: got 'n.a.'
## Warning: Expecting numeric in D31108 / R31108C4: got 'n.a.'
## Warning: Expecting numeric in D31109 / R31109C4: got 'n.a.'
## Warning: Expecting numeric in D31110 / R31110C4: got 'n.a.'
## Warning: Expecting numeric in D31111 / R31111C4: got 'n.a.'
## Warning: Expecting numeric in D31112 / R31112C4: got 'n.a.'
## Warning: Expecting numeric in D31113 / R31113C4: got 'n.a.'
## Warning: Expecting numeric in D31114 / R31114C4: got 'n.a.'
## Warning: Expecting numeric in D31115 / R31115C4: got 'n.a.'
## Warning: Expecting numeric in D31116 / R31116C4: got 'n.a.'
## Warning: Expecting numeric in D31117 / R31117C4: got 'n.a.'
## Warning: Expecting numeric in D31118 / R31118C4: got 'n.a.'
## Warning: Expecting numeric in D31119 / R31119C4: got 'n.a.'
## Warning: Expecting numeric in D31120 / R31120C4: got 'n.a.'
## Warning: Expecting numeric in D31121 / R31121C4: got 'n.a.'
## Warning: Expecting numeric in D31122 / R31122C4: got 'n.a.'
## Warning: Expecting numeric in D31123 / R31123C4: got 'n.a.'
## Warning: Expecting numeric in D31124 / R31124C4: got 'n.a.'
## Warning: Expecting numeric in D31125 / R31125C4: got 'n.a.'
## Warning: Expecting numeric in D31126 / R31126C4: got 'n.a.'
## Warning: Expecting numeric in D31127 / R31127C4: got 'n.a.'
## Warning: Expecting numeric in D31128 / R31128C4: got 'n.a.'
## Warning: Expecting numeric in D31129 / R31129C4: got 'n.a.'
## Warning: Expecting numeric in D31130 / R31130C4: got 'n.a.'
## Warning: Expecting numeric in D31131 / R31131C4: got 'n.a.'
## Warning: Expecting numeric in D31132 / R31132C4: got 'n.a.'
## Warning: Expecting numeric in D31133 / R31133C4: got 'n.a.'
## Warning: Expecting numeric in D31134 / R31134C4: got 'n.a.'
## Warning: Expecting numeric in D31135 / R31135C4: got 'n.a.'
## Warning: Expecting numeric in D31136 / R31136C4: got 'n.a.'
## Warning: Expecting numeric in D31137 / R31137C4: got 'n.a.'
## Warning: Expecting numeric in D31138 / R31138C4: got 'n.a.'
## Warning: Expecting numeric in D31139 / R31139C4: got 'n.a.'
## Warning: Expecting numeric in D31140 / R31140C4: got 'n.a.'
## Warning: Expecting numeric in D31141 / R31141C4: got 'n.a.'
## Warning: Expecting numeric in D31142 / R31142C4: got 'n.a.'
## Warning: Expecting numeric in D31143 / R31143C4: got 'n.a.'
## Warning: Expecting numeric in D31144 / R31144C4: got 'n.a.'
## Warning: Expecting numeric in D31145 / R31145C4: got 'n.a.'
## Warning: Expecting numeric in D31146 / R31146C4: got 'n.a.'
## Warning: Expecting numeric in D31147 / R31147C4: got 'n.a.'
## Warning: Expecting numeric in D31148 / R31148C4: got 'n.a.'
## Warning: Expecting numeric in D31149 / R31149C4: got 'n.a.'
## Warning: Expecting numeric in D31150 / R31150C4: got 'n.a.'
## Warning: Expecting numeric in D31151 / R31151C4: got 'n.a.'
## Warning: Expecting numeric in D31152 / R31152C4: got 'n.a.'
## Warning: Expecting numeric in D31153 / R31153C4: got 'n.a.'
## Warning: Expecting numeric in D31154 / R31154C4: got 'n.a.'
## Warning: Expecting numeric in D31155 / R31155C4: got 'n.a.'
## Warning: Expecting numeric in D31156 / R31156C4: got 'n.a.'
## Warning: Expecting numeric in D31157 / R31157C4: got 'n.a.'
## Warning: Expecting numeric in D31158 / R31158C4: got 'n.a.'
## Warning: Expecting numeric in D31159 / R31159C4: got 'n.a.'
## Warning: Expecting numeric in D31160 / R31160C4: got 'n.a.'
## Warning: Expecting numeric in D31161 / R31161C4: got 'n.a.'
## Warning: Expecting numeric in D31162 / R31162C4: got 'n.a.'
## Warning: Expecting numeric in D31163 / R31163C4: got 'n.a.'
## Warning: Expecting numeric in D31164 / R31164C4: got 'n.a.'
## Warning: Expecting numeric in D31165 / R31165C4: got 'n.a.'
## Warning: Expecting numeric in D31166 / R31166C4: got 'n.a.'
## Warning: Expecting numeric in D31167 / R31167C4: got 'n.a.'
## Warning: Expecting numeric in D31168 / R31168C4: got 'n.a.'
## Warning: Expecting numeric in D31169 / R31169C4: got 'n.a.'
## Warning: Expecting numeric in D31170 / R31170C4: got 'n.a.'
## Warning: Expecting numeric in D31171 / R31171C4: got 'n.a.'
## Warning: Expecting numeric in D31172 / R31172C4: got 'n.a.'
## Warning: Expecting numeric in D31173 / R31173C4: got 'n.a.'
## Warning: Expecting numeric in D31174 / R31174C4: got 'n.a.'
## Warning: Expecting numeric in D31175 / R31175C4: got 'n.a.'
## Warning: Expecting numeric in D31176 / R31176C4: got 'n.a.'
## Warning: Expecting numeric in D31177 / R31177C4: got 'n.a.'
## Warning: Expecting numeric in D31178 / R31178C4: got 'n.a.'
## Warning: Expecting numeric in D31179 / R31179C4: got 'n.a.'
## Warning: Expecting numeric in D31180 / R31180C4: got 'n.a.'
## Warning: Expecting numeric in D31181 / R31181C4: got 'n.a.'
## Warning: Expecting numeric in D31182 / R31182C4: got 'n.a.'
## Warning: Expecting numeric in D31183 / R31183C4: got 'n.a.'
## Warning: Expecting numeric in D31184 / R31184C4: got 'n.a.'
## Warning: Expecting numeric in D31185 / R31185C4: got 'n.a.'
## Warning: Expecting numeric in D31186 / R31186C4: got 'n.a.'
## Warning: Expecting numeric in D31187 / R31187C4: got 'n.a.'
## Warning: Expecting numeric in D31188 / R31188C4: got 'n.a.'
## Warning: Expecting numeric in D31189 / R31189C4: got 'n.a.'
## Warning: Expecting numeric in D31190 / R31190C4: got 'n.a.'
## Warning: Expecting numeric in D31191 / R31191C4: got 'n.a.'
## Warning: Expecting numeric in D31192 / R31192C4: got 'n.a.'
## Warning: Expecting numeric in D31193 / R31193C4: got 'n.a.'
## Warning: Expecting numeric in D31194 / R31194C4: got 'n.a.'
## Warning: Expecting numeric in D31195 / R31195C4: got 'n.a.'
## Warning: Expecting numeric in D31196 / R31196C4: got 'n.a.'
## Warning: Expecting numeric in D31197 / R31197C4: got 'n.a.'
## Warning: Expecting numeric in D31198 / R31198C4: got 'n.a.'
## Warning: Expecting numeric in D31199 / R31199C4: got 'n.a.'
## Warning: Expecting numeric in D31200 / R31200C4: got 'n.a.'
## Warning: Expecting numeric in D31201 / R31201C4: got 'n.a.'
## Warning: Expecting numeric in D31202 / R31202C4: got 'n.a.'
## Warning: Expecting numeric in D31203 / R31203C4: got 'n.a.'
## Warning: Expecting numeric in D31204 / R31204C4: got 'n.a.'
## Warning: Expecting numeric in D31205 / R31205C4: got 'n.a.'
## Warning: Expecting numeric in D31206 / R31206C4: got 'n.a.'
## Warning: Expecting numeric in D31207 / R31207C4: got 'n.a.'
## Warning: Expecting numeric in D31208 / R31208C4: got 'n.a.'
## Warning: Expecting numeric in D31209 / R31209C4: got 'n.a.'
## Warning: Expecting numeric in D31210 / R31210C4: got 'n.a.'
## Warning: Expecting numeric in D31211 / R31211C4: got 'n.a.'
## Warning: Expecting numeric in D31212 / R31212C4: got 'n.a.'
## Warning: Expecting numeric in D31213 / R31213C4: got 'n.a.'
## Warning: Expecting numeric in D31214 / R31214C4: got 'n.a.'
## Warning: Expecting numeric in D31215 / R31215C4: got 'n.a.'
## Warning: Expecting numeric in D31216 / R31216C4: got 'n.a.'
## Warning: Expecting numeric in D31217 / R31217C4: got 'n.a.'
## Warning: Expecting numeric in D31218 / R31218C4: got 'n.a.'
## Warning: Expecting numeric in D31219 / R31219C4: got 'n.a.'
## Warning: Expecting numeric in D31220 / R31220C4: got 'n.a.'
## Warning: Expecting numeric in D31221 / R31221C4: got 'n.a.'
## Warning: Expecting numeric in D31222 / R31222C4: got 'n.a.'
## Warning: Expecting numeric in D31223 / R31223C4: got 'n.a.'
## Warning: Expecting numeric in D31224 / R31224C4: got 'n.a.'
## Warning: Expecting numeric in D31225 / R31225C4: got 'n.a.'
## Warning: Expecting numeric in D31226 / R31226C4: got 'n.a.'
## Warning: Expecting numeric in D31227 / R31227C4: got 'n.a.'
## Warning: Expecting numeric in D31228 / R31228C4: got 'n.a.'
## Warning: Expecting numeric in D31229 / R31229C4: got 'n.a.'
## Warning: Expecting numeric in D31230 / R31230C4: got 'n.a.'
## Warning: Expecting numeric in D31231 / R31231C4: got 'n.a.'
## Warning: Expecting numeric in D31232 / R31232C4: got 'n.a.'
## Warning: Expecting numeric in D31233 / R31233C4: got 'n.a.'
## Warning: Expecting numeric in D31234 / R31234C4: got 'n.a.'
## Warning: Expecting numeric in D31235 / R31235C4: got 'n.a.'
## Warning: Expecting numeric in D31236 / R31236C4: got 'n.a.'
## Warning: Expecting numeric in D31237 / R31237C4: got 'n.a.'
## Warning: Expecting numeric in D31238 / R31238C4: got 'n.a.'
## Warning: Expecting numeric in D31239 / R31239C4: got 'n.a.'
## Warning: Expecting numeric in D31240 / R31240C4: got 'n.a.'
## Warning: Expecting numeric in D31241 / R31241C4: got 'n.a.'
## Warning: Expecting numeric in D31242 / R31242C4: got 'n.a.'
## Warning: Expecting numeric in D31243 / R31243C4: got 'n.a.'
## Warning: Expecting numeric in D31244 / R31244C4: got 'n.a.'
## Warning: Expecting numeric in D31245 / R31245C4: got 'n.a.'
## Warning: Expecting numeric in D31246 / R31246C4: got 'n.a.'
## Warning: Expecting numeric in D31247 / R31247C4: got 'n.a.'
## Warning: Expecting numeric in D31248 / R31248C4: got 'n.a.'
## Warning: Expecting numeric in D31249 / R31249C4: got 'n.a.'
## Warning: Expecting numeric in D31250 / R31250C4: got 'n.a.'
## Warning: Expecting numeric in D31251 / R31251C4: got 'n.a.'
## Warning: Expecting numeric in D31252 / R31252C4: got 'n.a.'
## Warning: Expecting numeric in D31253 / R31253C4: got 'n.a.'
## Warning: Expecting numeric in D31254 / R31254C4: got 'n.a.'
## Warning: Expecting numeric in D31255 / R31255C4: got 'n.a.'
## Warning: Expecting numeric in D31256 / R31256C4: got 'n.a.'
## Warning: Expecting numeric in D31257 / R31257C4: got 'n.a.'
## Warning: Expecting numeric in D31258 / R31258C4: got 'n.a.'
## Warning: Expecting numeric in D31259 / R31259C4: got 'n.a.'
## Warning: Expecting numeric in D31260 / R31260C4: got 'n.a.'
## Warning: Expecting numeric in D31261 / R31261C4: got 'n.a.'
## Warning: Expecting numeric in D31262 / R31262C4: got 'n.a.'
## Warning: Expecting numeric in D31263 / R31263C4: got 'n.a.'
## Warning: Expecting numeric in D31264 / R31264C4: got 'n.a.'
## Warning: Expecting numeric in D31265 / R31265C4: got 'n.a.'
## Warning: Expecting numeric in D31266 / R31266C4: got 'n.a.'
## Warning: Expecting numeric in D31267 / R31267C4: got 'n.a.'
## Warning: Expecting numeric in D31268 / R31268C4: got 'n.a.'
## Warning: Expecting numeric in D31269 / R31269C4: got 'n.a.'
## Warning: Expecting numeric in D31270 / R31270C4: got 'n.a.'
## Warning: Expecting numeric in D31271 / R31271C4: got 'n.a.'
## Warning: Expecting numeric in D31272 / R31272C4: got 'n.a.'
## Warning: Expecting numeric in D31273 / R31273C4: got 'n.a.'
## Warning: Expecting numeric in D31274 / R31274C4: got 'n.a.'
## Warning: Expecting numeric in D31275 / R31275C4: got 'n.a.'
## Warning: Expecting numeric in D31276 / R31276C4: got 'n.a.'
## Warning: Expecting numeric in D31277 / R31277C4: got 'n.a.'
## Warning: Expecting numeric in D31278 / R31278C4: got 'n.a.'
## Warning: Expecting numeric in D31279 / R31279C4: got 'n.a.'
## Warning: Expecting numeric in D31280 / R31280C4: got 'n.a.'
## Warning: Expecting numeric in D31281 / R31281C4: got 'n.a.'
## Warning: Expecting numeric in D31282 / R31282C4: got 'n.a.'
## Warning: Expecting numeric in D31283 / R31283C4: got 'n.a.'
## Warning: Expecting numeric in D31284 / R31284C4: got 'n.a.'
## Warning: Expecting numeric in D31285 / R31285C4: got 'n.a.'
## Warning: Expecting numeric in D31286 / R31286C4: got 'n.a.'
## Warning: Expecting numeric in D31287 / R31287C4: got 'n.a.'
## Warning: Expecting numeric in D31288 / R31288C4: got 'n.a.'
## Warning: Expecting numeric in D31289 / R31289C4: got 'n.a.'
## Warning: Expecting numeric in D31290 / R31290C4: got 'n.a.'
## Warning: Expecting numeric in D31291 / R31291C4: got 'n.a.'
## Warning: Expecting numeric in D31292 / R31292C4: got 'n.a.'
## Warning: Expecting numeric in D31293 / R31293C4: got 'n.a.'
## Warning: Expecting numeric in D31294 / R31294C4: got 'n.a.'
## Warning: Expecting numeric in D31295 / R31295C4: got 'n.a.'
## Warning: Expecting numeric in D31296 / R31296C4: got 'n.a.'
## Warning: Expecting numeric in D31297 / R31297C4: got 'n.a.'
## Warning: Expecting numeric in D31298 / R31298C4: got 'n.a.'
## Warning: Expecting numeric in D31299 / R31299C4: got 'n.a.'
## Warning: Expecting numeric in D31300 / R31300C4: got 'n.a.'
## Warning: Expecting numeric in D31301 / R31301C4: got 'n.a.'
## Warning: Expecting numeric in D31302 / R31302C4: got 'n.a.'
## Warning: Expecting numeric in D31303 / R31303C4: got 'n.a.'
## Warning: Expecting numeric in D31304 / R31304C4: got 'n.a.'
## Warning: Expecting numeric in D31305 / R31305C4: got 'n.a.'
## Warning: Expecting numeric in D31306 / R31306C4: got 'n.a.'
## Warning: Expecting numeric in D31307 / R31307C4: got 'n.a.'
## Warning: Expecting numeric in D31308 / R31308C4: got 'n.a.'
## Warning: Expecting numeric in D31309 / R31309C4: got 'n.a.'
## Warning: Expecting numeric in D31310 / R31310C4: got 'n.a.'
## Warning: Expecting numeric in D31311 / R31311C4: got 'n.a.'
## Warning: Expecting numeric in D31312 / R31312C4: got 'n.a.'
## Warning: Expecting numeric in D31313 / R31313C4: got 'n.a.'
## Warning: Expecting numeric in D31314 / R31314C4: got 'n.a.'
## Warning: Expecting numeric in D31315 / R31315C4: got 'n.a.'
## Warning: Expecting numeric in D31316 / R31316C4: got 'n.a.'
## Warning: Expecting numeric in D31317 / R31317C4: got 'n.a.'
## Warning: Expecting numeric in D31318 / R31318C4: got 'n.a.'
## Warning: Expecting numeric in D31319 / R31319C4: got 'n.a.'
## Warning: Expecting numeric in D31320 / R31320C4: got 'n.a.'
## Warning: Expecting numeric in D31321 / R31321C4: got 'n.a.'
## Warning: Expecting numeric in D31322 / R31322C4: got 'n.a.'
## Warning: Expecting numeric in D31323 / R31323C4: got 'n.a.'
## Warning: Expecting numeric in D31324 / R31324C4: got 'n.a.'
## Warning: Expecting numeric in D31325 / R31325C4: got 'n.a.'
## Warning: Expecting numeric in D31326 / R31326C4: got 'n.a.'
## Warning: Expecting numeric in D31327 / R31327C4: got 'n.a.'
## Warning: Expecting numeric in D31328 / R31328C4: got 'n.a.'
## Warning: Expecting numeric in D31329 / R31329C4: got 'n.a.'
## Warning: Expecting numeric in D31330 / R31330C4: got 'n.a.'
## Warning: Expecting numeric in D31331 / R31331C4: got 'n.a.'
## Warning: Expecting numeric in D31332 / R31332C4: got 'n.a.'
## Warning: Expecting numeric in D31333 / R31333C4: got 'n.a.'
## Warning: Expecting numeric in D31334 / R31334C4: got 'n.a.'
## Warning: Expecting numeric in D31335 / R31335C4: got 'n.a.'
## Warning: Expecting numeric in D31336 / R31336C4: got 'n.a.'
## Warning: Expecting numeric in D31337 / R31337C4: got 'n.a.'
## Warning: Expecting numeric in D31338 / R31338C4: got 'n.a.'
## Warning: Expecting numeric in D31339 / R31339C4: got 'n.a.'
## Warning: Expecting numeric in D31340 / R31340C4: got 'n.a.'
## Warning: Expecting numeric in D31341 / R31341C4: got 'n.a.'
## Warning: Expecting numeric in D31342 / R31342C4: got 'n.a.'
## Warning: Expecting numeric in D31343 / R31343C4: got 'n.a.'
## Warning: Expecting numeric in D31344 / R31344C4: got 'n.a.'
## Warning: Expecting numeric in D31345 / R31345C4: got 'n.a.'
## Warning: Expecting numeric in D31346 / R31346C4: got 'n.a.'
## Warning: Expecting numeric in D31347 / R31347C4: got 'n.a.'
## Warning: Expecting numeric in D31348 / R31348C4: got 'n.a.'
## Warning: Expecting numeric in D31349 / R31349C4: got 'n.a.'
## Warning: Expecting numeric in D31350 / R31350C4: got 'n.a.'
## Warning: Expecting numeric in D31351 / R31351C4: got 'n.a.'
## Warning: Expecting numeric in D31352 / R31352C4: got 'n.a.'
## Warning: Expecting numeric in D31353 / R31353C4: got 'n.a.'
## Warning: Expecting numeric in D31354 / R31354C4: got 'n.a.'
## Warning: Expecting numeric in D31355 / R31355C4: got 'n.a.'
## Warning: Expecting numeric in D31356 / R31356C4: got 'n.a.'
## Warning: Expecting numeric in D31357 / R31357C4: got 'n.a.'
## Warning: Expecting numeric in D31358 / R31358C4: got 'n.a.'
## Warning: Expecting numeric in D31359 / R31359C4: got 'n.a.'
## Warning: Expecting numeric in D31360 / R31360C4: got 'n.a.'
## Warning: Expecting numeric in D31361 / R31361C4: got 'n.a.'
## Warning: Expecting numeric in D31362 / R31362C4: got 'n.a.'
## Warning: Expecting numeric in D31363 / R31363C4: got 'n.a.'
## Warning: Expecting numeric in D31364 / R31364C4: got 'n.a.'
## Warning: Expecting numeric in D31365 / R31365C4: got 'n.a.'
## Warning: Expecting numeric in D31366 / R31366C4: got 'n.a.'
## Warning: Expecting numeric in D31367 / R31367C4: got 'n.a.'
## Warning: Expecting numeric in D31368 / R31368C4: got 'n.a.'
## Warning: Expecting numeric in D31369 / R31369C4: got 'n.a.'
## Warning: Expecting numeric in D31370 / R31370C4: got 'n.a.'
## Warning: Expecting numeric in D31371 / R31371C4: got 'n.a.'
## Warning: Expecting numeric in D31372 / R31372C4: got 'n.a.'
## Warning: Expecting numeric in D31373 / R31373C4: got 'n.a.'
## Warning: Expecting numeric in D31374 / R31374C4: got 'n.a.'
## Warning: Expecting numeric in D31375 / R31375C4: got 'n.a.'
## Warning: Expecting numeric in D31376 / R31376C4: got 'n.a.'
## Warning: Expecting numeric in D31377 / R31377C4: got 'n.a.'
## Warning: Expecting numeric in D31378 / R31378C4: got 'n.a.'
## Warning: Expecting numeric in D31379 / R31379C4: got 'n.a.'
## Warning: Expecting numeric in D31380 / R31380C4: got 'n.a.'
## Warning: Expecting numeric in D31381 / R31381C4: got 'n.a.'
## Warning: Expecting numeric in D31382 / R31382C4: got 'n.a.'
## Warning: Expecting numeric in D31383 / R31383C4: got 'n.a.'
## Warning: Expecting numeric in D31384 / R31384C4: got 'n.a.'
## Warning: Expecting numeric in D31385 / R31385C4: got 'n.a.'
## Warning: Expecting numeric in D31386 / R31386C4: got 'n.a.'
## Warning: Expecting numeric in D31387 / R31387C4: got 'n.a.'
## Warning: Expecting numeric in D31388 / R31388C4: got 'n.a.'
## Warning: Expecting numeric in D31389 / R31389C4: got 'n.a.'
## Warning: Expecting numeric in D31390 / R31390C4: got 'n.a.'
## Warning: Expecting numeric in D31391 / R31391C4: got 'n.a.'
## Warning: Expecting numeric in D31392 / R31392C4: got 'n.a.'
## Warning: Expecting numeric in D31393 / R31393C4: got 'n.a.'
## Warning: Expecting numeric in D31394 / R31394C4: got 'n.a.'
## Warning: Expecting numeric in D31395 / R31395C4: got 'n.a.'
## Warning: Expecting numeric in D31396 / R31396C4: got 'n.a.'
## Warning: Expecting numeric in D31397 / R31397C4: got 'n.a.'
## Warning: Expecting numeric in D31398 / R31398C4: got 'n.a.'
## Warning: Expecting numeric in D31399 / R31399C4: got 'n.a.'
## Warning: Expecting numeric in D31400 / R31400C4: got 'n.a.'
## Warning: Expecting numeric in D31401 / R31401C4: got 'n.a.'
## Warning: Expecting numeric in D31402 / R31402C4: got 'n.a.'
## Warning: Expecting numeric in D31403 / R31403C4: got 'n.a.'
## Warning: Expecting numeric in D31404 / R31404C4: got 'n.a.'
## Warning: Expecting numeric in D31405 / R31405C4: got 'n.a.'
## Warning: Expecting numeric in D31406 / R31406C4: got 'n.a.'
## Warning: Expecting numeric in D31407 / R31407C4: got 'n.a.'
## Warning: Expecting numeric in D31408 / R31408C4: got 'n.a.'
## Warning: Expecting numeric in D31409 / R31409C4: got 'n.a.'
## Warning: Expecting numeric in D31410 / R31410C4: got 'n.a.'
## Warning: Expecting numeric in D31411 / R31411C4: got 'n.a.'
## Warning: Expecting numeric in D31412 / R31412C4: got 'n.a.'
## Warning: Expecting numeric in D31413 / R31413C4: got 'n.a.'
## Warning: Expecting numeric in D31414 / R31414C4: got 'n.a.'
## Warning: Expecting numeric in D31415 / R31415C4: got 'n.a.'
## Warning: Expecting numeric in D31416 / R31416C4: got 'n.a.'
## Warning: Expecting numeric in D31417 / R31417C4: got 'n.a.'
## Warning: Expecting numeric in D31418 / R31418C4: got 'n.a.'
## Warning: Expecting numeric in D31419 / R31419C4: got 'n.a.'
## Warning: Expecting numeric in D31420 / R31420C4: got 'n.a.'
## Warning: Expecting numeric in D31421 / R31421C4: got 'n.a.'
## Warning: Expecting numeric in D31422 / R31422C4: got 'n.a.'
## Warning: Expecting numeric in D31423 / R31423C4: got 'n.a.'
## Warning: Expecting numeric in D31424 / R31424C4: got 'n.a.'
## Warning: Expecting numeric in D31425 / R31425C4: got 'n.a.'
## Warning: Expecting numeric in D31426 / R31426C4: got 'n.a.'
## Warning: Expecting numeric in D31427 / R31427C4: got 'n.a.'
## Warning: Expecting numeric in D31428 / R31428C4: got 'n.a.'
## Warning: Expecting numeric in D31429 / R31429C4: got 'n.a.'
## Warning: Expecting numeric in D31430 / R31430C4: got 'n.a.'
## Warning: Expecting numeric in D31431 / R31431C4: got 'n.a.'
## Warning: Expecting numeric in D31432 / R31432C4: got 'n.a.'
## Warning: Expecting numeric in D31433 / R31433C4: got 'n.a.'
## Warning: Expecting numeric in D31434 / R31434C4: got 'n.a.'
## Warning: Expecting numeric in D31435 / R31435C4: got 'n.a.'
## Warning: Expecting numeric in D31436 / R31436C4: got 'n.a.'
## Warning: Expecting numeric in D31437 / R31437C4: got 'n.a.'
## Warning: Expecting numeric in D31438 / R31438C4: got 'n.a.'
## Warning: Expecting numeric in D31439 / R31439C4: got 'n.a.'
## Warning: Expecting numeric in D31440 / R31440C4: got 'n.a.'
## Warning: Expecting numeric in D31441 / R31441C4: got 'n.a.'
## Warning: Expecting numeric in D31442 / R31442C4: got 'n.a.'
## Warning: Expecting numeric in D31443 / R31443C4: got 'n.a.'
## Warning: Expecting numeric in D31444 / R31444C4: got 'n.a.'
## Warning: Expecting numeric in D31445 / R31445C4: got 'n.a.'
## Warning: Expecting numeric in D31446 / R31446C4: got 'n.a.'
## Warning: Expecting numeric in D31447 / R31447C4: got 'n.a.'
## Warning: Expecting numeric in D31448 / R31448C4: got 'n.a.'
## Warning: Expecting numeric in D31449 / R31449C4: got 'n.a.'
## Warning: Expecting numeric in D31450 / R31450C4: got 'n.a.'
## Warning: Expecting numeric in D31451 / R31451C4: got 'n.a.'
## Warning: Expecting numeric in D31452 / R31452C4: got 'n.a.'
## Warning: Expecting numeric in D31453 / R31453C4: got 'n.a.'
## Warning: Expecting numeric in D31454 / R31454C4: got 'n.a.'
## Warning: Expecting numeric in D31455 / R31455C4: got 'n.a.'
## Warning: Expecting numeric in D31456 / R31456C4: got 'n.a.'
## Warning: Expecting numeric in D31457 / R31457C4: got 'n.a.'
## Warning: Expecting numeric in D31458 / R31458C4: got 'n.a.'
## Warning: Expecting numeric in D31459 / R31459C4: got 'n.a.'
## Warning: Expecting numeric in D31460 / R31460C4: got 'n.a.'
## Warning: Expecting numeric in D31461 / R31461C4: got 'n.a.'
## Warning: Expecting numeric in D31462 / R31462C4: got 'n.a.'
## Warning: Expecting numeric in D31463 / R31463C4: got 'n.a.'
## Warning: Expecting numeric in D31464 / R31464C4: got 'n.a.'
## Warning: Expecting numeric in D31465 / R31465C4: got 'n.a.'
## Warning: Expecting numeric in D31466 / R31466C4: got 'n.a.'
## Warning: Expecting numeric in D31467 / R31467C4: got 'n.a.'
## Warning: Expecting numeric in D31468 / R31468C4: got 'n.a.'
## Warning: Expecting numeric in D31469 / R31469C4: got 'n.a.'
## Warning: Expecting numeric in D31470 / R31470C4: got 'n.a.'
## Warning: Expecting numeric in D31471 / R31471C4: got 'n.a.'
## Warning: Expecting numeric in D31472 / R31472C4: got 'n.a.'
## Warning: Expecting numeric in D31473 / R31473C4: got 'n.a.'
## Warning: Expecting numeric in D31474 / R31474C4: got 'n.a.'
## Warning: Expecting numeric in D31475 / R31475C4: got 'n.a.'
## Warning: Expecting numeric in D31476 / R31476C4: got 'n.a.'
## Warning: Expecting numeric in D31477 / R31477C4: got 'n.a.'
## Warning: Expecting numeric in D31478 / R31478C4: got 'n.a.'
## Warning: Expecting numeric in D31479 / R31479C4: got 'n.a.'
## Warning: Expecting numeric in D31480 / R31480C4: got 'n.a.'
## Warning: Expecting numeric in D31481 / R31481C4: got 'n.a.'
## Warning: Expecting numeric in D31482 / R31482C4: got 'n.a.'
## Warning: Expecting numeric in D31483 / R31483C4: got 'n.a.'
## Warning: Expecting numeric in D31484 / R31484C4: got 'n.a.'
## Warning: Expecting numeric in D31485 / R31485C4: got 'n.a.'
## Warning: Expecting numeric in D31486 / R31486C4: got 'n.a.'
## Warning: Expecting numeric in D31487 / R31487C4: got 'n.a.'
## Warning: Expecting numeric in D31488 / R31488C4: got 'n.a.'
## Warning: Expecting numeric in D31489 / R31489C4: got 'n.a.'
## Warning: Expecting numeric in D31490 / R31490C4: got 'n.a.'
## Warning: Expecting numeric in D31491 / R31491C4: got 'n.a.'
## Warning: Expecting numeric in D31492 / R31492C4: got 'n.a.'
## Warning: Expecting numeric in D31493 / R31493C4: got 'n.a.'
## Warning: Expecting numeric in D31494 / R31494C4: got 'n.a.'
## Warning: Expecting numeric in D31495 / R31495C4: got 'n.a.'
## Warning: Expecting numeric in D31496 / R31496C4: got 'n.a.'
## Warning: Expecting numeric in D31497 / R31497C4: got 'n.a.'
## Warning: Expecting numeric in D31498 / R31498C4: got 'n.a.'
## Warning: Expecting numeric in D31499 / R31499C4: got 'n.a.'
## Warning: Expecting numeric in D31500 / R31500C4: got 'n.a.'
## Warning: Expecting numeric in D31501 / R31501C4: got 'n.a.'
## Warning: Expecting numeric in D31502 / R31502C4: got 'n.a.'
## Warning: Expecting numeric in D31503 / R31503C4: got 'n.a.'
## Warning: Expecting numeric in D31504 / R31504C4: got 'n.a.'
## Warning: Expecting numeric in D31505 / R31505C4: got 'n.a.'
## Warning: Expecting numeric in D31506 / R31506C4: got 'n.a.'
## Warning: Expecting numeric in D31507 / R31507C4: got 'n.a.'
## Warning: Expecting numeric in D31508 / R31508C4: got 'n.a.'
## Warning: Expecting numeric in D31509 / R31509C4: got 'n.a.'
## Warning: Expecting numeric in D31510 / R31510C4: got 'n.a.'
## Warning: Expecting numeric in D31511 / R31511C4: got 'n.a.'
## Warning: Expecting numeric in D31512 / R31512C4: got 'n.a.'
## Warning: Expecting numeric in D31513 / R31513C4: got 'n.a.'
## Warning: Expecting numeric in D31514 / R31514C4: got 'n.a.'
## Warning: Expecting numeric in D31515 / R31515C4: got 'n.a.'
## Warning: Expecting numeric in D31516 / R31516C4: got 'n.a.'
## Warning: Expecting numeric in D31517 / R31517C4: got 'n.a.'
## Warning: Expecting numeric in D31518 / R31518C4: got 'n.a.'
## Warning: Expecting numeric in D31519 / R31519C4: got 'n.a.'
## Warning: Expecting numeric in D31520 / R31520C4: got 'n.a.'
## Warning: Expecting numeric in D31521 / R31521C4: got 'n.a.'
## Warning: Expecting numeric in D31522 / R31522C4: got 'n.a.'
## Warning: Expecting numeric in D31523 / R31523C4: got 'n.a.'
## Warning: Expecting numeric in D31524 / R31524C4: got 'n.a.'
## Warning: Expecting numeric in D31525 / R31525C4: got 'n.a.'
## Warning: Expecting numeric in D31526 / R31526C4: got 'n.a.'
## Warning: Expecting numeric in D31527 / R31527C4: got 'n.a.'
## Warning: Expecting numeric in D31528 / R31528C4: got 'n.a.'
## Warning: Expecting numeric in D31529 / R31529C4: got 'n.a.'
## Warning: Expecting numeric in D31530 / R31530C4: got 'n.a.'
## Warning: Expecting numeric in D31531 / R31531C4: got 'n.a.'
## Warning: Expecting numeric in D31532 / R31532C4: got 'n.a.'
## Warning: Expecting numeric in D31533 / R31533C4: got 'n.a.'
## Warning: Expecting numeric in D31534 / R31534C4: got 'n.a.'
## Warning: Expecting numeric in D31535 / R31535C4: got 'n.a.'
## Warning: Expecting numeric in D31536 / R31536C4: got 'n.a.'
## Warning: Expecting numeric in D31537 / R31537C4: got 'n.a.'
## Warning: Expecting numeric in D31538 / R31538C4: got 'n.a.'
## Warning: Expecting numeric in D31539 / R31539C4: got 'n.a.'
## Warning: Expecting numeric in D31540 / R31540C4: got 'n.a.'
## Warning: Expecting numeric in D31541 / R31541C4: got 'n.a.'
## Warning: Expecting numeric in D31542 / R31542C4: got 'n.a.'
## Warning: Expecting numeric in D31543 / R31543C4: got 'n.a.'
## Warning: Expecting numeric in D31544 / R31544C4: got 'n.a.'
## Warning: Expecting numeric in D31545 / R31545C4: got 'n.a.'
## Warning: Expecting numeric in D31546 / R31546C4: got 'n.a.'
## Warning: Expecting numeric in D31547 / R31547C4: got 'n.a.'
## Warning: Expecting numeric in D31548 / R31548C4: got 'n.a.'
## Warning: Expecting numeric in D31549 / R31549C4: got 'n.a.'
## Warning: Expecting numeric in D31550 / R31550C4: got 'n.a.'
## Warning: Expecting numeric in D31551 / R31551C4: got 'n.a.'
## Warning: Expecting numeric in D31552 / R31552C4: got 'n.a.'
## Warning: Expecting numeric in D31553 / R31553C4: got 'n.a.'
## Warning: Expecting numeric in D31554 / R31554C4: got 'n.a.'
## Warning: Expecting numeric in D31555 / R31555C4: got 'n.a.'
## Warning: Expecting numeric in D31556 / R31556C4: got 'n.a.'
## Warning: Expecting numeric in D31557 / R31557C4: got 'n.a.'
## Warning: Expecting numeric in D31558 / R31558C4: got 'n.a.'
## Warning: Expecting numeric in D31559 / R31559C4: got 'n.a.'
## Warning: Expecting numeric in D31560 / R31560C4: got 'n.a.'
## Warning: Expecting numeric in D31561 / R31561C4: got 'n.a.'
## Warning: Expecting numeric in D31562 / R31562C4: got 'n.a.'
## Warning: Expecting numeric in D31563 / R31563C4: got 'n.a.'
## Warning: Expecting numeric in D31564 / R31564C4: got 'n.a.'
## Warning: Expecting numeric in D31565 / R31565C4: got 'n.a.'
## Warning: Expecting numeric in D31566 / R31566C4: got 'n.a.'
## Warning: Expecting numeric in D31567 / R31567C4: got 'n.a.'
## Warning: Expecting numeric in D31568 / R31568C4: got 'n.a.'
## Warning: Expecting numeric in D31569 / R31569C4: got 'n.a.'
## Warning: Expecting numeric in D31570 / R31570C4: got 'n.a.'
## Warning: Expecting numeric in D31571 / R31571C4: got 'n.a.'
## Warning: Expecting numeric in D31572 / R31572C4: got 'n.a.'
## Warning: Expecting numeric in D31573 / R31573C4: got 'n.a.'
## Warning: Expecting numeric in D31574 / R31574C4: got 'n.a.'
## Warning: Expecting numeric in D31575 / R31575C4: got 'n.a.'
## Warning: Expecting numeric in D31576 / R31576C4: got 'n.a.'
## Warning: Expecting numeric in D31577 / R31577C4: got 'n.a.'
## Warning: Expecting numeric in D31578 / R31578C4: got 'n.a.'
## Warning: Expecting numeric in D31579 / R31579C4: got 'n.a.'
## Warning: Expecting numeric in D31580 / R31580C4: got 'n.a.'
## Warning: Expecting numeric in D31581 / R31581C4: got 'n.a.'
## Warning: Expecting numeric in D31582 / R31582C4: got 'n.a.'
## Warning: Expecting numeric in D31583 / R31583C4: got 'n.a.'
## Warning: Expecting numeric in D31584 / R31584C4: got 'n.a.'
## Warning: Expecting numeric in D31585 / R31585C4: got 'n.a.'
## Warning: Expecting numeric in D31586 / R31586C4: got 'n.a.'
## Warning: Expecting numeric in D31587 / R31587C4: got 'n.a.'
## Warning: Expecting numeric in D31588 / R31588C4: got 'n.a.'
## Warning: Expecting numeric in D31589 / R31589C4: got 'n.a.'
## Warning: Expecting numeric in D31590 / R31590C4: got 'n.a.'
## Warning: Expecting numeric in D31591 / R31591C4: got 'n.a.'
## Warning: Expecting numeric in D31592 / R31592C4: got 'n.a.'
## Warning: Expecting numeric in D31593 / R31593C4: got 'n.a.'
## Warning: Expecting numeric in D31594 / R31594C4: got 'n.a.'
## Warning: Expecting numeric in D31595 / R31595C4: got 'n.a.'
## Warning: Expecting numeric in D31596 / R31596C4: got 'n.a.'
## Warning: Expecting numeric in D31597 / R31597C4: got 'n.a.'
## Warning: Expecting numeric in D31598 / R31598C4: got 'n.a.'
## Warning: Expecting numeric in D31599 / R31599C4: got 'n.a.'
## Warning: Expecting numeric in D31600 / R31600C4: got 'n.a.'
## Warning: Expecting numeric in D31601 / R31601C4: got 'n.a.'
## Warning: Expecting numeric in D31602 / R31602C4: got 'n.a.'
## Warning: Expecting numeric in D31603 / R31603C4: got 'n.a.'
## Warning: Expecting numeric in D31604 / R31604C4: got 'n.a.'
## Warning: Expecting numeric in D31605 / R31605C4: got 'n.a.'
## Warning: Expecting numeric in D31606 / R31606C4: got 'n.a.'
## Warning: Expecting numeric in D31607 / R31607C4: got 'n.a.'
## Warning: Expecting numeric in D31608 / R31608C4: got 'n.a.'
## Warning: Expecting numeric in D31609 / R31609C4: got 'n.a.'
## Warning: Expecting numeric in D31610 / R31610C4: got 'n.a.'
## Warning: Expecting numeric in D31611 / R31611C4: got 'n.a.'
## Warning: Expecting numeric in D31612 / R31612C4: got 'n.a.'
## Warning: Expecting numeric in D31613 / R31613C4: got 'n.a.'
## Warning: Expecting numeric in D31614 / R31614C4: got 'n.a.'
## Warning: Expecting numeric in D31615 / R31615C4: got 'n.a.'
## Warning: Expecting numeric in D31616 / R31616C4: got 'n.a.'
## Warning: Expecting numeric in D31617 / R31617C4: got 'n.a.'
## Warning: Expecting numeric in D31618 / R31618C4: got 'n.a.'
## Warning: Expecting numeric in D31619 / R31619C4: got 'n.a.'
## Warning: Expecting numeric in D31620 / R31620C4: got 'n.a.'
## Warning: Expecting numeric in D31621 / R31621C4: got 'n.a.'
## Warning: Expecting numeric in D31622 / R31622C4: got 'n.a.'
## Warning: Expecting numeric in D31623 / R31623C4: got 'n.a.'
## Warning: Expecting numeric in D31624 / R31624C4: got 'n.a.'
## Warning: Expecting numeric in D31625 / R31625C4: got 'n.a.'
## Warning: Expecting numeric in D31626 / R31626C4: got 'n.a.'
## Warning: Expecting numeric in D31627 / R31627C4: got 'n.a.'
## Warning: Expecting numeric in D31628 / R31628C4: got 'n.a.'
## Warning: Expecting numeric in D31629 / R31629C4: got 'n.a.'
## Warning: Expecting numeric in D31630 / R31630C4: got 'n.a.'
## Warning: Expecting numeric in D31631 / R31631C4: got 'n.a.'
## Warning: Expecting numeric in D31632 / R31632C4: got 'n.a.'
## Warning: Expecting numeric in D31633 / R31633C4: got 'n.a.'
## Warning: Expecting numeric in D31634 / R31634C4: got 'n.a.'
## Warning: Expecting numeric in D31635 / R31635C4: got 'n.a.'
## Warning: Expecting numeric in D31636 / R31636C4: got 'n.a.'
## Warning: Expecting numeric in D31637 / R31637C4: got 'n.a.'
## Warning: Expecting numeric in D31638 / R31638C4: got 'n.a.'
## Warning: Expecting numeric in D31639 / R31639C4: got 'n.a.'
## Warning: Expecting numeric in D31640 / R31640C4: got 'n.a.'
## Warning: Expecting numeric in D31641 / R31641C4: got 'n.a.'
## Warning: Expecting numeric in D31642 / R31642C4: got 'n.a.'
## Warning: Expecting numeric in D31643 / R31643C4: got 'n.a.'
## Warning: Expecting numeric in D31644 / R31644C4: got 'n.a.'
## Warning: Expecting numeric in D31645 / R31645C4: got 'n.a.'
## Warning: Expecting numeric in D31646 / R31646C4: got 'n.a.'
## Warning: Expecting numeric in D31647 / R31647C4: got 'n.a.'
## Warning: Expecting numeric in D31648 / R31648C4: got 'n.a.'
## Warning: Expecting numeric in D31649 / R31649C4: got 'n.a.'
## Warning: Expecting numeric in D31650 / R31650C4: got 'n.a.'
## Warning: Expecting numeric in D31651 / R31651C4: got 'n.a.'
## Warning: Expecting numeric in D31652 / R31652C4: got 'n.a.'
## Warning: Expecting numeric in D31653 / R31653C4: got 'n.a.'
## Warning: Expecting numeric in D31654 / R31654C4: got 'n.a.'
## Warning: Expecting numeric in D31655 / R31655C4: got 'n.a.'
## Warning: Expecting numeric in D31656 / R31656C4: got 'n.a.'
## Warning: Expecting numeric in D31657 / R31657C4: got 'n.a.'
## Warning: Expecting numeric in D31658 / R31658C4: got 'n.a.'
## Warning: Expecting numeric in D31659 / R31659C4: got 'n.a.'
## Warning: Expecting numeric in D31660 / R31660C4: got 'n.a.'
## Warning: Expecting numeric in D31661 / R31661C4: got 'n.a.'
## Warning: Expecting numeric in D31662 / R31662C4: got 'n.a.'
## Warning: Expecting numeric in D31663 / R31663C4: got 'n.a.'
## Warning: Expecting numeric in D31664 / R31664C4: got 'n.a.'
## Warning: Expecting numeric in D31665 / R31665C4: got 'n.a.'
## Warning: Expecting numeric in D31666 / R31666C4: got 'n.a.'
## Warning: Expecting numeric in D31667 / R31667C4: got 'n.a.'
## Warning: Expecting numeric in D31668 / R31668C4: got 'n.a.'
## Warning: Expecting numeric in D31669 / R31669C4: got 'n.a.'
## Warning: Expecting numeric in D31670 / R31670C4: got 'n.a.'
## Warning: Expecting numeric in D31671 / R31671C4: got 'n.a.'
## Warning: Expecting numeric in D31672 / R31672C4: got 'n.a.'
## Warning: Expecting numeric in D31673 / R31673C4: got 'n.a.'
## Warning: Expecting numeric in D31674 / R31674C4: got 'n.a.'
## Warning: Expecting numeric in D31675 / R31675C4: got 'n.a.'
## Warning: Expecting numeric in D31676 / R31676C4: got 'n.a.'
## Warning: Expecting numeric in D31677 / R31677C4: got 'n.a.'
## Warning: Expecting numeric in D31678 / R31678C4: got 'n.a.'
## Warning: Expecting numeric in D31679 / R31679C4: got 'n.a.'
## Warning: Expecting numeric in D31680 / R31680C4: got 'n.a.'
## Warning: Expecting numeric in D31681 / R31681C4: got 'n.a.'
## Warning: Expecting numeric in D31682 / R31682C4: got 'n.a.'
## Warning: Expecting numeric in D31683 / R31683C4: got 'n.a.'
## Warning: Expecting numeric in D31684 / R31684C4: got 'n.a.'
## Warning: Expecting numeric in D31685 / R31685C4: got 'n.a.'
## Warning: Expecting numeric in D31686 / R31686C4: got 'n.a.'
## Warning: Expecting numeric in D31687 / R31687C4: got 'n.a.'
## Warning: Expecting numeric in D31688 / R31688C4: got 'n.a.'
## Warning: Expecting numeric in D31689 / R31689C4: got 'n.a.'
## Warning: Expecting numeric in D31690 / R31690C4: got 'n.a.'
## Warning: Expecting numeric in D31691 / R31691C4: got 'n.a.'
## Warning: Expecting numeric in D31692 / R31692C4: got 'n.a.'
## Warning: Expecting numeric in D31693 / R31693C4: got 'n.a.'
## Warning: Expecting numeric in D31694 / R31694C4: got 'n.a.'
## Warning: Expecting numeric in D31695 / R31695C4: got 'n.a.'
## Warning: Expecting numeric in D31696 / R31696C4: got 'n.a.'
## Warning: Expecting numeric in D31697 / R31697C4: got 'n.a.'
## Warning: Expecting numeric in D31698 / R31698C4: got 'n.a.'
## Warning: Expecting numeric in D31699 / R31699C4: got 'n.a.'
## Warning: Expecting numeric in D31700 / R31700C4: got 'n.a.'
## Warning: Expecting numeric in D31701 / R31701C4: got 'n.a.'
## Warning: Expecting numeric in D31702 / R31702C4: got 'n.a.'
## Warning: Expecting numeric in D31703 / R31703C4: got 'n.a.'
## Warning: Expecting numeric in D31704 / R31704C4: got 'n.a.'
## Warning: Expecting numeric in D31705 / R31705C4: got 'n.a.'
## Warning: Expecting numeric in D31706 / R31706C4: got 'n.a.'
## Warning: Expecting numeric in D31707 / R31707C4: got 'n.a.'
## Warning: Expecting numeric in D31708 / R31708C4: got 'n.a.'
## Warning: Expecting numeric in D31709 / R31709C4: got 'n.a.'
## Warning: Expecting numeric in D31710 / R31710C4: got 'n.a.'
## Warning: Expecting numeric in D31711 / R31711C4: got 'n.a.'
## Warning: Expecting numeric in D31712 / R31712C4: got 'n.a.'
## Warning: Expecting numeric in D31713 / R31713C4: got 'n.a.'
## Warning: Expecting numeric in D31714 / R31714C4: got 'n.a.'
## Warning: Expecting numeric in D31715 / R31715C4: got 'n.a.'
## Warning: Expecting numeric in D31716 / R31716C4: got 'n.a.'
## Warning: Expecting numeric in D31717 / R31717C4: got 'n.a.'
## Warning: Expecting numeric in D31718 / R31718C4: got 'n.a.'
## Warning: Expecting numeric in D31719 / R31719C4: got 'n.a.'
## Warning: Expecting numeric in D31720 / R31720C4: got 'n.a.'
## Warning: Expecting numeric in D31721 / R31721C4: got 'n.a.'
## Warning: Expecting numeric in D31722 / R31722C4: got 'n.a.'
## Warning: Expecting numeric in D31723 / R31723C4: got 'n.a.'
## Warning: Expecting numeric in D31724 / R31724C4: got 'n.a.'
## Warning: Expecting numeric in D31725 / R31725C4: got 'n.a.'
## Warning: Expecting numeric in D31726 / R31726C4: got 'n.a.'
## Warning: Expecting numeric in D31727 / R31727C4: got 'n.a.'
## Warning: Expecting numeric in D31728 / R31728C4: got 'n.a.'
## Warning: Expecting numeric in D31729 / R31729C4: got 'n.a.'
## Warning: Expecting numeric in D31730 / R31730C4: got 'n.a.'
## Warning: Expecting numeric in D31731 / R31731C4: got 'n.a.'
## Warning: Expecting numeric in D31732 / R31732C4: got 'n.a.'
## Warning: Expecting numeric in D31733 / R31733C4: got 'n.a.'
## Warning: Expecting numeric in D31734 / R31734C4: got 'n.a.'
## Warning: Expecting numeric in D31735 / R31735C4: got 'n.a.'
## Warning: Expecting numeric in D31736 / R31736C4: got 'n.a.'
## Warning: Expecting numeric in D31737 / R31737C4: got 'n.a.'
## Warning: Expecting numeric in D31738 / R31738C4: got 'n.a.'
## Warning: Expecting numeric in D31739 / R31739C4: got 'n.a.'
## Warning: Expecting numeric in D31740 / R31740C4: got 'n.a.'
## Warning: Expecting numeric in D31741 / R31741C4: got 'n.a.'
## Warning: Expecting numeric in D31742 / R31742C4: got 'n.a.'
## Warning: Expecting numeric in D31743 / R31743C4: got 'n.a.'
## Warning: Expecting numeric in D31744 / R31744C4: got 'n.a.'
## Warning: Expecting numeric in D31745 / R31745C4: got 'n.a.'
## Warning: Expecting numeric in D31746 / R31746C4: got 'n.a.'
## Warning: Expecting numeric in D31747 / R31747C4: got 'n.a.'
## Warning: Expecting numeric in D31748 / R31748C4: got 'n.a.'
## Warning: Expecting numeric in D31749 / R31749C4: got 'n.a.'
## Warning: Expecting numeric in D31750 / R31750C4: got 'n.a.'
## Warning: Expecting numeric in D31751 / R31751C4: got 'n.a.'
## Warning: Expecting numeric in D31752 / R31752C4: got 'n.a.'
## Warning: Expecting numeric in D31753 / R31753C4: got 'n.a.'
## Warning: Expecting numeric in D31754 / R31754C4: got 'n.a.'
## Warning: Expecting numeric in D31755 / R31755C4: got 'n.a.'
## Warning: Expecting numeric in D31756 / R31756C4: got 'n.a.'
## Warning: Expecting numeric in D31757 / R31757C4: got 'n.a.'
## Warning: Expecting numeric in D31758 / R31758C4: got 'n.a.'
## Warning: Expecting numeric in D31759 / R31759C4: got 'n.a.'
## Warning: Expecting numeric in D31760 / R31760C4: got 'n.a.'
## Warning: Expecting numeric in D31761 / R31761C4: got 'n.a.'
## Warning: Expecting numeric in D31762 / R31762C4: got 'n.a.'
## Warning: Expecting numeric in D31763 / R31763C4: got 'n.a.'
## Warning: Expecting numeric in D31764 / R31764C4: got 'n.a.'
## Warning: Expecting numeric in D31765 / R31765C4: got 'n.a.'
## Warning: Expecting numeric in D31766 / R31766C4: got 'n.a.'
## Warning: Expecting numeric in D31767 / R31767C4: got 'n.a.'
## Warning: Expecting numeric in D31768 / R31768C4: got 'n.a.'
## Warning: Expecting numeric in D31769 / R31769C4: got 'n.a.'
## Warning: Expecting numeric in D31770 / R31770C4: got 'n.a.'
## Warning: Expecting numeric in D31771 / R31771C4: got 'n.a.'
## Warning: Expecting numeric in D31772 / R31772C4: got 'n.a.'
## Warning: Expecting numeric in D31773 / R31773C4: got 'n.a.'
## Warning: Expecting numeric in D31774 / R31774C4: got 'n.a.'
## Warning: Expecting numeric in D31775 / R31775C4: got 'n.a.'
## Warning: Expecting numeric in D31776 / R31776C4: got 'n.a.'
## Warning: Expecting numeric in D31777 / R31777C4: got 'n.a.'
## Warning: Expecting numeric in D31778 / R31778C4: got 'n.a.'
## Warning: Expecting numeric in D31779 / R31779C4: got 'n.a.'
## Warning: Expecting numeric in D31780 / R31780C4: got 'n.a.'
## Warning: Expecting numeric in D31781 / R31781C4: got 'n.a.'
## Warning: Expecting numeric in D31782 / R31782C4: got 'n.a.'
## Warning: Expecting numeric in D31783 / R31783C4: got 'n.a.'
## Warning: Expecting numeric in D31784 / R31784C4: got 'n.a.'
## Warning: Expecting numeric in D31785 / R31785C4: got 'n.a.'
## Warning: Expecting numeric in D31786 / R31786C4: got 'n.a.'
## Warning: Expecting numeric in D31787 / R31787C4: got 'n.a.'
## Warning: Expecting numeric in D31788 / R31788C4: got 'n.a.'
## Warning: Expecting numeric in D31789 / R31789C4: got 'n.a.'
## Warning: Expecting numeric in D31790 / R31790C4: got 'n.a.'
## Warning: Expecting numeric in D31791 / R31791C4: got 'n.a.'
## Warning: Expecting numeric in D31792 / R31792C4: got 'n.a.'
## Warning: Expecting numeric in D31793 / R31793C4: got 'n.a.'
## Warning: Expecting numeric in D31794 / R31794C4: got 'n.a.'
## Warning: Expecting numeric in D31795 / R31795C4: got 'n.a.'
## Warning: Expecting numeric in D31796 / R31796C4: got 'n.a.'
## Warning: Expecting numeric in D31797 / R31797C4: got 'n.a.'
## Warning: Expecting numeric in D31798 / R31798C4: got 'n.a.'
## Warning: Expecting numeric in D31799 / R31799C4: got 'n.a.'
## Warning: Expecting numeric in D31800 / R31800C4: got 'n.a.'
## Warning: Expecting numeric in D31801 / R31801C4: got 'n.a.'
## Warning: Expecting numeric in D31802 / R31802C4: got 'n.a.'
## Warning: Expecting numeric in D31803 / R31803C4: got 'n.a.'
## Warning: Expecting numeric in D31804 / R31804C4: got 'n.a.'
## Warning: Expecting numeric in D31805 / R31805C4: got 'n.a.'
## Warning: Expecting numeric in D31806 / R31806C4: got 'n.a.'
## Warning: Expecting numeric in D31807 / R31807C4: got 'n.a.'
## Warning: Expecting numeric in D31808 / R31808C4: got 'n.a.'
## Warning: Expecting numeric in D31809 / R31809C4: got 'n.a.'
## Warning: Expecting numeric in D31810 / R31810C4: got 'n.a.'
## Warning: Expecting numeric in D31811 / R31811C4: got 'n.a.'
## Warning: Expecting numeric in D31812 / R31812C4: got 'n.a.'
## Warning: Expecting numeric in D31813 / R31813C4: got 'n.a.'
## Warning: Expecting numeric in D31814 / R31814C4: got 'n.a.'
## Warning: Expecting numeric in D31815 / R31815C4: got 'n.a.'
## Warning: Expecting numeric in D31816 / R31816C4: got 'n.a.'
## Warning: Expecting numeric in D31817 / R31817C4: got 'n.a.'
## Warning: Expecting numeric in D31818 / R31818C4: got 'n.a.'
## Warning: Expecting numeric in D31819 / R31819C4: got 'n.a.'
## Warning: Expecting numeric in D31820 / R31820C4: got 'n.a.'
## Warning: Expecting numeric in D31821 / R31821C4: got 'n.a.'
## Warning: Expecting numeric in D31822 / R31822C4: got 'n.a.'
## Warning: Expecting numeric in D31823 / R31823C4: got 'n.a.'
## Warning: Expecting numeric in D31824 / R31824C4: got 'n.a.'
## Warning: Expecting numeric in D31825 / R31825C4: got 'n.a.'
## Warning: Expecting numeric in D31826 / R31826C4: got 'n.a.'
## Warning: Expecting numeric in D31827 / R31827C4: got 'n.a.'
## Warning: Expecting numeric in D31828 / R31828C4: got 'n.a.'
## Warning: Expecting numeric in D31829 / R31829C4: got 'n.a.'
## Warning: Expecting numeric in D31830 / R31830C4: got 'n.a.'
## Warning: Expecting numeric in D31831 / R31831C4: got 'n.a.'
## Warning: Expecting numeric in D31832 / R31832C4: got 'n.a.'
## Warning: Expecting numeric in D31833 / R31833C4: got 'n.a.'
## Warning: Expecting numeric in D31834 / R31834C4: got 'n.a.'
## Warning: Expecting numeric in D31835 / R31835C4: got 'n.a.'
## Warning: Expecting numeric in D31836 / R31836C4: got 'n.a.'
## Warning: Expecting numeric in D31837 / R31837C4: got 'n.a.'
## Warning: Expecting numeric in D31838 / R31838C4: got 'n.a.'
## Warning: Expecting numeric in D31839 / R31839C4: got 'n.a.'
## Warning: Expecting numeric in D31840 / R31840C4: got 'n.a.'
## Warning: Expecting numeric in D31841 / R31841C4: got 'n.a.'
## Warning: Expecting numeric in D31842 / R31842C4: got 'n.a.'
## Warning: Expecting numeric in D31843 / R31843C4: got 'n.a.'
## Warning: Expecting numeric in D31844 / R31844C4: got 'n.a.'
## Warning: Expecting numeric in D31845 / R31845C4: got 'n.a.'
## Warning: Expecting numeric in D31846 / R31846C4: got 'n.a.'
## Warning: Expecting numeric in D31847 / R31847C4: got 'n.a.'
## Warning: Expecting numeric in D31848 / R31848C4: got 'n.a.'
## Warning: Expecting numeric in D31849 / R31849C4: got 'n.a.'
## Warning: Expecting numeric in D31850 / R31850C4: got 'n.a.'
## Warning: Expecting numeric in D31851 / R31851C4: got 'n.a.'
## Warning: Expecting numeric in D31852 / R31852C4: got 'n.a.'
## Warning: Expecting numeric in D31853 / R31853C4: got 'n.a.'
## Warning: Expecting numeric in D31854 / R31854C4: got 'n.a.'
## Warning: Expecting numeric in D31855 / R31855C4: got 'n.a.'
## Warning: Expecting numeric in D31856 / R31856C4: got 'n.a.'
## Warning: Expecting numeric in D31857 / R31857C4: got 'n.a.'
## Warning: Expecting numeric in D31858 / R31858C4: got 'n.a.'
## Warning: Expecting numeric in D31859 / R31859C4: got 'n.a.'
## Warning: Expecting numeric in D31860 / R31860C4: got 'n.a.'
## Warning: Expecting numeric in D31861 / R31861C4: got 'n.a.'
## Warning: Expecting numeric in D31862 / R31862C4: got 'n.a.'
## Warning: Expecting numeric in D31863 / R31863C4: got 'n.a.'
## Warning: Expecting numeric in D31864 / R31864C4: got 'n.a.'
## Warning: Expecting numeric in D31865 / R31865C4: got 'n.a.'
## Warning: Expecting numeric in D31866 / R31866C4: got 'n.a.'
## Warning: Expecting numeric in D31867 / R31867C4: got 'n.a.'
## Warning: Expecting numeric in D31868 / R31868C4: got 'n.a.'
## Warning: Expecting numeric in D31869 / R31869C4: got 'n.a.'
## Warning: Expecting numeric in D31870 / R31870C4: got 'n.a.'
## Warning: Expecting numeric in D31871 / R31871C4: got 'n.a.'
## Warning: Expecting numeric in D31872 / R31872C4: got 'n.a.'
## Warning: Expecting numeric in D31873 / R31873C4: got 'n.a.'
## Warning: Expecting numeric in D31874 / R31874C4: got 'n.a.'
## Warning: Expecting numeric in D31875 / R31875C4: got 'n.a.'
## Warning: Expecting numeric in D31876 / R31876C4: got 'n.a.'
## Warning: Expecting numeric in D31877 / R31877C4: got 'n.a.'
## Warning: Expecting numeric in D31878 / R31878C4: got 'n.a.'
## Warning: Expecting numeric in D31879 / R31879C4: got 'n.a.'
## Warning: Expecting numeric in D31880 / R31880C4: got 'n.a.'
## Warning: Expecting numeric in D31881 / R31881C4: got 'n.a.'
## Warning: Expecting numeric in D31882 / R31882C4: got 'n.a.'
## Warning: Expecting numeric in D31883 / R31883C4: got 'n.a.'
## Warning: Expecting numeric in D31884 / R31884C4: got 'n.a.'
## Warning: Expecting numeric in D31885 / R31885C4: got 'n.a.'
## Warning: Expecting numeric in D31886 / R31886C4: got 'n.a.'
## Warning: Expecting numeric in D31887 / R31887C4: got 'n.a.'
## Warning: Expecting numeric in D31888 / R31888C4: got 'n.a.'
## Warning: Expecting numeric in D31889 / R31889C4: got 'n.a.'
## Warning: Expecting numeric in D31890 / R31890C4: got 'n.a.'
## Warning: Expecting numeric in D31891 / R31891C4: got 'n.a.'
## Warning: Expecting numeric in D31892 / R31892C4: got 'n.a.'
## Warning: Expecting numeric in D31893 / R31893C4: got 'n.a.'
## Warning: Expecting numeric in D31894 / R31894C4: got 'n.a.'
## Warning: Expecting numeric in D31895 / R31895C4: got 'n.a.'
## Warning: Expecting numeric in D31896 / R31896C4: got 'n.a.'
## Warning: Expecting numeric in D31897 / R31897C4: got 'n.a.'
## Warning: Expecting numeric in D31898 / R31898C4: got 'n.a.'
## Warning: Expecting numeric in D31899 / R31899C4: got 'n.a.'
## Warning: Expecting numeric in D31900 / R31900C4: got 'n.a.'
## Warning: Expecting numeric in D31901 / R31901C4: got 'n.a.'
## Warning: Expecting numeric in D31902 / R31902C4: got 'n.a.'
## Warning: Expecting numeric in D31903 / R31903C4: got 'n.a.'
## Warning: Expecting numeric in D31904 / R31904C4: got 'n.a.'
## Warning: Expecting numeric in D31905 / R31905C4: got 'n.a.'
## Warning: Expecting numeric in D31906 / R31906C4: got 'n.a.'
## Warning: Expecting numeric in D31907 / R31907C4: got 'n.a.'
## Warning: Expecting numeric in D31908 / R31908C4: got 'n.a.'
## Warning: Expecting numeric in D31909 / R31909C4: got 'n.a.'
## Warning: Expecting numeric in D31910 / R31910C4: got 'n.a.'
## Warning: Expecting numeric in D31911 / R31911C4: got 'n.a.'
## Warning: Expecting numeric in D31912 / R31912C4: got 'n.a.'
## Warning: Expecting numeric in D31913 / R31913C4: got 'n.a.'
## Warning: Expecting numeric in D31914 / R31914C4: got 'n.a.'
## Warning: Expecting numeric in D31915 / R31915C4: got 'n.a.'
## Warning: Expecting numeric in D31916 / R31916C4: got 'n.a.'
## Warning: Expecting numeric in D31917 / R31917C4: got 'n.a.'
## Warning: Expecting numeric in D31918 / R31918C4: got 'n.a.'
## Warning: Expecting numeric in D31919 / R31919C4: got 'n.a.'
## Warning: Expecting numeric in D31920 / R31920C4: got 'n.a.'
## Warning: Expecting numeric in D31921 / R31921C4: got 'n.a.'
## Warning: Expecting numeric in D31922 / R31922C4: got 'n.a.'
## Warning: Expecting numeric in D31923 / R31923C4: got 'n.a.'
## Warning: Expecting numeric in D31924 / R31924C4: got 'n.a.'
## Warning: Expecting numeric in D31925 / R31925C4: got 'n.a.'
## Warning: Expecting numeric in D31926 / R31926C4: got 'n.a.'
## Warning: Expecting numeric in D31927 / R31927C4: got 'n.a.'
## Warning: Expecting numeric in D31928 / R31928C4: got 'n.a.'
## Warning: Expecting numeric in D31929 / R31929C4: got 'n.a.'
## Warning: Expecting numeric in D31930 / R31930C4: got 'n.a.'
## Warning: Expecting numeric in D31931 / R31931C4: got 'n.a.'
## Warning: Expecting numeric in D31932 / R31932C4: got 'n.a.'
## Warning: Expecting numeric in D31933 / R31933C4: got 'n.a.'
## Warning: Expecting numeric in D31934 / R31934C4: got 'n.a.'
## Warning: Expecting numeric in D31935 / R31935C4: got 'n.a.'
## Warning: Expecting numeric in D31936 / R31936C4: got 'n.a.'
## Warning: Expecting numeric in D31937 / R31937C4: got 'n.a.'
## Warning: Expecting numeric in D31938 / R31938C4: got 'n.a.'
## Warning: Expecting numeric in D31939 / R31939C4: got 'n.a.'
## Warning: Expecting numeric in D31940 / R31940C4: got 'n.a.'
## Warning: Expecting numeric in D31941 / R31941C4: got 'n.a.'
## Warning: Expecting numeric in D31942 / R31942C4: got 'n.a.'
## Warning: Expecting numeric in D31943 / R31943C4: got 'n.a.'
## Warning: Expecting numeric in D31944 / R31944C4: got 'n.a.'
## Warning: Expecting numeric in D31945 / R31945C4: got 'n.a.'
## Warning: Expecting numeric in D31946 / R31946C4: got 'n.a.'
## Warning: Expecting numeric in D31947 / R31947C4: got 'n.a.'
## Warning: Expecting numeric in D31948 / R31948C4: got 'n.a.'
## Warning: Expecting numeric in D31949 / R31949C4: got 'n.a.'
## Warning: Expecting numeric in D31950 / R31950C4: got 'n.a.'
## Warning: Expecting numeric in D31951 / R31951C4: got 'n.a.'
## Warning: Expecting numeric in D31952 / R31952C4: got 'n.a.'
## Warning: Expecting numeric in D31953 / R31953C4: got 'n.a.'
## Warning: Expecting numeric in D31954 / R31954C4: got 'n.a.'
## Warning: Expecting numeric in D31955 / R31955C4: got 'n.a.'
## Warning: Expecting numeric in D31956 / R31956C4: got 'n.a.'
## Warning: Expecting numeric in D31957 / R31957C4: got 'n.a.'
## Warning: Expecting numeric in D31958 / R31958C4: got 'n.a.'
## Warning: Expecting numeric in D31959 / R31959C4: got 'n.a.'
## Warning: Expecting numeric in D31960 / R31960C4: got 'n.a.'
## Warning: Expecting numeric in D31961 / R31961C4: got 'n.a.'
## Warning: Expecting numeric in D31962 / R31962C4: got 'n.a.'
## Warning: Expecting numeric in D31963 / R31963C4: got 'n.a.'
## Warning: Expecting numeric in D31964 / R31964C4: got 'n.a.'
## Warning: Expecting numeric in D31965 / R31965C4: got 'n.a.'
## Warning: Expecting numeric in D31966 / R31966C4: got 'n.a.'
## Warning: Expecting numeric in D31967 / R31967C4: got 'n.a.'
## Warning: Expecting numeric in D31968 / R31968C4: got 'n.a.'
## Warning: Expecting numeric in D31969 / R31969C4: got 'n.a.'
## Warning: Expecting numeric in D31970 / R31970C4: got 'n.a.'
## Warning: Expecting numeric in D31971 / R31971C4: got 'n.a.'
## Warning: Expecting numeric in D31972 / R31972C4: got 'n.a.'
## Warning: Expecting numeric in D31973 / R31973C4: got 'n.a.'
## Warning: Expecting numeric in D31974 / R31974C4: got 'n.a.'
## Warning: Expecting numeric in D31975 / R31975C4: got 'n.a.'
## Warning: Expecting numeric in D31976 / R31976C4: got 'n.a.'
## Warning: Expecting numeric in D31977 / R31977C4: got 'n.a.'
## Warning: Expecting numeric in D31978 / R31978C4: got 'n.a.'
## Warning: Expecting numeric in D31979 / R31979C4: got 'n.a.'
## Warning: Expecting numeric in D31980 / R31980C4: got 'n.a.'
## Warning: Expecting numeric in D31981 / R31981C4: got 'n.a.'
## Warning: Expecting numeric in D31982 / R31982C4: got 'n.a.'
## Warning: Expecting numeric in D31983 / R31983C4: got 'n.a.'
## Warning: Expecting numeric in D31984 / R31984C4: got 'n.a.'
## Warning: Expecting numeric in D31985 / R31985C4: got 'n.a.'
## Warning: Expecting numeric in D31986 / R31986C4: got 'n.a.'
## Warning: Expecting numeric in D31987 / R31987C4: got 'n.a.'
## Warning: Expecting numeric in D31988 / R31988C4: got 'n.a.'
## Warning: Expecting numeric in D31989 / R31989C4: got 'n.a.'
## Warning: Expecting numeric in D31990 / R31990C4: got 'n.a.'
## Warning: Expecting numeric in D31991 / R31991C4: got 'n.a.'
## Warning: Expecting numeric in D31992 / R31992C4: got 'n.a.'
## Warning: Expecting numeric in D31993 / R31993C4: got 'n.a.'
## Warning: Expecting numeric in D31994 / R31994C4: got 'n.a.'
## Warning: Expecting numeric in D31995 / R31995C4: got 'n.a.'
## Warning: Expecting numeric in D31996 / R31996C4: got 'n.a.'
## Warning: Expecting numeric in D31997 / R31997C4: got 'n.a.'
## Warning: Expecting numeric in D31998 / R31998C4: got 'n.a.'
## Warning: Expecting numeric in D31999 / R31999C4: got 'n.a.'
## Warning: Expecting numeric in D32000 / R32000C4: got 'n.a.'
## Warning: Expecting numeric in D32001 / R32001C4: got 'n.a.'
## Warning: Expecting numeric in D32002 / R32002C4: got 'n.a.'
## Warning: Expecting numeric in D32003 / R32003C4: got 'n.a.'
## Warning: Expecting numeric in D32004 / R32004C4: got 'n.a.'
## Warning: Expecting numeric in D32005 / R32005C4: got 'n.a.'
## Warning: Expecting numeric in D32006 / R32006C4: got 'n.a.'
## Warning: Expecting numeric in D32007 / R32007C4: got 'n.a.'
## Warning: Expecting numeric in D32008 / R32008C4: got 'n.a.'
## Warning: Expecting numeric in D32009 / R32009C4: got 'n.a.'
## Warning: Expecting numeric in D32010 / R32010C4: got 'n.a.'
## Warning: Expecting numeric in D32011 / R32011C4: got 'n.a.'
## Warning: Expecting numeric in D32012 / R32012C4: got 'n.a.'
## Warning: Expecting numeric in D32013 / R32013C4: got 'n.a.'
## Warning: Expecting numeric in D32014 / R32014C4: got 'n.a.'
## Warning: Expecting numeric in D32015 / R32015C4: got 'n.a.'
## Warning: Expecting numeric in D32016 / R32016C4: got 'n.a.'
## Warning: Expecting numeric in D32017 / R32017C4: got 'n.a.'
## Warning: Expecting numeric in D32018 / R32018C4: got 'n.a.'
## Warning: Expecting numeric in D32019 / R32019C4: got 'n.a.'
## Warning: Expecting numeric in D32020 / R32020C4: got 'n.a.'
## Warning: Expecting numeric in D32021 / R32021C4: got 'n.a.'
## Warning: Expecting numeric in D32022 / R32022C4: got 'n.a.'
## Warning: Expecting numeric in D32023 / R32023C4: got 'n.a.'
## Warning: Expecting numeric in D32024 / R32024C4: got 'n.a.'
## Warning: Expecting numeric in D32025 / R32025C4: got 'n.a.'
## Warning: Expecting numeric in D32026 / R32026C4: got 'n.a.'
## Warning: Expecting numeric in D32027 / R32027C4: got 'n.a.'
## Warning: Expecting numeric in D32028 / R32028C4: got 'n.a.'
## Warning: Expecting numeric in D32029 / R32029C4: got 'n.a.'
## Warning: Expecting numeric in D32030 / R32030C4: got 'n.a.'
## Warning: Expecting numeric in D32031 / R32031C4: got 'n.a.'
## Warning: Expecting numeric in D32032 / R32032C4: got 'n.a.'
## Warning: Expecting numeric in D32033 / R32033C4: got 'n.a.'
## Warning: Expecting numeric in D32034 / R32034C4: got 'n.a.'
## Warning: Expecting numeric in D32035 / R32035C4: got 'n.a.'
## Warning: Expecting numeric in D32036 / R32036C4: got 'n.a.'
## Warning: Expecting numeric in D32037 / R32037C4: got 'n.a.'
## Warning: Expecting numeric in D32038 / R32038C4: got 'n.a.'
## Warning: Expecting numeric in D32039 / R32039C4: got 'n.a.'
## Warning: Expecting numeric in D32040 / R32040C4: got 'n.a.'
## Warning: Expecting numeric in D32041 / R32041C4: got 'n.a.'
## Warning: Expecting numeric in D32042 / R32042C4: got 'n.a.'
## Warning: Expecting numeric in D32043 / R32043C4: got 'n.a.'
## Warning: Expecting numeric in D32044 / R32044C4: got 'n.a.'
## Warning: Expecting numeric in D32045 / R32045C4: got 'n.a.'
## Warning: Expecting numeric in D32046 / R32046C4: got 'n.a.'
## Warning: Expecting numeric in D32047 / R32047C4: got 'n.a.'
## Warning: Expecting numeric in D32048 / R32048C4: got 'n.a.'
## Warning: Expecting numeric in D32049 / R32049C4: got 'n.a.'
## Warning: Expecting numeric in D32050 / R32050C4: got 'n.a.'
## Warning: Expecting numeric in D32051 / R32051C4: got 'n.a.'
## Warning: Expecting numeric in D32052 / R32052C4: got 'n.a.'
## Warning: Expecting numeric in D32053 / R32053C4: got 'n.a.'
## Warning: Expecting numeric in D32054 / R32054C4: got 'n.a.'
## Warning: Expecting numeric in D32055 / R32055C4: got 'n.a.'
## Warning: Expecting numeric in D32056 / R32056C4: got 'n.a.'
## Warning: Expecting numeric in D32057 / R32057C4: got 'n.a.'
## Warning: Expecting numeric in D32058 / R32058C4: got 'n.a.'
## Warning: Expecting numeric in D32059 / R32059C4: got 'n.a.'
## Warning: Expecting numeric in D32060 / R32060C4: got 'n.a.'
## Warning: Expecting numeric in D32061 / R32061C4: got 'n.a.'
## Warning: Expecting numeric in D32062 / R32062C4: got 'n.a.'
## Warning: Expecting numeric in D32063 / R32063C4: got 'n.a.'
## Warning: Expecting numeric in D32064 / R32064C4: got 'n.a.'
## Warning: Expecting numeric in D32065 / R32065C4: got 'n.a.'
## Warning: Expecting numeric in D32066 / R32066C4: got 'n.a.'
## Warning: Expecting numeric in D32067 / R32067C4: got 'n.a.'
## Warning: Expecting numeric in D32068 / R32068C4: got 'n.a.'
## Warning: Expecting numeric in D32069 / R32069C4: got 'n.a.'
## Warning: Expecting numeric in D32070 / R32070C4: got 'n.a.'
## Warning: Expecting numeric in D32071 / R32071C4: got 'n.a.'
## Warning: Expecting numeric in D32072 / R32072C4: got 'n.a.'
## Warning: Expecting numeric in D32073 / R32073C4: got 'n.a.'
## Warning: Expecting numeric in D32074 / R32074C4: got 'n.a.'
## Warning: Expecting numeric in D32075 / R32075C4: got 'n.a.'
## Warning: Expecting numeric in D32076 / R32076C4: got 'n.a.'
## Warning: Expecting numeric in D32077 / R32077C4: got 'n.a.'
## Warning: Expecting numeric in D32078 / R32078C4: got 'n.a.'
## Warning: Expecting numeric in D32079 / R32079C4: got 'n.a.'
## Warning: Expecting numeric in D32080 / R32080C4: got 'n.a.'
## Warning: Expecting numeric in D32081 / R32081C4: got 'n.a.'
## Warning: Expecting numeric in D32082 / R32082C4: got 'n.a.'
## Warning: Expecting numeric in D32083 / R32083C4: got 'n.a.'
## Warning: Expecting numeric in D32084 / R32084C4: got 'n.a.'
## Warning: Expecting numeric in D32085 / R32085C4: got 'n.a.'
## Warning: Expecting numeric in D32086 / R32086C4: got 'n.a.'
## Warning: Expecting numeric in D32087 / R32087C4: got 'n.a.'
## Warning: Expecting numeric in D32088 / R32088C4: got 'n.a.'
## Warning: Expecting numeric in D32089 / R32089C4: got 'n.a.'
## Warning: Expecting numeric in D32090 / R32090C4: got 'n.a.'
## Warning: Expecting numeric in D32091 / R32091C4: got 'n.a.'
## Warning: Expecting numeric in D32092 / R32092C4: got 'n.a.'
## Warning: Expecting numeric in D32093 / R32093C4: got 'n.a.'
## Warning: Expecting numeric in D32094 / R32094C4: got 'n.a.'
## Warning: Expecting numeric in D32095 / R32095C4: got 'n.a.'
## Warning: Expecting numeric in D32096 / R32096C4: got 'n.a.'
## Warning: Expecting numeric in D32097 / R32097C4: got 'n.a.'
## Warning: Expecting numeric in D32098 / R32098C4: got 'n.a.'
## Warning: Expecting numeric in D32099 / R32099C4: got 'n.a.'
## Warning: Expecting numeric in D32100 / R32100C4: got 'n.a.'
## Warning: Expecting numeric in D32101 / R32101C4: got 'n.a.'
## Warning: Expecting numeric in D32102 / R32102C4: got 'n.a.'
## Warning: Expecting numeric in D32103 / R32103C4: got 'n.a.'
## Warning: Expecting numeric in D32104 / R32104C4: got 'n.a.'
## Warning: Expecting numeric in D32105 / R32105C4: got 'n.a.'
## Warning: Expecting numeric in D32106 / R32106C4: got 'n.a.'
## Warning: Expecting numeric in D32107 / R32107C4: got 'n.a.'
## Warning: Expecting numeric in D32108 / R32108C4: got 'n.a.'
## Warning: Expecting numeric in D32109 / R32109C4: got 'n.a.'
## Warning: Expecting numeric in D32110 / R32110C4: got 'n.a.'
## Warning: Expecting numeric in D32111 / R32111C4: got 'n.a.'
## Warning: Expecting numeric in D32112 / R32112C4: got 'n.a.'
## Warning: Expecting numeric in D32113 / R32113C4: got 'n.a.'
## Warning: Expecting numeric in D32114 / R32114C4: got 'n.a.'
## Warning: Expecting numeric in D32115 / R32115C4: got 'n.a.'
## Warning: Expecting numeric in D32116 / R32116C4: got 'n.a.'
## Warning: Expecting numeric in D32117 / R32117C4: got 'n.a.'
## Warning: Expecting numeric in D32118 / R32118C4: got 'n.a.'
## Warning: Expecting numeric in D32119 / R32119C4: got 'n.a.'
## Warning: Expecting numeric in D32120 / R32120C4: got 'n.a.'
## Warning: Expecting numeric in D32121 / R32121C4: got 'n.a.'
## Warning: Expecting numeric in D32122 / R32122C4: got 'n.a.'
## Warning: Expecting numeric in D32123 / R32123C4: got 'n.a.'
## Warning: Expecting numeric in D32124 / R32124C4: got 'n.a.'
## Warning: Expecting numeric in D32125 / R32125C4: got 'n.a.'
## Warning: Expecting numeric in D32126 / R32126C4: got 'n.a.'
## Warning: Expecting numeric in D32127 / R32127C4: got 'n.a.'
## Warning: Expecting numeric in D32128 / R32128C4: got 'n.a.'
## Warning: Expecting numeric in D32129 / R32129C4: got 'n.a.'
## Warning: Expecting numeric in D32130 / R32130C4: got 'n.a.'
## Warning: Expecting numeric in D32131 / R32131C4: got 'n.a.'
## Warning: Expecting numeric in D32132 / R32132C4: got 'n.a.'
## Warning: Expecting numeric in D32133 / R32133C4: got 'n.a.'
## Warning: Expecting numeric in D32134 / R32134C4: got 'n.a.'
## Warning: Expecting numeric in D32135 / R32135C4: got 'n.a.'
## Warning: Expecting numeric in D32136 / R32136C4: got 'n.a.'
## Warning: Expecting numeric in D32137 / R32137C4: got 'n.a.'
## Warning: Expecting numeric in D32138 / R32138C4: got 'n.a.'
## Warning: Expecting numeric in D32139 / R32139C4: got 'n.a.'
## Warning: Expecting numeric in D32140 / R32140C4: got 'n.a.'
## Warning: Expecting numeric in D32141 / R32141C4: got 'n.a.'
## Warning: Expecting numeric in D32142 / R32142C4: got 'n.a.'
## Warning: Expecting numeric in D32143 / R32143C4: got 'n.a.'
## Warning: Expecting numeric in D32144 / R32144C4: got 'n.a.'
## Warning: Expecting numeric in D32145 / R32145C4: got 'n.a.'
## Warning: Expecting numeric in D32146 / R32146C4: got 'n.a.'
## Warning: Expecting numeric in D32147 / R32147C4: got 'n.a.'
## Warning: Expecting numeric in D32148 / R32148C4: got 'n.a.'
## Warning: Expecting numeric in D32149 / R32149C4: got 'n.a.'
## Warning: Expecting numeric in D32150 / R32150C4: got 'n.a.'
## Warning: Expecting numeric in D32151 / R32151C4: got 'n.a.'
## Warning: Expecting numeric in D32152 / R32152C4: got 'n.a.'
## Warning: Expecting numeric in D32153 / R32153C4: got 'n.a.'
## Warning: Expecting numeric in D32154 / R32154C4: got 'n.a.'
## Warning: Expecting numeric in D32155 / R32155C4: got 'n.a.'
## Warning: Expecting numeric in D32156 / R32156C4: got 'n.a.'
## Warning: Expecting numeric in D32157 / R32157C4: got 'n.a.'
## Warning: Expecting numeric in D32158 / R32158C4: got 'n.a.'
## Warning: Expecting numeric in D32159 / R32159C4: got 'n.a.'
## Warning: Expecting numeric in D32160 / R32160C4: got 'n.a.'
## Warning: Expecting numeric in D32161 / R32161C4: got 'n.a.'
## Warning: Expecting numeric in D32162 / R32162C4: got 'n.a.'
## Warning: Expecting numeric in D32163 / R32163C4: got 'n.a.'
## Warning: Expecting numeric in D32164 / R32164C4: got 'n.a.'
## Warning: Expecting numeric in D32165 / R32165C4: got 'n.a.'
## Warning: Expecting numeric in D32166 / R32166C4: got 'n.a.'
## Warning: Expecting numeric in D32167 / R32167C4: got 'n.a.'
## Warning: Expecting numeric in D32168 / R32168C4: got 'n.a.'
## Warning: Expecting numeric in D32169 / R32169C4: got 'n.a.'
## Warning: Expecting numeric in D32170 / R32170C4: got 'n.a.'
## Warning: Expecting numeric in D32171 / R32171C4: got 'n.a.'
## Warning: Expecting numeric in D32172 / R32172C4: got 'n.a.'
## Warning: Expecting numeric in D32173 / R32173C4: got 'n.a.'
## Warning: Expecting numeric in D32174 / R32174C4: got 'n.a.'
## Warning: Expecting numeric in D32175 / R32175C4: got 'n.a.'
## Warning: Expecting numeric in D32176 / R32176C4: got 'n.a.'
## Warning: Expecting numeric in D32177 / R32177C4: got 'n.a.'
## Warning: Expecting numeric in D32178 / R32178C4: got 'n.a.'
## Warning: Expecting numeric in D32179 / R32179C4: got 'n.a.'
## Warning: Expecting numeric in D32180 / R32180C4: got 'n.a.'
## Warning: Expecting numeric in D32181 / R32181C4: got 'n.a.'
## Warning: Expecting numeric in D32182 / R32182C4: got 'n.a.'
## Warning: Expecting numeric in D32183 / R32183C4: got 'n.a.'
## Warning: Expecting numeric in D32184 / R32184C4: got 'n.a.'
## Warning: Expecting numeric in D32185 / R32185C4: got 'n.a.'
## Warning: Expecting numeric in D32186 / R32186C4: got 'n.a.'
## Warning: Expecting numeric in D32187 / R32187C4: got 'n.a.'
## Warning: Expecting numeric in D32188 / R32188C4: got 'n.a.'
## Warning: Expecting numeric in D32189 / R32189C4: got 'n.a.'
## Warning: Expecting numeric in D32190 / R32190C4: got 'n.a.'
## Warning: Expecting numeric in D32191 / R32191C4: got 'n.a.'
## Warning: Expecting numeric in D32192 / R32192C4: got 'n.a.'
## Warning: Expecting numeric in D32193 / R32193C4: got 'n.a.'
## Warning: Expecting numeric in D32194 / R32194C4: got 'n.a.'
## Warning: Expecting numeric in D32195 / R32195C4: got 'n.a.'
## Warning: Expecting numeric in D32196 / R32196C4: got 'n.a.'
## Warning: Expecting numeric in D32197 / R32197C4: got 'n.a.'
## Warning: Expecting numeric in D32198 / R32198C4: got 'n.a.'
## Warning: Expecting numeric in D32199 / R32199C4: got 'n.a.'
## Warning: Expecting numeric in D32200 / R32200C4: got 'n.a.'
## Warning: Expecting numeric in D32201 / R32201C4: got 'n.a.'
## Warning: Expecting numeric in D32202 / R32202C4: got 'n.a.'
## Warning: Expecting numeric in D32203 / R32203C4: got 'n.a.'
## Warning: Expecting numeric in D32204 / R32204C4: got 'n.a.'
## Warning: Expecting numeric in D32205 / R32205C4: got 'n.a.'
## Warning: Expecting numeric in D32206 / R32206C4: got 'n.a.'
## Warning: Expecting numeric in D32207 / R32207C4: got 'n.a.'
## Warning: Expecting numeric in D32208 / R32208C4: got 'n.a.'
## Warning: Expecting numeric in D32209 / R32209C4: got 'n.a.'
## Warning: Expecting numeric in D32210 / R32210C4: got 'n.a.'
## Warning: Expecting numeric in D32211 / R32211C4: got 'n.a.'
## Warning: Expecting numeric in D32212 / R32212C4: got 'n.a.'
## Warning: Expecting numeric in D32213 / R32213C4: got 'n.a.'
## Warning: Expecting numeric in D32214 / R32214C4: got 'n.a.'
## Warning: Expecting numeric in D32215 / R32215C4: got 'n.a.'
## Warning: Expecting numeric in D32216 / R32216C4: got 'n.a.'
## Warning: Expecting numeric in D32217 / R32217C4: got 'n.a.'
## Warning: Expecting numeric in D32218 / R32218C4: got 'n.a.'
## Warning: Expecting numeric in D32219 / R32219C4: got 'n.a.'
## Warning: Expecting numeric in D32220 / R32220C4: got 'n.a.'
## Warning: Expecting numeric in D32221 / R32221C4: got 'n.a.'
## Warning: Expecting numeric in D32222 / R32222C4: got 'n.a.'
## Warning: Expecting numeric in D32223 / R32223C4: got 'n.a.'
## Warning: Expecting numeric in D32224 / R32224C4: got 'n.a.'
## Warning: Expecting numeric in D32225 / R32225C4: got 'n.a.'
## Warning: Expecting numeric in D32226 / R32226C4: got 'n.a.'
## Warning: Expecting numeric in D32227 / R32227C4: got 'n.a.'
## Warning: Expecting numeric in D32228 / R32228C4: got 'n.a.'
## Warning: Expecting numeric in D32229 / R32229C4: got 'n.a.'
## Warning: Expecting numeric in D32230 / R32230C4: got 'n.a.'
## Warning: Expecting numeric in D32231 / R32231C4: got 'n.a.'
## Warning: Expecting numeric in D32232 / R32232C4: got 'n.a.'
## Warning: Expecting numeric in D32233 / R32233C4: got 'n.a.'
## Warning: Expecting numeric in D32234 / R32234C4: got 'n.a.'
## Warning: Expecting numeric in D32235 / R32235C4: got 'n.a.'
## Warning: Expecting numeric in D32236 / R32236C4: got 'n.a.'
## Warning: Expecting numeric in D32237 / R32237C4: got 'n.a.'
## Warning: Expecting numeric in D32238 / R32238C4: got 'n.a.'
## Warning: Expecting numeric in D32239 / R32239C4: got 'n.a.'
## Warning: Expecting numeric in D32240 / R32240C4: got 'n.a.'
## Warning: Expecting numeric in D32241 / R32241C4: got 'n.a.'
## Warning: Expecting numeric in D32242 / R32242C4: got 'n.a.'
## Warning: Expecting numeric in D32243 / R32243C4: got 'n.a.'
## Warning: Expecting numeric in D32244 / R32244C4: got 'n.a.'
## Warning: Expecting numeric in D32245 / R32245C4: got 'n.a.'
## Warning: Expecting numeric in D32246 / R32246C4: got 'n.a.'
## Warning: Expecting numeric in D32247 / R32247C4: got 'n.a.'
## Warning: Expecting numeric in D32248 / R32248C4: got 'n.a.'
## Warning: Expecting numeric in D32249 / R32249C4: got 'n.a.'
## Warning: Expecting numeric in D32250 / R32250C4: got 'n.a.'
## Warning: Expecting numeric in D32251 / R32251C4: got 'n.a.'
## Warning: Expecting numeric in D32252 / R32252C4: got 'n.a.'
## Warning: Expecting numeric in D32253 / R32253C4: got 'n.a.'
## Warning: Expecting numeric in D32254 / R32254C4: got 'n.a.'
## Warning: Expecting numeric in D32255 / R32255C4: got 'n.a.'
## Warning: Expecting numeric in D32256 / R32256C4: got 'n.a.'
## Warning: Expecting numeric in D32257 / R32257C4: got 'n.a.'
## Warning: Expecting numeric in D32258 / R32258C4: got 'n.a.'
## Warning: Expecting numeric in D32259 / R32259C4: got 'n.a.'
## Warning: Expecting numeric in D32260 / R32260C4: got 'n.a.'
## Warning: Expecting numeric in D32261 / R32261C4: got 'n.a.'
## Warning: Expecting numeric in D32262 / R32262C4: got 'n.a.'
## Warning: Expecting numeric in D32263 / R32263C4: got 'n.a.'
## Warning: Expecting numeric in D32264 / R32264C4: got 'n.a.'
## Warning: Expecting numeric in D32265 / R32265C4: got 'n.a.'
## Warning: Expecting numeric in D32266 / R32266C4: got 'n.a.'
## Warning: Expecting numeric in D32267 / R32267C4: got 'n.a.'
## Warning: Expecting numeric in D32268 / R32268C4: got 'n.a.'
## Warning: Expecting numeric in D32269 / R32269C4: got 'n.a.'
## Warning: Expecting numeric in D32270 / R32270C4: got 'n.a.'
## Warning: Expecting numeric in D32271 / R32271C4: got 'n.a.'
## Warning: Expecting numeric in D32272 / R32272C4: got 'n.a.'
## Warning: Expecting numeric in D32273 / R32273C4: got 'n.a.'
## Warning: Expecting numeric in D32274 / R32274C4: got 'n.a.'
## Warning: Expecting numeric in D32275 / R32275C4: got 'n.a.'
## Warning: Expecting numeric in D32276 / R32276C4: got 'n.a.'
## Warning: Expecting numeric in D32277 / R32277C4: got 'n.a.'
## Warning: Expecting numeric in D32278 / R32278C4: got 'n.a.'
## Warning: Expecting numeric in D32279 / R32279C4: got 'n.a.'
## Warning: Expecting numeric in D32280 / R32280C4: got 'n.a.'
## Warning: Expecting numeric in D32281 / R32281C4: got 'n.a.'
## Warning: Expecting numeric in D32282 / R32282C4: got 'n.a.'
## Warning: Expecting numeric in D32283 / R32283C4: got 'n.a.'
## Warning: Expecting numeric in D32284 / R32284C4: got 'n.a.'
## Warning: Expecting numeric in D32285 / R32285C4: got 'n.a.'
## Warning: Expecting numeric in D32286 / R32286C4: got 'n.a.'
## Warning: Expecting numeric in D32287 / R32287C4: got 'n.a.'
## Warning: Expecting numeric in D32288 / R32288C4: got 'n.a.'
## Warning: Expecting numeric in D32289 / R32289C4: got 'n.a.'
## Warning: Expecting numeric in D32290 / R32290C4: got 'n.a.'
## Warning: Expecting numeric in D32291 / R32291C4: got 'n.a.'
## Warning: Expecting numeric in D32292 / R32292C4: got 'n.a.'
## Warning: Expecting numeric in D32293 / R32293C4: got 'n.a.'
## Warning: Expecting numeric in D32294 / R32294C4: got 'n.a.'
## Warning: Expecting numeric in D32295 / R32295C4: got 'n.a.'
## Warning: Expecting numeric in D32296 / R32296C4: got 'n.a.'
## Warning: Expecting numeric in D32297 / R32297C4: got 'n.a.'
## Warning: Expecting numeric in D32298 / R32298C4: got 'n.a.'
## Warning: Expecting numeric in D32299 / R32299C4: got 'n.a.'
## Warning: Expecting numeric in D32300 / R32300C4: got 'n.a.'
## Warning: Expecting numeric in D32301 / R32301C4: got 'n.a.'
## Warning: Expecting numeric in D32302 / R32302C4: got 'n.a.'
## Warning: Expecting numeric in D32303 / R32303C4: got 'n.a.'
## Warning: Expecting numeric in D32304 / R32304C4: got 'n.a.'
## Warning: Expecting numeric in D32305 / R32305C4: got 'n.a.'
## Warning: Expecting numeric in D32306 / R32306C4: got 'n.a.'
## Warning: Expecting numeric in D32307 / R32307C4: got 'n.a.'
## Warning: Expecting numeric in D32308 / R32308C4: got 'n.a.'
## Warning: Expecting numeric in D32309 / R32309C4: got 'n.a.'
## Warning: Expecting numeric in D32310 / R32310C4: got 'n.a.'
## Warning: Expecting numeric in D32311 / R32311C4: got 'n.a.'
## Warning: Expecting numeric in D32312 / R32312C4: got 'n.a.'
## Warning: Expecting numeric in D32313 / R32313C4: got 'n.a.'
## Warning: Expecting numeric in D32314 / R32314C4: got 'n.a.'
## Warning: Expecting numeric in D32315 / R32315C4: got 'n.a.'
## Warning: Expecting numeric in D32316 / R32316C4: got 'n.a.'
## Warning: Expecting numeric in D32317 / R32317C4: got 'n.a.'
## Warning: Expecting numeric in D32318 / R32318C4: got 'n.a.'
## Warning: Expecting numeric in D32319 / R32319C4: got 'n.a.'
## Warning: Expecting numeric in D32320 / R32320C4: got 'n.a.'
## Warning: Expecting numeric in D32321 / R32321C4: got 'n.a.'
## Warning: Expecting numeric in D32322 / R32322C4: got 'n.a.'
## Warning: Expecting numeric in D32323 / R32323C4: got 'n.a.'
## Warning: Expecting numeric in D32324 / R32324C4: got 'n.a.'
## Warning: Expecting numeric in D32325 / R32325C4: got 'n.a.'
## Warning: Expecting numeric in D32326 / R32326C4: got 'n.a.'
## Warning: Expecting numeric in D32327 / R32327C4: got 'n.a.'
## Warning: Expecting numeric in D32328 / R32328C4: got 'n.a.'
## Warning: Expecting numeric in D32329 / R32329C4: got 'n.a.'
## Warning: Expecting numeric in D32330 / R32330C4: got 'n.a.'
## Warning: Expecting numeric in D32331 / R32331C4: got 'n.a.'
## Warning: Expecting numeric in D32332 / R32332C4: got 'n.a.'
## Warning: Expecting numeric in D32333 / R32333C4: got 'n.a.'
## Warning: Expecting numeric in D32334 / R32334C4: got 'n.a.'
## Warning: Expecting numeric in D32335 / R32335C4: got 'n.a.'
## Warning: Expecting numeric in D32336 / R32336C4: got 'n.a.'
## Warning: Expecting numeric in D32337 / R32337C4: got 'n.a.'
## Warning: Expecting numeric in D32338 / R32338C4: got 'n.a.'
## Warning: Expecting numeric in D32339 / R32339C4: got 'n.a.'
## Warning: Expecting numeric in D32340 / R32340C4: got 'n.a.'
## Warning: Expecting numeric in D32341 / R32341C4: got 'n.a.'
## Warning: Expecting numeric in D32342 / R32342C4: got 'n.a.'
## Warning: Expecting numeric in D32343 / R32343C4: got 'n.a.'
## Warning: Expecting numeric in D32344 / R32344C4: got 'n.a.'
## Warning: Expecting numeric in D32345 / R32345C4: got 'n.a.'
## Warning: Expecting numeric in D32346 / R32346C4: got 'n.a.'
## Warning: Expecting numeric in D32347 / R32347C4: got 'n.a.'
## Warning: Expecting numeric in D32348 / R32348C4: got 'n.a.'
## Warning: Expecting numeric in D32349 / R32349C4: got 'n.a.'
## Warning: Expecting numeric in D32350 / R32350C4: got 'n.a.'
## Warning: Expecting numeric in D32351 / R32351C4: got 'n.a.'
## Warning: Expecting numeric in D32352 / R32352C4: got 'n.a.'
## Warning: Expecting numeric in D32353 / R32353C4: got 'n.a.'
## Warning: Expecting numeric in D32354 / R32354C4: got 'n.a.'
## Warning: Expecting numeric in D32355 / R32355C4: got 'n.a.'
## Warning: Expecting numeric in D32356 / R32356C4: got 'n.a.'
## Warning: Expecting numeric in D32357 / R32357C4: got 'n.a.'
## Warning: Expecting numeric in D32358 / R32358C4: got 'n.a.'
## Warning: Expecting numeric in D32359 / R32359C4: got 'n.a.'
## Warning: Expecting numeric in D32360 / R32360C4: got 'n.a.'
## Warning: Expecting numeric in D32361 / R32361C4: got 'n.a.'
## Warning: Expecting numeric in D32362 / R32362C4: got 'n.a.'
## Warning: Expecting numeric in D32363 / R32363C4: got 'n.a.'
## Warning: Expecting numeric in D32364 / R32364C4: got 'n.a.'
## Warning: Expecting numeric in D32365 / R32365C4: got 'n.a.'
## Warning: Expecting numeric in D32366 / R32366C4: got 'n.a.'
## Warning: Expecting numeric in D32367 / R32367C4: got 'n.a.'
## Warning: Expecting numeric in D32368 / R32368C4: got 'n.a.'
## Warning: Expecting numeric in D32369 / R32369C4: got 'n.a.'
## Warning: Expecting numeric in D32370 / R32370C4: got 'n.a.'
## Warning: Expecting numeric in D32371 / R32371C4: got 'n.a.'
## Warning: Expecting numeric in D32372 / R32372C4: got 'n.a.'
## Warning: Expecting numeric in D32373 / R32373C4: got 'n.a.'
## Warning: Expecting numeric in D32374 / R32374C4: got 'n.a.'
## Warning: Expecting numeric in D32375 / R32375C4: got 'n.a.'
## Warning: Expecting numeric in D32376 / R32376C4: got 'n.a.'
## Warning: Expecting numeric in D32377 / R32377C4: got 'n.a.'
## Warning: Expecting numeric in D32378 / R32378C4: got 'n.a.'
## Warning: Expecting numeric in D32379 / R32379C4: got 'n.a.'
## Warning: Expecting numeric in D32380 / R32380C4: got 'n.a.'
## Warning: Expecting numeric in D32381 / R32381C4: got 'n.a.'
## Warning: Expecting numeric in D32382 / R32382C4: got 'n.a.'
## Warning: Expecting numeric in D32383 / R32383C4: got 'n.a.'
## Warning: Expecting numeric in D32384 / R32384C4: got 'n.a.'
## Warning: Expecting numeric in D32385 / R32385C4: got 'n.a.'
## Warning: Expecting numeric in D32386 / R32386C4: got 'n.a.'
## Warning: Expecting numeric in D32387 / R32387C4: got 'n.a.'
## Warning: Expecting numeric in D32388 / R32388C4: got 'n.a.'
## Warning: Expecting numeric in D32389 / R32389C4: got 'n.a.'
## Warning: Expecting numeric in D32390 / R32390C4: got 'n.a.'
## Warning: Expecting numeric in D32391 / R32391C4: got 'n.a.'
## Warning: Expecting numeric in D32392 / R32392C4: got 'n.a.'
## Warning: Expecting numeric in D32393 / R32393C4: got 'n.a.'
## Warning: Expecting numeric in D32394 / R32394C4: got 'n.a.'
## Warning: Expecting numeric in D32395 / R32395C4: got 'n.a.'
## Warning: Expecting numeric in D32396 / R32396C4: got 'n.a.'
## Warning: Expecting numeric in D32397 / R32397C4: got 'n.a.'
## Warning: Expecting numeric in D32398 / R32398C4: got 'n.a.'
## Warning: Expecting numeric in D32399 / R32399C4: got 'n.a.'
## Warning: Expecting numeric in D32400 / R32400C4: got 'n.a.'
## Warning: Expecting numeric in D32401 / R32401C4: got 'n.a.'
## Warning: Expecting numeric in D32402 / R32402C4: got 'n.a.'
## Warning: Expecting numeric in D32403 / R32403C4: got 'n.a.'
## Warning: Expecting numeric in D32404 / R32404C4: got 'n.a.'
## Warning: Expecting numeric in D32405 / R32405C4: got 'n.a.'
## Warning: Expecting numeric in D32406 / R32406C4: got 'n.a.'
## Warning: Expecting numeric in D32407 / R32407C4: got 'n.a.'
## Warning: Expecting numeric in D32408 / R32408C4: got 'n.a.'
## Warning: Expecting numeric in D32409 / R32409C4: got 'n.a.'
## Warning: Expecting numeric in D32410 / R32410C4: got 'n.a.'
## Warning: Expecting numeric in D32411 / R32411C4: got 'n.a.'
## Warning: Expecting numeric in D32412 / R32412C4: got 'n.a.'
## Warning: Expecting numeric in D32413 / R32413C4: got 'n.a.'
## Warning: Expecting numeric in D32414 / R32414C4: got 'n.a.'
## Warning: Expecting numeric in D32415 / R32415C4: got 'n.a.'
## Warning: Expecting numeric in D32416 / R32416C4: got 'n.a.'
## Warning: Expecting numeric in D32417 / R32417C4: got 'n.a.'
## Warning: Expecting numeric in D32418 / R32418C4: got 'n.a.'
## Warning: Expecting numeric in D32419 / R32419C4: got 'n.a.'
## Warning: Expecting numeric in D32420 / R32420C4: got 'n.a.'
## Warning: Expecting numeric in D32421 / R32421C4: got 'n.a.'
## Warning: Expecting numeric in D32422 / R32422C4: got 'n.a.'
## Warning: Expecting numeric in D32423 / R32423C4: got 'n.a.'
## Warning: Expecting numeric in D32424 / R32424C4: got 'n.a.'
## Warning: Expecting numeric in D32425 / R32425C4: got 'n.a.'
## Warning: Expecting numeric in D32426 / R32426C4: got 'n.a.'
## Warning: Expecting numeric in D32427 / R32427C4: got 'n.a.'
## Warning: Expecting numeric in D32428 / R32428C4: got 'n.a.'
## Warning: Expecting numeric in D32429 / R32429C4: got 'n.a.'
## Warning: Expecting numeric in D32430 / R32430C4: got 'n.a.'
## Warning: Expecting numeric in D32431 / R32431C4: got 'n.a.'
## Warning: Expecting numeric in D32432 / R32432C4: got 'n.a.'
## Warning: Expecting numeric in D32433 / R32433C4: got 'n.a.'
## Warning: Expecting numeric in D32434 / R32434C4: got 'n.a.'
## Warning: Expecting numeric in D32435 / R32435C4: got 'n.a.'
## Warning: Expecting numeric in D32436 / R32436C4: got 'n.a.'
## Warning: Expecting numeric in D32437 / R32437C4: got 'n.a.'
## Warning: Expecting numeric in D32438 / R32438C4: got 'n.a.'
## Warning: Expecting numeric in D32439 / R32439C4: got 'n.a.'
## Warning: Expecting numeric in D32440 / R32440C4: got 'n.a.'
## Warning: Expecting numeric in D32441 / R32441C4: got 'n.a.'
## Warning: Expecting numeric in D32442 / R32442C4: got 'n.a.'
## Warning: Expecting numeric in D32443 / R32443C4: got 'n.a.'
## Warning: Expecting numeric in D32444 / R32444C4: got 'n.a.'
## Warning: Expecting numeric in D32445 / R32445C4: got 'n.a.'
## Warning: Expecting numeric in D32446 / R32446C4: got 'n.a.'
## Warning: Expecting numeric in D32447 / R32447C4: got 'n.a.'
## Warning: Expecting numeric in D32448 / R32448C4: got 'n.a.'
## Warning: Expecting numeric in D32449 / R32449C4: got 'n.a.'
## Warning: Expecting numeric in D32450 / R32450C4: got 'n.a.'
## Warning: Expecting numeric in D32451 / R32451C4: got 'n.a.'
## Warning: Expecting numeric in D32452 / R32452C4: got 'n.a.'
## Warning: Expecting numeric in D32453 / R32453C4: got 'n.a.'
## Warning: Expecting numeric in D32454 / R32454C4: got 'n.a.'
## Warning: Expecting numeric in D32455 / R32455C4: got 'n.a.'
## Warning: Expecting numeric in D32456 / R32456C4: got 'n.a.'
## Warning: Expecting numeric in D32457 / R32457C4: got 'n.a.'
## Warning: Expecting numeric in D32458 / R32458C4: got 'n.a.'
## Warning: Expecting numeric in D32459 / R32459C4: got 'n.a.'
## Warning: Expecting numeric in D32460 / R32460C4: got 'n.a.'
## Warning: Expecting numeric in D32461 / R32461C4: got 'n.a.'
## Warning: Expecting numeric in D32462 / R32462C4: got 'n.a.'
## Warning: Expecting numeric in D32463 / R32463C4: got 'n.a.'
## Warning: Expecting numeric in D32464 / R32464C4: got 'n.a.'
## Warning: Expecting numeric in D32465 / R32465C4: got 'n.a.'
## Warning: Expecting numeric in D32466 / R32466C4: got 'n.a.'
## Warning: Expecting numeric in D32467 / R32467C4: got 'n.a.'
## Warning: Expecting numeric in D32468 / R32468C4: got 'n.a.'
## Warning: Expecting numeric in D32469 / R32469C4: got 'n.a.'
## Warning: Expecting numeric in D32470 / R32470C4: got 'n.a.'
## Warning: Expecting numeric in D32471 / R32471C4: got 'n.a.'
## Warning: Expecting numeric in D32472 / R32472C4: got 'n.a.'
## Warning: Expecting numeric in D32473 / R32473C4: got 'n.a.'
## Warning: Expecting numeric in D32474 / R32474C4: got 'n.a.'
## Warning: Expecting numeric in D32475 / R32475C4: got 'n.a.'
## Warning: Expecting numeric in D32476 / R32476C4: got 'n.a.'
## Warning: Expecting numeric in D32477 / R32477C4: got 'n.a.'
## Warning: Expecting numeric in D32478 / R32478C4: got 'n.a.'
## Warning: Expecting numeric in D32479 / R32479C4: got 'n.a.'
## Warning: Expecting numeric in D32480 / R32480C4: got 'n.a.'
## Warning: Expecting numeric in D32481 / R32481C4: got 'n.a.'
## Warning: Expecting numeric in D32482 / R32482C4: got 'n.a.'
## Warning: Expecting numeric in D32483 / R32483C4: got 'n.a.'
## Warning: Expecting numeric in D32484 / R32484C4: got 'n.a.'
## Warning: Expecting numeric in D32485 / R32485C4: got 'n.a.'
## Warning: Expecting numeric in D32486 / R32486C4: got 'n.a.'
## Warning: Expecting numeric in D32487 / R32487C4: got 'n.a.'
## Warning: Expecting numeric in D32488 / R32488C4: got 'n.a.'
## Warning: Expecting numeric in D32489 / R32489C4: got 'n.a.'
## Warning: Expecting numeric in D32490 / R32490C4: got 'n.a.'
## Warning: Expecting numeric in D32491 / R32491C4: got 'n.a.'
## Warning: Expecting numeric in D32492 / R32492C4: got 'n.a.'
## Warning: Expecting numeric in D32493 / R32493C4: got 'n.a.'
## Warning: Expecting numeric in D32494 / R32494C4: got 'n.a.'
## Warning: Expecting numeric in D32495 / R32495C4: got 'n.a.'
## Warning: Expecting numeric in D32496 / R32496C4: got 'n.a.'
## Warning: Expecting numeric in D32497 / R32497C4: got 'n.a.'
## Warning: Expecting numeric in D32498 / R32498C4: got 'n.a.'
## Warning: Expecting numeric in D32499 / R32499C4: got 'n.a.'
## Warning: Expecting numeric in D32500 / R32500C4: got 'n.a.'
## Warning: Expecting numeric in D32501 / R32501C4: got 'n.a.'
## Warning: Expecting numeric in D32502 / R32502C4: got 'n.a.'
## Warning: Expecting numeric in D32503 / R32503C4: got 'n.a.'
## Warning: Expecting numeric in D32504 / R32504C4: got 'n.a.'
## Warning: Expecting numeric in D32505 / R32505C4: got 'n.a.'
## Warning: Expecting numeric in D32506 / R32506C4: got 'n.a.'
## Warning: Expecting numeric in D32507 / R32507C4: got 'n.a.'
## Warning: Expecting numeric in D32508 / R32508C4: got 'n.a.'
## Warning: Expecting numeric in D32509 / R32509C4: got 'n.a.'
## Warning: Expecting numeric in D32510 / R32510C4: got 'n.a.'
## Warning: Expecting numeric in D32511 / R32511C4: got 'n.a.'
## Warning: Expecting numeric in D32512 / R32512C4: got 'n.a.'
## Warning: Expecting numeric in D32513 / R32513C4: got 'n.a.'
## Warning: Expecting numeric in D32514 / R32514C4: got 'n.a.'
## Warning: Expecting numeric in D32515 / R32515C4: got 'n.a.'
## Warning: Expecting numeric in D32516 / R32516C4: got 'n.a.'
## Warning: Expecting numeric in D32517 / R32517C4: got 'n.a.'
## Warning: Expecting numeric in D32518 / R32518C4: got 'n.a.'
## Warning: Expecting numeric in D32519 / R32519C4: got 'n.a.'
## Warning: Expecting numeric in D32520 / R32520C4: got 'n.a.'
## Warning: Expecting numeric in D32521 / R32521C4: got 'n.a.'
## Warning: Expecting numeric in D32522 / R32522C4: got 'n.a.'
## Warning: Expecting numeric in D32523 / R32523C4: got 'n.a.'
## Warning: Expecting numeric in D32524 / R32524C4: got 'n.a.'
## Warning: Expecting numeric in D32525 / R32525C4: got 'n.a.'
## Warning: Expecting numeric in D32526 / R32526C4: got 'n.a.'
## Warning: Expecting numeric in D32527 / R32527C4: got 'n.a.'
## Warning: Expecting numeric in D32528 / R32528C4: got 'n.a.'
## Warning: Expecting numeric in D32529 / R32529C4: got 'n.a.'
## Warning: Expecting numeric in D32530 / R32530C4: got 'n.a.'
## Warning: Expecting numeric in D32531 / R32531C4: got 'n.a.'
## Warning: Expecting numeric in D32532 / R32532C4: got 'n.a.'
## Warning: Expecting numeric in D32533 / R32533C4: got 'n.a.'
## Warning: Expecting numeric in D32534 / R32534C4: got 'n.a.'
## Warning: Expecting numeric in D32535 / R32535C4: got 'n.a.'
## Warning: Expecting numeric in D32536 / R32536C4: got 'n.a.'
## Warning: Expecting numeric in D32537 / R32537C4: got 'n.a.'
## Warning: Expecting numeric in D32538 / R32538C4: got 'n.a.'
## Warning: Expecting numeric in D32539 / R32539C4: got 'n.a.'
## Warning: Expecting numeric in D32540 / R32540C4: got 'n.a.'
## Warning: Expecting numeric in D32541 / R32541C4: got 'n.a.'
## Warning: Expecting numeric in D32542 / R32542C4: got 'n.a.'
## Warning: Expecting numeric in D32543 / R32543C4: got 'n.a.'
## Warning: Expecting numeric in D32544 / R32544C4: got 'n.a.'
## Warning: Expecting numeric in D32545 / R32545C4: got 'n.a.'
## Warning: Expecting numeric in D32546 / R32546C4: got 'n.a.'
## Warning: Expecting numeric in D32547 / R32547C4: got 'n.a.'
## Warning: Expecting numeric in D32548 / R32548C4: got 'n.a.'
## Warning: Expecting numeric in D32549 / R32549C4: got 'n.a.'
## Warning: Expecting numeric in D32550 / R32550C4: got 'n.a.'
## Warning: Expecting numeric in D32551 / R32551C4: got 'n.a.'
## Warning: Expecting numeric in D32552 / R32552C4: got 'n.a.'
## Warning: Expecting numeric in D32553 / R32553C4: got 'n.a.'
## Warning: Expecting numeric in D32554 / R32554C4: got 'n.a.'
## Warning: Expecting numeric in D32555 / R32555C4: got 'n.a.'
## Warning: Expecting numeric in D32556 / R32556C4: got 'n.a.'
## Warning: Expecting numeric in D32557 / R32557C4: got 'n.a.'
## Warning: Expecting numeric in D32558 / R32558C4: got 'n.a.'
## Warning: Expecting numeric in D32559 / R32559C4: got 'n.a.'
## Warning: Expecting numeric in D32560 / R32560C4: got 'n.a.'
## Warning: Expecting numeric in D32561 / R32561C4: got 'n.a.'
## Warning: Expecting numeric in D32562 / R32562C4: got 'n.a.'
## Warning: Expecting numeric in D32563 / R32563C4: got 'n.a.'
## Warning: Expecting numeric in D32564 / R32564C4: got 'n.a.'
## Warning: Expecting numeric in D32565 / R32565C4: got 'n.a.'
## Warning: Expecting numeric in D32566 / R32566C4: got 'n.a.'
## Warning: Expecting numeric in D32567 / R32567C4: got 'n.a.'
## Warning: Expecting numeric in D32568 / R32568C4: got 'n.a.'
## Warning: Expecting numeric in D32569 / R32569C4: got 'n.a.'
## Warning: Expecting numeric in D32570 / R32570C4: got 'n.a.'
## Warning: Expecting numeric in D32571 / R32571C4: got 'n.a.'
## Warning: Expecting numeric in D32572 / R32572C4: got 'n.a.'
## Warning: Expecting numeric in D32573 / R32573C4: got 'n.a.'
## Warning: Expecting numeric in D32574 / R32574C4: got 'n.a.'
## Warning: Expecting numeric in D32575 / R32575C4: got 'n.a.'
## Warning: Expecting numeric in D32576 / R32576C4: got 'n.a.'
## Warning: Expecting numeric in D32577 / R32577C4: got 'n.a.'
## Warning: Expecting numeric in D32578 / R32578C4: got 'n.a.'
## Warning: Expecting numeric in D32579 / R32579C4: got 'n.a.'
## Warning: Expecting numeric in D32580 / R32580C4: got 'n.a.'
## Warning: Expecting numeric in D32581 / R32581C4: got 'n.a.'
## Warning: Expecting numeric in D32582 / R32582C4: got 'n.a.'
## Warning: Expecting numeric in D32583 / R32583C4: got 'n.a.'
## Warning: Expecting numeric in D32584 / R32584C4: got 'n.a.'
## Warning: Expecting numeric in D32585 / R32585C4: got 'n.a.'
## Warning: Expecting numeric in D32586 / R32586C4: got 'n.a.'
## Warning: Expecting numeric in D32587 / R32587C4: got 'n.a.'
## Warning: Expecting numeric in D32588 / R32588C4: got 'n.a.'
## Warning: Expecting numeric in D32589 / R32589C4: got 'n.a.'
## Warning: Expecting numeric in D32590 / R32590C4: got 'n.a.'
## Warning: Expecting numeric in D32591 / R32591C4: got 'n.a.'
## Warning: Expecting numeric in D32592 / R32592C4: got 'n.a.'
## Warning: Expecting numeric in D32593 / R32593C4: got 'n.a.'
## Warning: Expecting numeric in D32594 / R32594C4: got 'n.a.'
## Warning: Expecting numeric in D32595 / R32595C4: got 'n.a.'
## Warning: Expecting numeric in D32596 / R32596C4: got 'n.a.'
## Warning: Expecting numeric in D32597 / R32597C4: got 'n.a.'
## Warning: Expecting numeric in D32598 / R32598C4: got 'n.a.'
## Warning: Expecting numeric in D32599 / R32599C4: got 'n.a.'
## Warning: Expecting numeric in D32600 / R32600C4: got 'n.a.'
## Warning: Expecting numeric in D32601 / R32601C4: got 'n.a.'
## Warning: Expecting numeric in D32602 / R32602C4: got 'n.a.'
## Warning: Expecting numeric in D32603 / R32603C4: got 'n.a.'
## Warning: Expecting numeric in D32604 / R32604C4: got 'n.a.'
## Warning: Expecting numeric in D32605 / R32605C4: got 'n.a.'
## Warning: Expecting numeric in D32606 / R32606C4: got 'n.a.'
## Warning: Expecting numeric in D32607 / R32607C4: got 'n.a.'
## Warning: Expecting numeric in D32608 / R32608C4: got 'n.a.'
## Warning: Expecting numeric in D32609 / R32609C4: got 'n.a.'
## Warning: Expecting numeric in D32610 / R32610C4: got 'n.a.'
## Warning: Expecting numeric in D32611 / R32611C4: got 'n.a.'
## Warning: Expecting numeric in D32612 / R32612C4: got 'n.a.'
## Warning: Expecting numeric in D32613 / R32613C4: got 'n.a.'
## Warning: Expecting numeric in D32614 / R32614C4: got 'n.a.'
## Warning: Expecting numeric in D32615 / R32615C4: got 'n.a.'
## Warning: Expecting numeric in D32616 / R32616C4: got 'n.a.'
## Warning: Expecting numeric in D32617 / R32617C4: got 'n.a.'
## Warning: Expecting numeric in D32618 / R32618C4: got 'n.a.'
## Warning: Expecting numeric in D32619 / R32619C4: got 'n.a.'
## Warning: Expecting numeric in D32620 / R32620C4: got 'n.a.'
## Warning: Expecting numeric in D32621 / R32621C4: got 'n.a.'
## Warning: Expecting numeric in D32622 / R32622C4: got 'n.a.'
## Warning: Expecting numeric in D32623 / R32623C4: got 'n.a.'
## Warning: Expecting numeric in D32624 / R32624C4: got 'n.a.'
## Warning: Expecting numeric in D32625 / R32625C4: got 'n.a.'
## Warning: Expecting numeric in D32626 / R32626C4: got 'n.a.'
## Warning: Expecting numeric in D32627 / R32627C4: got 'n.a.'
## Warning: Expecting numeric in D32628 / R32628C4: got 'n.a.'
## Warning: Expecting numeric in D32629 / R32629C4: got 'n.a.'
## Warning: Expecting numeric in D32630 / R32630C4: got 'n.a.'
## Warning: Expecting numeric in D32631 / R32631C4: got 'n.a.'
## Warning: Expecting numeric in D32632 / R32632C4: got 'n.a.'
## Warning: Expecting numeric in D32633 / R32633C4: got 'n.a.'
## Warning: Expecting numeric in D32634 / R32634C4: got 'n.a.'
## Warning: Expecting numeric in D32635 / R32635C4: got 'n.a.'
## Warning: Expecting numeric in D32636 / R32636C4: got 'n.a.'
## Warning: Expecting numeric in D32637 / R32637C4: got 'n.a.'
## Warning: Expecting numeric in D32638 / R32638C4: got 'n.a.'
## Warning: Expecting numeric in D32639 / R32639C4: got 'n.a.'
## Warning: Expecting numeric in D32640 / R32640C4: got 'n.a.'
## Warning: Expecting numeric in D32641 / R32641C4: got 'n.a.'
## Warning: Expecting numeric in D32642 / R32642C4: got 'n.a.'
## Warning: Expecting numeric in D32643 / R32643C4: got 'n.a.'
## Warning: Expecting numeric in D32644 / R32644C4: got 'n.a.'
## Warning: Expecting numeric in D32645 / R32645C4: got 'n.a.'
## Warning: Expecting numeric in D32646 / R32646C4: got 'n.a.'
## Warning: Expecting numeric in D32647 / R32647C4: got 'n.a.'
## Warning: Expecting numeric in D32648 / R32648C4: got 'n.a.'
## Warning: Expecting numeric in D32649 / R32649C4: got 'n.a.'
## Warning: Expecting numeric in D32650 / R32650C4: got 'n.a.'
## Warning: Expecting numeric in D32651 / R32651C4: got 'n.a.'
## Warning: Expecting numeric in D32652 / R32652C4: got 'n.a.'
## Warning: Expecting numeric in D32653 / R32653C4: got 'n.a.'
## Warning: Expecting numeric in D32654 / R32654C4: got 'n.a.'
## Warning: Expecting numeric in D32655 / R32655C4: got 'n.a.'
## Warning: Expecting numeric in D32656 / R32656C4: got 'n.a.'
## Warning: Expecting numeric in D32657 / R32657C4: got 'n.a.'
## Warning: Expecting numeric in D32658 / R32658C4: got 'n.a.'
## Warning: Expecting numeric in D32659 / R32659C4: got 'n.a.'
## Warning: Expecting numeric in D32660 / R32660C4: got 'n.a.'
## Warning: Expecting numeric in D32661 / R32661C4: got 'n.a.'
## Warning: Expecting numeric in D32662 / R32662C4: got 'n.a.'
## Warning: Expecting numeric in D32663 / R32663C4: got 'n.a.'
## Warning: Expecting numeric in D32664 / R32664C4: got 'n.a.'
## Warning: Expecting numeric in D32665 / R32665C4: got 'n.a.'
## Warning: Expecting numeric in D32666 / R32666C4: got 'n.a.'
## Warning: Expecting numeric in D32667 / R32667C4: got 'n.a.'
## Warning: Expecting numeric in D32668 / R32668C4: got 'n.a.'
## Warning: Expecting numeric in D32669 / R32669C4: got 'n.a.'
## Warning: Expecting numeric in D32670 / R32670C4: got 'n.a.'
## Warning: Expecting numeric in D32671 / R32671C4: got 'n.a.'
## Warning: Expecting numeric in D32672 / R32672C4: got 'n.a.'
## Warning: Expecting numeric in D32673 / R32673C4: got 'n.a.'
## Warning: Expecting numeric in D32674 / R32674C4: got 'n.a.'
## Warning: Expecting numeric in D32675 / R32675C4: got 'n.a.'
## Warning: Expecting numeric in D32676 / R32676C4: got 'n.a.'
## Warning: Expecting numeric in D32677 / R32677C4: got 'n.a.'
## Warning: Expecting numeric in D32678 / R32678C4: got 'n.a.'
## Warning: Expecting numeric in D32679 / R32679C4: got 'n.a.'
## Warning: Expecting numeric in D32680 / R32680C4: got 'n.a.'
## Warning: Expecting numeric in D32681 / R32681C4: got 'n.a.'
## Warning: Expecting numeric in D32682 / R32682C4: got 'n.a.'
## Warning: Expecting numeric in D32683 / R32683C4: got 'n.a.'
## Warning: Expecting numeric in D32684 / R32684C4: got 'n.a.'
## Warning: Expecting numeric in D32685 / R32685C4: got 'n.a.'
## Warning: Expecting numeric in D32686 / R32686C4: got 'n.a.'
## Warning: Expecting numeric in D32687 / R32687C4: got 'n.a.'
## Warning: Expecting numeric in D32688 / R32688C4: got 'n.a.'
## Warning: Expecting numeric in D32689 / R32689C4: got 'n.a.'
## Warning: Expecting numeric in D32690 / R32690C4: got 'n.a.'
## Warning: Expecting numeric in D32691 / R32691C4: got 'n.a.'
## Warning: Expecting numeric in D32692 / R32692C4: got 'n.a.'
## Warning: Expecting numeric in D32693 / R32693C4: got 'n.a.'
## Warning: Expecting numeric in D32694 / R32694C4: got 'n.a.'
## Warning: Expecting numeric in D32695 / R32695C4: got 'n.a.'
## Warning: Expecting numeric in D32696 / R32696C4: got 'n.a.'
## Warning: Expecting numeric in D32697 / R32697C4: got 'n.a.'
## Warning: Expecting numeric in D32698 / R32698C4: got 'n.a.'
## Warning: Expecting numeric in D32699 / R32699C4: got 'n.a.'
## Warning: Expecting numeric in D32700 / R32700C4: got 'n.a.'
## Warning: Expecting numeric in D32701 / R32701C4: got 'n.a.'
## Warning: Expecting numeric in D32702 / R32702C4: got 'n.a.'
## Warning: Expecting numeric in D32703 / R32703C4: got 'n.a.'
## Warning: Expecting numeric in D32704 / R32704C4: got 'n.a.'
## Warning: Expecting numeric in D32705 / R32705C4: got 'n.a.'
## Warning: Expecting numeric in D32706 / R32706C4: got 'n.a.'
## Warning: Expecting numeric in D32707 / R32707C4: got 'n.a.'
## Warning: Expecting numeric in D32708 / R32708C4: got 'n.a.'
## Warning: Expecting numeric in D32709 / R32709C4: got 'n.a.'
## Warning: Expecting numeric in D32710 / R32710C4: got 'n.a.'
## Warning: Expecting numeric in D32711 / R32711C4: got 'n.a.'
## Warning: Expecting numeric in D32712 / R32712C4: got 'n.a.'
## Warning: Expecting numeric in D32713 / R32713C4: got 'n.a.'
## Warning: Expecting numeric in D32714 / R32714C4: got 'n.a.'
## Warning: Expecting numeric in D32715 / R32715C4: got 'n.a.'
## Warning: Expecting numeric in D32716 / R32716C4: got 'n.a.'
## Warning: Expecting numeric in D32717 / R32717C4: got 'n.a.'
## Warning: Expecting numeric in D32718 / R32718C4: got 'n.a.'
## Warning: Expecting numeric in D32719 / R32719C4: got 'n.a.'
## Warning: Expecting numeric in D32720 / R32720C4: got 'n.a.'
## Warning: Expecting numeric in D32721 / R32721C4: got 'n.a.'
## Warning: Expecting numeric in D32722 / R32722C4: got 'n.a.'
## Warning: Expecting numeric in D32723 / R32723C4: got 'n.a.'
## Warning: Expecting numeric in D32724 / R32724C4: got 'n.a.'
## Warning: Expecting numeric in D32725 / R32725C4: got 'n.a.'
## Warning: Expecting numeric in D32726 / R32726C4: got 'n.a.'
## Warning: Expecting numeric in D32727 / R32727C4: got 'n.a.'
## Warning: Expecting numeric in D32728 / R32728C4: got 'n.a.'
## Warning: Expecting numeric in D32729 / R32729C4: got 'n.a.'
## Warning: Expecting numeric in D32730 / R32730C4: got 'n.a.'
## Warning: Expecting numeric in D32731 / R32731C4: got 'n.a.'
## Warning: Expecting numeric in D32732 / R32732C4: got 'n.a.'
## Warning: Expecting numeric in D32733 / R32733C4: got 'n.a.'
## Warning: Expecting numeric in D32734 / R32734C4: got 'n.a.'
## Warning: Expecting numeric in D32735 / R32735C4: got 'n.a.'
## Warning: Expecting numeric in D32736 / R32736C4: got 'n.a.'
## Warning: Expecting numeric in D32737 / R32737C4: got 'n.a.'
## Warning: Expecting numeric in D32738 / R32738C4: got 'n.a.'
## Warning: Expecting numeric in D32739 / R32739C4: got 'n.a.'
## Warning: Expecting numeric in D32740 / R32740C4: got 'n.a.'
## Warning: Expecting numeric in D32741 / R32741C4: got 'n.a.'
## Warning: Expecting numeric in D32742 / R32742C4: got 'n.a.'
## Warning: Expecting numeric in D32743 / R32743C4: got 'n.a.'
## Warning: Expecting numeric in D32744 / R32744C4: got 'n.a.'
## Warning: Expecting numeric in D32745 / R32745C4: got 'n.a.'
## Warning: Expecting numeric in D32746 / R32746C4: got 'n.a.'
## Warning: Expecting numeric in D32747 / R32747C4: got 'n.a.'
## Warning: Expecting numeric in D32748 / R32748C4: got 'n.a.'
## Warning: Expecting numeric in D32749 / R32749C4: got 'n.a.'
## Warning: Expecting numeric in D32750 / R32750C4: got 'n.a.'
## Warning: Expecting numeric in D32751 / R32751C4: got 'n.a.'
## Warning: Expecting numeric in D32752 / R32752C4: got 'n.a.'
## Warning: Expecting numeric in D32753 / R32753C4: got 'n.a.'
## Warning: Expecting numeric in D32754 / R32754C4: got 'n.a.'
## Warning: Expecting numeric in D32755 / R32755C4: got 'n.a.'
## Warning: Expecting numeric in D32756 / R32756C4: got 'n.a.'
## Warning: Expecting numeric in D32757 / R32757C4: got 'n.a.'
## Warning: Expecting numeric in D32758 / R32758C4: got 'n.a.'
## Warning: Expecting numeric in D32759 / R32759C4: got 'n.a.'
## Warning: Expecting numeric in D32760 / R32760C4: got 'n.a.'
## Warning: Expecting numeric in D32761 / R32761C4: got 'n.a.'
## Warning: Expecting numeric in D32762 / R32762C4: got 'n.a.'
## Warning: Expecting numeric in D32763 / R32763C4: got 'n.a.'
## Warning: Expecting numeric in D32764 / R32764C4: got 'n.a.'
## Warning: Expecting numeric in D32765 / R32765C4: got 'n.a.'
## Warning: Expecting numeric in D32766 / R32766C4: got 'n.a.'
## Warning: Expecting numeric in D32767 / R32767C4: got 'n.a.'
## Warning: Expecting numeric in D32768 / R32768C4: got 'n.a.'
## Warning: Expecting numeric in D32769 / R32769C4: got 'n.a.'
## Warning: Expecting numeric in D32770 / R32770C4: got 'n.a.'
## Warning: Expecting numeric in D32771 / R32771C4: got 'n.a.'
## Warning: Expecting numeric in D32772 / R32772C4: got 'n.a.'
## Warning: Expecting numeric in D32773 / R32773C4: got 'n.a.'
## Warning: Expecting numeric in D32774 / R32774C4: got 'n.a.'
## Warning: Expecting numeric in D32775 / R32775C4: got 'n.a.'
## Warning: Expecting numeric in D32776 / R32776C4: got 'n.a.'
## Warning: Expecting numeric in D32777 / R32777C4: got 'n.a.'
## Warning: Expecting numeric in D32778 / R32778C4: got 'n.a.'
## Warning: Expecting numeric in D32779 / R32779C4: got 'n.a.'
## Warning: Expecting numeric in D32780 / R32780C4: got 'n.a.'
## Warning: Expecting numeric in D32781 / R32781C4: got 'n.a.'
## Warning: Expecting numeric in D32782 / R32782C4: got 'n.a.'
## Warning: Expecting numeric in D32783 / R32783C4: got 'n.a.'
## Warning: Expecting numeric in D32784 / R32784C4: got 'n.a.'
## Warning: Expecting numeric in D32785 / R32785C4: got 'n.a.'
## Warning: Expecting numeric in D32786 / R32786C4: got 'n.a.'
## Warning: Expecting numeric in D32787 / R32787C4: got 'n.a.'
## Warning: Expecting numeric in D32788 / R32788C4: got 'n.a.'
## Warning: Expecting numeric in D32789 / R32789C4: got 'n.a.'
## Warning: Expecting numeric in D32790 / R32790C4: got 'n.a.'
## Warning: Expecting numeric in D32791 / R32791C4: got 'n.a.'
## Warning: Expecting numeric in D32792 / R32792C4: got 'n.a.'
## Warning: Expecting numeric in D32793 / R32793C4: got 'n.a.'
## Warning: Expecting numeric in D32794 / R32794C4: got 'n.a.'
## Warning: Expecting numeric in D32795 / R32795C4: got 'n.a.'
## Warning: Expecting numeric in D32796 / R32796C4: got 'n.a.'
## Warning: Expecting numeric in D32797 / R32797C4: got 'n.a.'
## Warning: Expecting numeric in D32798 / R32798C4: got 'n.a.'
## Warning: Expecting numeric in D32799 / R32799C4: got 'n.a.'
## Warning: Expecting numeric in D32800 / R32800C4: got 'n.a.'
## Warning: Expecting numeric in D32801 / R32801C4: got 'n.a.'
## Warning: Expecting numeric in D32802 / R32802C4: got 'n.a.'
## Warning: Expecting numeric in D32803 / R32803C4: got 'n.a.'
## Warning: Expecting numeric in D32804 / R32804C4: got 'n.a.'
## Warning: Expecting numeric in D32805 / R32805C4: got 'n.a.'
## Warning: Expecting numeric in D32806 / R32806C4: got 'n.a.'
## Warning: Expecting numeric in D32807 / R32807C4: got 'n.a.'
## Warning: Expecting numeric in D32808 / R32808C4: got 'n.a.'
## Warning: Expecting numeric in D32809 / R32809C4: got 'n.a.'
## Warning: Expecting numeric in D32810 / R32810C4: got 'n.a.'
## Warning: Expecting numeric in D32811 / R32811C4: got 'n.a.'
## Warning: Expecting numeric in D32812 / R32812C4: got 'n.a.'
## Warning: Expecting numeric in D32813 / R32813C4: got 'n.a.'
## Warning: Expecting numeric in D32814 / R32814C4: got 'n.a.'
## Warning: Expecting numeric in D32815 / R32815C4: got 'n.a.'
## Warning: Expecting numeric in D32816 / R32816C4: got 'n.a.'
## Warning: Expecting numeric in D32817 / R32817C4: got 'n.a.'
## Warning: Expecting numeric in D32818 / R32818C4: got 'n.a.'
## Warning: Expecting numeric in D32819 / R32819C4: got 'n.a.'
## Warning: Expecting numeric in D32820 / R32820C4: got 'n.a.'
## Warning: Expecting numeric in D32821 / R32821C4: got 'n.a.'
## Warning: Expecting numeric in D32822 / R32822C4: got 'n.a.'
## Warning: Expecting numeric in D32823 / R32823C4: got 'n.a.'
## Warning: Expecting numeric in D32824 / R32824C4: got 'n.a.'
## Warning: Expecting numeric in D32825 / R32825C4: got 'n.a.'
## Warning: Expecting numeric in D32826 / R32826C4: got 'n.a.'
## Warning: Expecting numeric in D32827 / R32827C4: got 'n.a.'
## Warning: Expecting numeric in D32828 / R32828C4: got 'n.a.'
## Warning: Expecting numeric in D32829 / R32829C4: got 'n.a.'
## Warning: Expecting numeric in D32830 / R32830C4: got 'n.a.'
## Warning: Expecting numeric in D32831 / R32831C4: got 'n.a.'
## Warning: Expecting numeric in D32832 / R32832C4: got 'n.a.'
## Warning: Expecting numeric in D32833 / R32833C4: got 'n.a.'
## Warning: Expecting numeric in D32834 / R32834C4: got 'n.a.'
## Warning: Expecting numeric in D32835 / R32835C4: got 'n.a.'
## Warning: Expecting numeric in D32836 / R32836C4: got 'n.a.'
## Warning: Expecting numeric in D32837 / R32837C4: got 'n.a.'
## Warning: Expecting numeric in D32838 / R32838C4: got 'n.a.'
## Warning: Expecting numeric in D32839 / R32839C4: got 'n.a.'
## Warning: Expecting numeric in D32840 / R32840C4: got 'n.a.'
## Warning: Expecting numeric in D32841 / R32841C4: got 'n.a.'
## Warning: Expecting numeric in D32842 / R32842C4: got 'n.a.'
## Warning: Expecting numeric in D32843 / R32843C4: got 'n.a.'
## Warning: Expecting numeric in D32844 / R32844C4: got 'n.a.'
## Warning: Expecting numeric in D32845 / R32845C4: got 'n.a.'
## Warning: Expecting numeric in D32846 / R32846C4: got 'n.a.'
## Warning: Expecting numeric in D32847 / R32847C4: got 'n.a.'
## Warning: Expecting numeric in D32848 / R32848C4: got 'n.a.'
## Warning: Expecting numeric in D32849 / R32849C4: got 'n.a.'
## Warning: Expecting numeric in D32850 / R32850C4: got 'n.a.'
## Warning: Expecting numeric in D32851 / R32851C4: got 'n.a.'
## Warning: Expecting numeric in D32852 / R32852C4: got 'n.a.'
## Warning: Expecting numeric in D32853 / R32853C4: got 'n.a.'
## Warning: Expecting numeric in D32854 / R32854C4: got 'n.a.'
## Warning: Expecting numeric in D32855 / R32855C4: got 'n.a.'
## Warning: Expecting numeric in D32856 / R32856C4: got 'n.a.'
## Warning: Expecting numeric in D32857 / R32857C4: got 'n.a.'
## Warning: Expecting numeric in D32858 / R32858C4: got 'n.a.'
## Warning: Expecting numeric in D32859 / R32859C4: got 'n.a.'
## Warning: Expecting numeric in D32860 / R32860C4: got 'n.a.'
## Warning: Expecting numeric in D32861 / R32861C4: got 'n.a.'
## Warning: Expecting numeric in D32862 / R32862C4: got 'n.a.'
## Warning: Expecting numeric in D32863 / R32863C4: got 'n.a.'
## Warning: Expecting numeric in D32864 / R32864C4: got 'n.a.'
## Warning: Expecting numeric in D32865 / R32865C4: got 'n.a.'
## Warning: Expecting numeric in D32866 / R32866C4: got 'n.a.'
## Warning: Expecting numeric in D32867 / R32867C4: got 'n.a.'
## Warning: Expecting numeric in D32868 / R32868C4: got 'n.a.'
## Warning: Expecting numeric in D32869 / R32869C4: got 'n.a.'
## Warning: Expecting numeric in D32870 / R32870C4: got 'n.a.'
## Warning: Expecting numeric in D32871 / R32871C4: got 'n.a.'
## Warning: Expecting numeric in D32872 / R32872C4: got 'n.a.'
## Warning: Expecting numeric in D32873 / R32873C4: got 'n.a.'
## Warning: Expecting numeric in D32874 / R32874C4: got 'n.a.'
## Warning: Expecting numeric in D32875 / R32875C4: got 'n.a.'
## Warning: Expecting numeric in D32876 / R32876C4: got 'n.a.'
## Warning: Expecting numeric in D32877 / R32877C4: got 'n.a.'
## Warning: Expecting numeric in D32878 / R32878C4: got 'n.a.'
## Warning: Expecting numeric in D32879 / R32879C4: got 'n.a.'
## Warning: Expecting numeric in D32880 / R32880C4: got 'n.a.'
## Warning: Expecting numeric in D32881 / R32881C4: got 'n.a.'
## Warning: Expecting numeric in D32882 / R32882C4: got 'n.a.'
## Warning: Expecting numeric in D32883 / R32883C4: got 'n.a.'
## Warning: Expecting numeric in D32884 / R32884C4: got 'n.a.'
## Warning: Expecting numeric in D32885 / R32885C4: got 'n.a.'
## Warning: Expecting numeric in D32886 / R32886C4: got 'n.a.'
## Warning: Expecting numeric in D32887 / R32887C4: got 'n.a.'
## Warning: Expecting numeric in D32888 / R32888C4: got 'n.a.'
## Warning: Expecting numeric in D32889 / R32889C4: got 'n.a.'
## Warning: Expecting numeric in D32890 / R32890C4: got 'n.a.'
## Warning: Expecting numeric in D32891 / R32891C4: got 'n.a.'
## Warning: Expecting numeric in D32892 / R32892C4: got 'n.a.'
## Warning: Expecting numeric in D32893 / R32893C4: got 'n.a.'
## Warning: Expecting numeric in D32894 / R32894C4: got 'n.a.'
## Warning: Expecting numeric in D32895 / R32895C4: got 'n.a.'
## Warning: Expecting numeric in D32896 / R32896C4: got 'n.a.'
## Warning: Expecting numeric in D32897 / R32897C4: got 'n.a.'
## Warning: Expecting numeric in D32898 / R32898C4: got 'n.a.'
## Warning: Expecting numeric in D32899 / R32899C4: got 'n.a.'
## Warning: Expecting numeric in D32900 / R32900C4: got 'n.a.'
## Warning: Expecting numeric in D32901 / R32901C4: got 'n.a.'
## Warning: Expecting numeric in D32902 / R32902C4: got 'n.a.'
## Warning: Expecting numeric in D32903 / R32903C4: got 'n.a.'
## Warning: Expecting numeric in D32904 / R32904C4: got 'n.a.'
## Warning: Expecting numeric in D32905 / R32905C4: got 'n.a.'
## Warning: Expecting numeric in D32906 / R32906C4: got 'n.a.'
## Warning: Expecting numeric in D32907 / R32907C4: got 'n.a.'
## Warning: Expecting numeric in D32908 / R32908C4: got 'n.a.'
## Warning: Expecting numeric in D32909 / R32909C4: got 'n.a.'
## Warning: Expecting numeric in D32910 / R32910C4: got 'n.a.'
## Warning: Expecting numeric in D32911 / R32911C4: got 'n.a.'
## Warning: Expecting numeric in D32912 / R32912C4: got 'n.a.'
## Warning: Expecting numeric in D32913 / R32913C4: got 'n.a.'
## Warning: Expecting numeric in D32914 / R32914C4: got 'n.a.'
## Warning: Expecting numeric in D32915 / R32915C4: got 'n.a.'
## Warning: Expecting numeric in D32916 / R32916C4: got 'n.a.'
## Warning: Expecting numeric in D32917 / R32917C4: got 'n.a.'
## Warning: Expecting numeric in D32918 / R32918C4: got 'n.a.'
## Warning: Expecting numeric in D32919 / R32919C4: got 'n.a.'
## Warning: Expecting numeric in D32920 / R32920C4: got 'n.a.'
## Warning: Expecting numeric in D32921 / R32921C4: got 'n.a.'
## Warning: Expecting numeric in D32922 / R32922C4: got 'n.a.'
## Warning: Expecting numeric in D32923 / R32923C4: got 'n.a.'
## Warning: Expecting numeric in D32924 / R32924C4: got 'n.a.'
## Warning: Expecting numeric in D32925 / R32925C4: got 'n.a.'
## Warning: Expecting numeric in D32926 / R32926C4: got 'n.a.'
## Warning: Expecting numeric in D32927 / R32927C4: got 'n.a.'
## Warning: Expecting numeric in D32928 / R32928C4: got 'n.a.'
## Warning: Expecting numeric in D32929 / R32929C4: got 'n.a.'
## Warning: Expecting numeric in D32930 / R32930C4: got 'n.a.'
## Warning: Expecting numeric in D32931 / R32931C4: got 'n.a.'
## Warning: Expecting numeric in D32932 / R32932C4: got 'n.a.'
## Warning: Expecting numeric in D32933 / R32933C4: got 'n.a.'
## Warning: Expecting numeric in D32934 / R32934C4: got 'n.a.'
## Warning: Expecting numeric in D32935 / R32935C4: got 'n.a.'
## Warning: Expecting numeric in D32936 / R32936C4: got 'n.a.'
## Warning: Expecting numeric in D32937 / R32937C4: got 'n.a.'
## Warning: Expecting numeric in D32938 / R32938C4: got 'n.a.'
## Warning: Expecting numeric in D32939 / R32939C4: got 'n.a.'
## Warning: Expecting numeric in D32940 / R32940C4: got 'n.a.'
## Warning: Expecting numeric in D32941 / R32941C4: got 'n.a.'
## Warning: Expecting numeric in D32942 / R32942C4: got 'n.a.'
## Warning: Expecting numeric in D32943 / R32943C4: got 'n.a.'
## Warning: Expecting numeric in D32944 / R32944C4: got 'n.a.'
## Warning: Expecting numeric in D32945 / R32945C4: got 'n.a.'
## Warning: Expecting numeric in D32946 / R32946C4: got 'n.a.'
## Warning: Expecting numeric in D32947 / R32947C4: got 'n.a.'
## Warning: Expecting numeric in D32948 / R32948C4: got 'n.a.'
## Warning: Expecting numeric in D32949 / R32949C4: got 'n.a.'
## Warning: Expecting numeric in D32950 / R32950C4: got 'n.a.'
## Warning: Expecting numeric in D32951 / R32951C4: got 'n.a.'
## Warning: Expecting numeric in D32952 / R32952C4: got 'n.a.'
## Warning: Expecting numeric in D32953 / R32953C4: got 'n.a.'
## Warning: Expecting numeric in D32954 / R32954C4: got 'n.a.'
## Warning: Expecting numeric in D32955 / R32955C4: got 'n.a.'
## Warning: Expecting numeric in D32956 / R32956C4: got 'n.a.'
## Warning: Expecting numeric in D32957 / R32957C4: got 'n.a.'
## Warning: Expecting numeric in D32958 / R32958C4: got 'n.a.'
## Warning: Expecting numeric in D32959 / R32959C4: got 'n.a.'
## Warning: Expecting numeric in D32960 / R32960C4: got 'n.a.'
## Warning: Expecting numeric in D32961 / R32961C4: got 'n.a.'
## Warning: Expecting numeric in D32962 / R32962C4: got 'n.a.'
## Warning: Expecting numeric in D32963 / R32963C4: got 'n.a.'
## Warning: Expecting numeric in D32964 / R32964C4: got 'n.a.'
## Warning: Expecting numeric in D32965 / R32965C4: got 'n.a.'
## Warning: Expecting numeric in D32966 / R32966C4: got 'n.a.'
## Warning: Expecting numeric in D32967 / R32967C4: got 'n.a.'
## Warning: Expecting numeric in D32968 / R32968C4: got 'n.a.'
## Warning: Expecting numeric in D32969 / R32969C4: got 'n.a.'
## Warning: Expecting numeric in D32970 / R32970C4: got 'n.a.'
## Warning: Expecting numeric in D32971 / R32971C4: got 'n.a.'
## Warning: Expecting numeric in D32972 / R32972C4: got 'n.a.'
## Warning: Expecting numeric in D32973 / R32973C4: got 'n.a.'
## Warning: Expecting numeric in D32974 / R32974C4: got 'n.a.'
## Warning: Expecting numeric in D32975 / R32975C4: got 'n.a.'
## Warning: Expecting numeric in D32976 / R32976C4: got 'n.a.'
## Warning: Expecting numeric in D32977 / R32977C4: got 'n.a.'
## Warning: Expecting numeric in D32978 / R32978C4: got 'n.a.'
## Warning: Expecting numeric in D32979 / R32979C4: got 'n.a.'
## Warning: Expecting numeric in D32980 / R32980C4: got 'n.a.'
## Warning: Expecting numeric in D32981 / R32981C4: got 'n.a.'
## Warning: Expecting numeric in D32982 / R32982C4: got 'n.a.'
## Warning: Expecting numeric in D32983 / R32983C4: got 'n.a.'
## Warning: Expecting numeric in D32984 / R32984C4: got 'n.a.'
## Warning: Expecting numeric in D32985 / R32985C4: got 'n.a.'
## Warning: Expecting numeric in D32986 / R32986C4: got 'n.a.'
## Warning: Expecting numeric in D32987 / R32987C4: got 'n.a.'
## Warning: Expecting numeric in D32988 / R32988C4: got 'n.a.'
## Warning: Expecting numeric in D32989 / R32989C4: got 'n.a.'
## Warning: Expecting numeric in D32990 / R32990C4: got 'n.a.'
## Warning: Expecting numeric in D32991 / R32991C4: got 'n.a.'
## Warning: Expecting numeric in D32992 / R32992C4: got 'n.a.'
## Warning: Expecting numeric in D32993 / R32993C4: got 'n.a.'
## Warning: Expecting numeric in D32994 / R32994C4: got 'n.a.'
## Warning: Expecting numeric in D32995 / R32995C4: got 'n.a.'
## Warning: Expecting numeric in D32996 / R32996C4: got 'n.a.'
## Warning: Expecting numeric in D32997 / R32997C4: got 'n.a.'
## Warning: Expecting numeric in D32998 / R32998C4: got 'n.a.'
## Warning: Expecting numeric in D32999 / R32999C4: got 'n.a.'
## Warning: Expecting numeric in D33000 / R33000C4: got 'n.a.'
## Warning: Expecting numeric in D33001 / R33001C4: got 'n.a.'
## Warning: Expecting numeric in D33002 / R33002C4: got 'n.a.'
## Warning: Expecting numeric in D33003 / R33003C4: got 'n.a.'
## Warning: Expecting numeric in D33004 / R33004C4: got 'n.a.'
## Warning: Expecting numeric in D33005 / R33005C4: got 'n.a.'
## Warning: Expecting numeric in D33006 / R33006C4: got 'n.a.'
## Warning: Expecting numeric in D33007 / R33007C4: got 'n.a.'
## Warning: Expecting numeric in D33008 / R33008C4: got 'n.a.'
## Warning: Expecting numeric in D33009 / R33009C4: got 'n.a.'
## Warning: Expecting numeric in D33010 / R33010C4: got 'n.a.'
## Warning: Expecting numeric in D33011 / R33011C4: got 'n.a.'
## Warning: Expecting numeric in D33012 / R33012C4: got 'n.a.'
## Warning: Expecting numeric in D33013 / R33013C4: got 'n.a.'
## Warning: Expecting numeric in D33014 / R33014C4: got 'n.a.'
## Warning: Expecting numeric in D33015 / R33015C4: got 'n.a.'
## Warning: Expecting numeric in D33016 / R33016C4: got 'n.a.'
## Warning: Expecting numeric in D33017 / R33017C4: got 'n.a.'
## Warning: Expecting numeric in D33018 / R33018C4: got 'n.a.'
## Warning: Expecting numeric in D33019 / R33019C4: got 'n.a.'
## Warning: Expecting numeric in D33020 / R33020C4: got 'n.a.'
## Warning: Expecting numeric in D33021 / R33021C4: got 'n.a.'
## Warning: Expecting numeric in D33022 / R33022C4: got 'n.a.'
## Warning: Expecting numeric in D33023 / R33023C4: got 'n.a.'
## Warning: Expecting numeric in D33024 / R33024C4: got 'n.a.'
## Warning: Expecting numeric in D33025 / R33025C4: got 'n.a.'
## Warning: Expecting numeric in D33026 / R33026C4: got 'n.a.'
## Warning: Expecting numeric in D33027 / R33027C4: got 'n.a.'
## Warning: Expecting numeric in D33028 / R33028C4: got 'n.a.'
## Warning: Expecting numeric in D33029 / R33029C4: got 'n.a.'
## Warning: Expecting numeric in D33030 / R33030C4: got 'n.a.'
## Warning: Expecting numeric in D33031 / R33031C4: got 'n.a.'
## Warning: Expecting numeric in D33032 / R33032C4: got 'n.a.'
## Warning: Expecting numeric in D33033 / R33033C4: got 'n.a.'
## Warning: Expecting numeric in D33034 / R33034C4: got 'n.a.'
## Warning: Expecting numeric in D33035 / R33035C4: got 'n.a.'
## Warning: Expecting numeric in D33036 / R33036C4: got 'n.a.'
## Warning: Expecting numeric in D33037 / R33037C4: got 'n.a.'
## Warning: Expecting numeric in D33038 / R33038C4: got 'n.a.'
## Warning: Expecting numeric in D33039 / R33039C4: got 'n.a.'
## Warning: Expecting numeric in D33040 / R33040C4: got 'n.a.'
## Warning: Expecting numeric in D33041 / R33041C4: got 'n.a.'
## Warning: Expecting numeric in D33042 / R33042C4: got 'n.a.'
## Warning: Expecting numeric in D33043 / R33043C4: got 'n.a.'
## Warning: Expecting numeric in D33044 / R33044C4: got 'n.a.'
## Warning: Expecting numeric in D33045 / R33045C4: got 'n.a.'
## Warning: Expecting numeric in D33046 / R33046C4: got 'n.a.'
## Warning: Expecting numeric in D33047 / R33047C4: got 'n.a.'
## Warning: Expecting numeric in D33048 / R33048C4: got 'n.a.'
## Warning: Expecting numeric in D33049 / R33049C4: got 'n.a.'
## Warning: Expecting numeric in D33050 / R33050C4: got 'n.a.'
## Warning: Expecting numeric in D33051 / R33051C4: got 'n.a.'
## Warning: Expecting numeric in D33052 / R33052C4: got 'n.a.'
## Warning: Expecting numeric in D33053 / R33053C4: got 'n.a.'
## Warning: Expecting numeric in D33054 / R33054C4: got 'n.a.'
## Warning: Expecting numeric in D33055 / R33055C4: got 'n.a.'
## Warning: Expecting numeric in D33056 / R33056C4: got 'n.a.'
## Warning: Expecting numeric in D33057 / R33057C4: got 'n.a.'
## Warning: Expecting numeric in D33058 / R33058C4: got 'n.a.'
## Warning: Expecting numeric in D33059 / R33059C4: got 'n.a.'
## Warning: Expecting numeric in D33060 / R33060C4: got 'n.a.'
## Warning: Expecting numeric in D33061 / R33061C4: got 'n.a.'
## Warning: Expecting numeric in D33062 / R33062C4: got 'n.a.'
## Warning: Expecting numeric in D33063 / R33063C4: got 'n.a.'
## Warning: Expecting numeric in D33064 / R33064C4: got 'n.a.'
## Warning: Expecting numeric in D33065 / R33065C4: got 'n.a.'
## Warning: Expecting numeric in D33066 / R33066C4: got 'n.a.'
## Warning: Expecting numeric in D33067 / R33067C4: got 'n.a.'
## Warning: Expecting numeric in D33068 / R33068C4: got 'n.a.'
## Warning: Expecting numeric in D33069 / R33069C4: got 'n.a.'
## Warning: Expecting numeric in D33070 / R33070C4: got 'n.a.'
## Warning: Expecting numeric in D33071 / R33071C4: got 'n.a.'
## Warning: Expecting numeric in D33072 / R33072C4: got 'n.a.'
## Warning: Expecting numeric in D33073 / R33073C4: got 'n.a.'
## Warning: Expecting numeric in D33074 / R33074C4: got 'n.a.'
## Warning: Expecting numeric in D33075 / R33075C4: got 'n.a.'
## Warning: Expecting numeric in D33076 / R33076C4: got 'n.a.'
## Warning: Expecting numeric in D33077 / R33077C4: got 'n.a.'
## Warning: Expecting numeric in D33078 / R33078C4: got 'n.a.'
## Warning: Expecting numeric in D33079 / R33079C4: got 'n.a.'
## Warning: Expecting numeric in D33080 / R33080C4: got 'n.a.'
## Warning: Expecting numeric in D33081 / R33081C4: got 'n.a.'
## Warning: Expecting numeric in D33082 / R33082C4: got 'n.a.'
## Warning: Expecting numeric in D33083 / R33083C4: got 'n.a.'
## Warning: Expecting numeric in D33084 / R33084C4: got 'n.a.'
## Warning: Expecting numeric in D33085 / R33085C4: got 'n.a.'
## Warning: Expecting numeric in D33086 / R33086C4: got 'n.a.'
## Warning: Expecting numeric in D33087 / R33087C4: got 'n.a.'
## Warning: Expecting numeric in D33088 / R33088C4: got 'n.a.'
## Warning: Expecting numeric in D33089 / R33089C4: got 'n.a.'
## Warning: Expecting numeric in D33090 / R33090C4: got 'n.a.'
## Warning: Expecting numeric in D33091 / R33091C4: got 'n.a.'
## Warning: Expecting numeric in D33092 / R33092C4: got 'n.a.'
## Warning: Expecting numeric in D33093 / R33093C4: got 'n.a.'
## Warning: Expecting numeric in D33094 / R33094C4: got 'n.a.'
## Warning: Expecting numeric in D33095 / R33095C4: got 'n.a.'
## Warning: Expecting numeric in D33096 / R33096C4: got 'n.a.'
## Warning: Expecting numeric in D33097 / R33097C4: got 'n.a.'
## Warning: Expecting numeric in D33098 / R33098C4: got 'n.a.'
## Warning: Expecting numeric in D33099 / R33099C4: got 'n.a.'
## Warning: Expecting numeric in D33100 / R33100C4: got 'n.a.'
## Warning: Expecting numeric in D33101 / R33101C4: got 'n.a.'
## Warning: Expecting numeric in D33102 / R33102C4: got 'n.a.'
## Warning: Expecting numeric in D33103 / R33103C4: got 'n.a.'
## Warning: Expecting numeric in D33104 / R33104C4: got 'n.a.'
## Warning: Expecting numeric in D33105 / R33105C4: got 'n.a.'
## Warning: Expecting numeric in D33106 / R33106C4: got 'n.a.'
## Warning: Expecting numeric in D33107 / R33107C4: got 'n.a.'
## Warning: Expecting numeric in D33108 / R33108C4: got 'n.a.'
## Warning: Expecting numeric in D33109 / R33109C4: got 'n.a.'
## Warning: Expecting numeric in D33110 / R33110C4: got 'n.a.'
## Warning: Expecting numeric in D33111 / R33111C4: got 'n.a.'
## Warning: Expecting numeric in D33112 / R33112C4: got 'n.a.'
## Warning: Expecting numeric in D33113 / R33113C4: got 'n.a.'
## Warning: Expecting numeric in D33114 / R33114C4: got 'n.a.'
## Warning: Expecting numeric in D33115 / R33115C4: got 'n.a.'
## Warning: Expecting numeric in D33116 / R33116C4: got 'n.a.'
## Warning: Expecting numeric in D33117 / R33117C4: got 'n.a.'
## Warning: Expecting numeric in D33118 / R33118C4: got 'n.a.'
## Warning: Expecting numeric in D33119 / R33119C4: got 'n.a.'
## Warning: Expecting numeric in D33120 / R33120C4: got 'n.a.'
## Warning: Expecting numeric in D33121 / R33121C4: got 'n.a.'
## Warning: Expecting numeric in D33122 / R33122C4: got 'n.a.'
## Warning: Expecting numeric in D33123 / R33123C4: got 'n.a.'
## Warning: Expecting numeric in D33124 / R33124C4: got 'n.a.'
## Warning: Expecting numeric in D33125 / R33125C4: got 'n.a.'
## Warning: Expecting numeric in D33126 / R33126C4: got 'n.a.'
## Warning: Expecting numeric in D33127 / R33127C4: got 'n.a.'
## Warning: Expecting numeric in D33128 / R33128C4: got 'n.a.'
## Warning: Expecting numeric in D33129 / R33129C4: got 'n.a.'
## Warning: Expecting numeric in D33130 / R33130C4: got 'n.a.'
## Warning: Expecting numeric in D33131 / R33131C4: got 'n.a.'
## Warning: Expecting numeric in D33132 / R33132C4: got 'n.a.'
## Warning: Expecting numeric in D33133 / R33133C4: got 'n.a.'
## Warning: Expecting numeric in D33134 / R33134C4: got 'n.a.'
## Warning: Expecting numeric in D33135 / R33135C4: got 'n.a.'
## Warning: Expecting numeric in D33136 / R33136C4: got 'n.a.'
## Warning: Expecting numeric in D33137 / R33137C4: got 'n.a.'
## Warning: Expecting numeric in D33138 / R33138C4: got 'n.a.'
## Warning: Expecting numeric in D33139 / R33139C4: got 'n.a.'
## Warning: Expecting numeric in D33140 / R33140C4: got 'n.a.'
## Warning: Expecting numeric in D33141 / R33141C4: got 'n.a.'
## Warning: Expecting numeric in D33142 / R33142C4: got 'n.a.'
## Warning: Expecting numeric in D33143 / R33143C4: got 'n.a.'
## Warning: Expecting numeric in D33144 / R33144C4: got 'n.a.'
## Warning: Expecting numeric in D33145 / R33145C4: got 'n.a.'
## Warning: Expecting numeric in D33146 / R33146C4: got 'n.a.'
## Warning: Expecting numeric in D33147 / R33147C4: got 'n.a.'
## Warning: Expecting numeric in D33148 / R33148C4: got 'n.a.'
## Warning: Expecting numeric in D33149 / R33149C4: got 'n.a.'
## Warning: Expecting numeric in D33150 / R33150C4: got 'n.a.'
## Warning: Expecting numeric in D33151 / R33151C4: got 'n.a.'
## Warning: Expecting numeric in D33152 / R33152C4: got 'n.a.'
## Warning: Expecting numeric in D33153 / R33153C4: got 'n.a.'
## Warning: Expecting numeric in D33154 / R33154C4: got 'n.a.'
## Warning: Expecting numeric in D33155 / R33155C4: got 'n.a.'
## Warning: Expecting numeric in D33156 / R33156C4: got 'n.a.'
## Warning: Expecting numeric in D33157 / R33157C4: got 'n.a.'
## Warning: Expecting numeric in D33158 / R33158C4: got 'n.a.'
## Warning: Expecting numeric in D33159 / R33159C4: got 'n.a.'
## Warning: Expecting numeric in D33160 / R33160C4: got 'n.a.'
## Warning: Expecting numeric in D33161 / R33161C4: got 'n.a.'
## Warning: Expecting numeric in D33162 / R33162C4: got 'n.a.'
## Warning: Expecting numeric in D33163 / R33163C4: got 'n.a.'
## Warning: Expecting numeric in D33164 / R33164C4: got 'n.a.'
## Warning: Expecting numeric in D33165 / R33165C4: got 'n.a.'
## Warning: Expecting numeric in D33166 / R33166C4: got 'n.a.'
## Warning: Expecting numeric in D33167 / R33167C4: got 'n.a.'
## Warning: Expecting numeric in D33168 / R33168C4: got 'n.a.'
## Warning: Expecting numeric in D33169 / R33169C4: got 'n.a.'
## Warning: Expecting numeric in D33170 / R33170C4: got 'n.a.'
## Warning: Expecting numeric in D33171 / R33171C4: got 'n.a.'
## Warning: Expecting numeric in D33172 / R33172C4: got 'n.a.'
## Warning: Expecting numeric in D33173 / R33173C4: got 'n.a.'
## Warning: Expecting numeric in D33174 / R33174C4: got 'n.a.'
## Warning: Expecting numeric in D33175 / R33175C4: got 'n.a.'
## Warning: Expecting numeric in D33176 / R33176C4: got 'n.a.'
## Warning: Expecting numeric in D33177 / R33177C4: got 'n.a.'
## Warning: Expecting numeric in D33178 / R33178C4: got 'n.a.'
## Warning: Expecting numeric in D33179 / R33179C4: got 'n.a.'
## Warning: Expecting numeric in D33180 / R33180C4: got 'n.a.'
## Warning: Expecting numeric in D33181 / R33181C4: got 'n.a.'
## Warning: Expecting numeric in D33182 / R33182C4: got 'n.a.'
## Warning: Expecting numeric in D33183 / R33183C4: got 'n.a.'
## Warning: Expecting numeric in D33184 / R33184C4: got 'n.a.'
## Warning: Expecting numeric in D33185 / R33185C4: got 'n.a.'
## Warning: Expecting numeric in D33186 / R33186C4: got 'n.a.'
## Warning: Expecting numeric in D33187 / R33187C4: got 'n.a.'
## Warning: Expecting numeric in D33188 / R33188C4: got 'n.a.'
## Warning: Expecting numeric in D33189 / R33189C4: got 'n.a.'
## Warning: Expecting numeric in D33190 / R33190C4: got 'n.a.'
## Warning: Expecting numeric in D33191 / R33191C4: got 'n.a.'
## Warning: Expecting numeric in D33192 / R33192C4: got 'n.a.'
## Warning: Expecting numeric in D33193 / R33193C4: got 'n.a.'
## Warning: Expecting numeric in D33194 / R33194C4: got 'n.a.'
## Warning: Expecting numeric in D33195 / R33195C4: got 'n.a.'
## Warning: Expecting numeric in D33196 / R33196C4: got 'n.a.'
## Warning: Expecting numeric in D33197 / R33197C4: got 'n.a.'
## Warning: Expecting numeric in D33198 / R33198C4: got 'n.a.'
## Warning: Expecting numeric in D33199 / R33199C4: got 'n.a.'
## Warning: Expecting numeric in D33200 / R33200C4: got 'n.a.'
## Warning: Expecting numeric in D33201 / R33201C4: got 'n.a.'
## Warning: Expecting numeric in D33202 / R33202C4: got 'n.a.'
## Warning: Expecting numeric in D33203 / R33203C4: got 'n.a.'
## Warning: Expecting numeric in D33204 / R33204C4: got 'n.a.'
## Warning: Expecting numeric in D33205 / R33205C4: got 'n.a.'
## Warning: Expecting numeric in D33206 / R33206C4: got 'n.a.'
## Warning: Expecting numeric in D33207 / R33207C4: got 'n.a.'
## Warning: Expecting numeric in D33208 / R33208C4: got 'n.a.'
## Warning: Expecting numeric in D33209 / R33209C4: got 'n.a.'
## Warning: Expecting numeric in D33210 / R33210C4: got 'n.a.'
## Warning: Expecting numeric in D33211 / R33211C4: got 'n.a.'
## Warning: Expecting numeric in D33212 / R33212C4: got 'n.a.'
## Warning: Expecting numeric in D33213 / R33213C4: got 'n.a.'
## Warning: Expecting numeric in D33214 / R33214C4: got 'n.a.'
## Warning: Expecting numeric in D33215 / R33215C4: got 'n.a.'
## Warning: Expecting numeric in D33216 / R33216C4: got 'n.a.'
## Warning: Expecting numeric in D33217 / R33217C4: got 'n.a.'
## Warning: Expecting numeric in D33218 / R33218C4: got 'n.a.'
## Warning: Expecting numeric in D33219 / R33219C4: got 'n.a.'
## Warning: Expecting numeric in D33220 / R33220C4: got 'n.a.'
## Warning: Expecting numeric in D33221 / R33221C4: got 'n.a.'
## Warning: Expecting numeric in D33222 / R33222C4: got 'n.a.'
## Warning: Expecting numeric in D33223 / R33223C4: got 'n.a.'
## Warning: Expecting numeric in D33224 / R33224C4: got 'n.a.'
## Warning: Expecting numeric in D33225 / R33225C4: got 'n.a.'
## Warning: Expecting numeric in D33226 / R33226C4: got 'n.a.'
## Warning: Expecting numeric in D33227 / R33227C4: got 'n.a.'
## Warning: Expecting numeric in D33228 / R33228C4: got 'n.a.'
## Warning: Expecting numeric in D33229 / R33229C4: got 'n.a.'
## Warning: Expecting numeric in D33230 / R33230C4: got 'n.a.'
## Warning: Expecting numeric in D33231 / R33231C4: got 'n.a.'
## Warning: Expecting numeric in D33232 / R33232C4: got 'n.a.'
## Warning: Expecting numeric in D33233 / R33233C4: got 'n.a.'
## Warning: Expecting numeric in D33234 / R33234C4: got 'n.a.'
## Warning: Expecting numeric in D33235 / R33235C4: got 'n.a.'
## Warning: Expecting numeric in D33236 / R33236C4: got 'n.a.'
## Warning: Expecting numeric in D33237 / R33237C4: got 'n.a.'
## Warning: Expecting numeric in D33238 / R33238C4: got 'n.a.'
## Warning: Expecting numeric in D33239 / R33239C4: got 'n.a.'
## Warning: Expecting numeric in D33240 / R33240C4: got 'n.a.'
## Warning: Expecting numeric in D33241 / R33241C4: got 'n.a.'
## Warning: Expecting numeric in D33242 / R33242C4: got 'n.a.'
## Warning: Expecting numeric in D33243 / R33243C4: got 'n.a.'
## Warning: Expecting numeric in D33244 / R33244C4: got 'n.a.'
## Warning: Expecting numeric in D33245 / R33245C4: got 'n.a.'
## Warning: Expecting numeric in D33246 / R33246C4: got 'n.a.'
## Warning: Expecting numeric in D33247 / R33247C4: got 'n.a.'
## Warning: Expecting numeric in D33248 / R33248C4: got 'n.a.'
## Warning: Expecting numeric in D33249 / R33249C4: got 'n.a.'
## Warning: Expecting numeric in D33250 / R33250C4: got 'n.a.'
## Warning: Expecting numeric in D33251 / R33251C4: got 'n.a.'
## Warning: Expecting numeric in D33252 / R33252C4: got 'n.a.'
## Warning: Expecting numeric in D33253 / R33253C4: got 'n.a.'
## Warning: Expecting numeric in D33254 / R33254C4: got 'n.a.'
## Warning: Expecting numeric in D33255 / R33255C4: got 'n.a.'
## Warning: Expecting numeric in D33256 / R33256C4: got 'n.a.'
## Warning: Expecting numeric in D33257 / R33257C4: got 'n.a.'
## Warning: Expecting numeric in D33258 / R33258C4: got 'n.a.'
## Warning: Expecting numeric in D33259 / R33259C4: got 'n.a.'
## Warning: Expecting numeric in D33260 / R33260C4: got 'n.a.'
## Warning: Expecting numeric in D33261 / R33261C4: got 'n.a.'
## Warning: Expecting numeric in D33262 / R33262C4: got 'n.a.'
## Warning: Expecting numeric in D33263 / R33263C4: got 'n.a.'
## Warning: Expecting numeric in D33264 / R33264C4: got 'n.a.'
## Warning: Expecting numeric in D33265 / R33265C4: got 'n.a.'
## Warning: Expecting numeric in D33266 / R33266C4: got 'n.a.'
## Warning: Expecting numeric in D33267 / R33267C4: got 'n.a.'
## Warning: Expecting numeric in D33268 / R33268C4: got 'n.a.'
## Warning: Expecting numeric in D33269 / R33269C4: got 'n.a.'
## Warning: Expecting numeric in D33270 / R33270C4: got 'n.a.'
## Warning: Expecting numeric in D33271 / R33271C4: got 'n.a.'
## Warning: Expecting numeric in D33272 / R33272C4: got 'n.a.'
## Warning: Expecting numeric in D33273 / R33273C4: got 'n.a.'
## Warning: Expecting numeric in D33274 / R33274C4: got 'n.a.'
## Warning: Expecting numeric in D33275 / R33275C4: got 'n.a.'
## Warning: Expecting numeric in D33276 / R33276C4: got 'n.a.'
## Warning: Expecting numeric in D33277 / R33277C4: got 'n.a.'
## Warning: Expecting numeric in D33278 / R33278C4: got 'n.a.'
## Warning: Expecting numeric in D33279 / R33279C4: got 'n.a.'
## Warning: Expecting numeric in D33280 / R33280C4: got 'n.a.'
## Warning: Expecting numeric in D33281 / R33281C4: got 'n.a.'
## Warning: Expecting numeric in D33282 / R33282C4: got 'n.a.'
## Warning: Expecting numeric in D33283 / R33283C4: got 'n.a.'
## Warning: Expecting numeric in D33284 / R33284C4: got 'n.a.'
## Warning: Expecting numeric in D33285 / R33285C4: got 'n.a.'
## Warning: Expecting numeric in D33286 / R33286C4: got 'n.a.'
## Warning: Expecting numeric in D33287 / R33287C4: got 'n.a.'
## Warning: Expecting numeric in D33288 / R33288C4: got 'n.a.'
## Warning: Expecting numeric in D33289 / R33289C4: got 'n.a.'
## Warning: Expecting numeric in D33290 / R33290C4: got 'n.a.'
## Warning: Expecting numeric in D33291 / R33291C4: got 'n.a.'
## Warning: Expecting numeric in D33292 / R33292C4: got 'n.a.'
## Warning: Expecting numeric in D33293 / R33293C4: got 'n.a.'
## Warning: Expecting numeric in D33294 / R33294C4: got 'n.a.'
## Warning: Expecting numeric in D33295 / R33295C4: got 'n.a.'
## Warning: Expecting numeric in D33296 / R33296C4: got 'n.a.'
## Warning: Expecting numeric in D33297 / R33297C4: got 'n.a.'
## Warning: Expecting numeric in D33298 / R33298C4: got 'n.a.'
## Warning: Expecting numeric in D33299 / R33299C4: got 'n.a.'
## Warning: Expecting numeric in D33300 / R33300C4: got 'n.a.'
## Warning: Expecting numeric in D33301 / R33301C4: got 'n.a.'
## Warning: Expecting numeric in D33302 / R33302C4: got 'n.a.'
## Warning: Expecting numeric in D33303 / R33303C4: got 'n.a.'
## Warning: Expecting numeric in D33304 / R33304C4: got 'n.a.'
## Warning: Expecting numeric in D33305 / R33305C4: got 'n.a.'
## Warning: Expecting numeric in D33306 / R33306C4: got 'n.a.'
## Warning: Expecting numeric in D33307 / R33307C4: got 'n.a.'
## Warning: Expecting numeric in D33308 / R33308C4: got 'n.a.'
## Warning: Expecting numeric in D33309 / R33309C4: got 'n.a.'
## Warning: Expecting numeric in D33310 / R33310C4: got 'n.a.'
## Warning: Expecting numeric in D33311 / R33311C4: got 'n.a.'
## Warning: Expecting numeric in D33312 / R33312C4: got 'n.a.'
## Warning: Expecting numeric in D33313 / R33313C4: got 'n.a.'
## Warning: Expecting numeric in D33314 / R33314C4: got 'n.a.'
## Warning: Expecting numeric in D33315 / R33315C4: got 'n.a.'
## Warning: Expecting numeric in D33316 / R33316C4: got 'n.a.'
## Warning: Expecting numeric in D33317 / R33317C4: got 'n.a.'
## Warning: Expecting numeric in D33318 / R33318C4: got 'n.a.'
## Warning: Expecting numeric in D33319 / R33319C4: got 'n.a.'
## Warning: Expecting numeric in D33320 / R33320C4: got 'n.a.'
## Warning: Expecting numeric in D33321 / R33321C4: got 'n.a.'
## Warning: Expecting numeric in D33322 / R33322C4: got 'n.a.'
## Warning: Expecting numeric in D33323 / R33323C4: got 'n.a.'
## Warning: Expecting numeric in D33324 / R33324C4: got 'n.a.'
## Warning: Expecting numeric in D33325 / R33325C4: got 'n.a.'
## Warning: Expecting numeric in D33326 / R33326C4: got 'n.a.'
## Warning: Expecting numeric in D33327 / R33327C4: got 'n.a.'
## Warning: Expecting numeric in D33328 / R33328C4: got 'n.a.'
## Warning: Expecting numeric in D33329 / R33329C4: got 'n.a.'
## Warning: Expecting numeric in D33330 / R33330C4: got 'n.a.'
## Warning: Expecting numeric in D33331 / R33331C4: got 'n.a.'
## Warning: Expecting numeric in D33332 / R33332C4: got 'n.a.'
## Warning: Expecting numeric in D33333 / R33333C4: got 'n.a.'
## Warning: Expecting numeric in D33334 / R33334C4: got 'n.a.'
## Warning: Expecting numeric in D33335 / R33335C4: got 'n.a.'
## Warning: Expecting numeric in D33336 / R33336C4: got 'n.a.'
## Warning: Expecting numeric in D33337 / R33337C4: got 'n.a.'
## Warning: Expecting numeric in D33338 / R33338C4: got 'n.a.'
## Warning: Expecting numeric in D33339 / R33339C4: got 'n.a.'
## Warning: Expecting numeric in D33340 / R33340C4: got 'n.a.'
## Warning: Expecting numeric in D33341 / R33341C4: got 'n.a.'
## Warning: Expecting numeric in D33342 / R33342C4: got 'n.a.'
## Warning: Expecting numeric in D33343 / R33343C4: got 'n.a.'
## Warning: Expecting numeric in D33344 / R33344C4: got 'n.a.'
## Warning: Expecting numeric in D33345 / R33345C4: got 'n.a.'
## Warning: Expecting numeric in D33346 / R33346C4: got 'n.a.'
## Warning: Expecting numeric in D33347 / R33347C4: got 'n.a.'
## Warning: Expecting numeric in D33348 / R33348C4: got 'n.a.'
## Warning: Expecting numeric in D33349 / R33349C4: got 'n.a.'
## Warning: Expecting numeric in D33350 / R33350C4: got 'n.a.'
## Warning: Expecting numeric in D33351 / R33351C4: got 'n.a.'
## Warning: Expecting numeric in D33352 / R33352C4: got 'n.a.'
## Warning: Expecting numeric in D33353 / R33353C4: got 'n.a.'
## Warning: Expecting numeric in D33354 / R33354C4: got 'n.a.'
## Warning: Expecting numeric in D33355 / R33355C4: got 'n.a.'
## Warning: Expecting numeric in D33356 / R33356C4: got 'n.a.'
## Warning: Expecting numeric in D33357 / R33357C4: got 'n.a.'
## Warning: Expecting numeric in D33358 / R33358C4: got 'n.a.'
## Warning: Expecting numeric in D33359 / R33359C4: got 'n.a.'
## Warning: Expecting numeric in D33360 / R33360C4: got 'n.a.'
## Warning: Expecting numeric in D33361 / R33361C4: got 'n.a.'
## Warning: Expecting numeric in D33362 / R33362C4: got 'n.a.'
## Warning: Expecting numeric in D33363 / R33363C4: got 'n.a.'
## Warning: Expecting numeric in D33364 / R33364C4: got 'n.a.'
## Warning: Expecting numeric in D33365 / R33365C4: got 'n.a.'
## Warning: Expecting numeric in D33366 / R33366C4: got 'n.a.'
## Warning: Expecting numeric in D33367 / R33367C4: got 'n.a.'
## Warning: Expecting numeric in D33368 / R33368C4: got 'n.a.'
## Warning: Expecting numeric in D33369 / R33369C4: got 'n.a.'
## Warning: Expecting numeric in D33370 / R33370C4: got 'n.a.'
## Warning: Expecting numeric in D33371 / R33371C4: got 'n.a.'
## Warning: Expecting numeric in D33372 / R33372C4: got 'n.a.'
## Warning: Expecting numeric in D33373 / R33373C4: got 'n.a.'
## Warning: Expecting numeric in D33374 / R33374C4: got 'n.a.'
## Warning: Expecting numeric in D33375 / R33375C4: got 'n.a.'
## Warning: Expecting numeric in D33376 / R33376C4: got 'n.a.'
## Warning: Expecting numeric in D33377 / R33377C4: got 'n.a.'
## Warning: Expecting numeric in D33378 / R33378C4: got 'n.a.'
## Warning: Expecting numeric in D33379 / R33379C4: got 'n.a.'
## Warning: Expecting numeric in D33380 / R33380C4: got 'n.a.'
## Warning: Expecting numeric in D33381 / R33381C4: got 'n.a.'
## Warning: Expecting numeric in D33382 / R33382C4: got 'n.a.'
## Warning: Expecting numeric in D33383 / R33383C4: got 'n.a.'
## Warning: Expecting numeric in D33384 / R33384C4: got 'n.a.'
## Warning: Expecting numeric in D33385 / R33385C4: got 'n.a.'
## Warning: Expecting numeric in D33386 / R33386C4: got 'n.a.'
## Warning: Expecting numeric in D33387 / R33387C4: got 'n.a.'
## Warning: Expecting numeric in D33388 / R33388C4: got 'n.a.'
## Warning: Expecting numeric in D33389 / R33389C4: got 'n.a.'
## Warning: Expecting numeric in D33390 / R33390C4: got 'n.a.'
## Warning: Expecting numeric in D33391 / R33391C4: got 'n.a.'
## Warning: Expecting numeric in D33392 / R33392C4: got 'n.a.'
## Warning: Expecting numeric in D33393 / R33393C4: got 'n.a.'
## Warning: Expecting numeric in D33394 / R33394C4: got 'n.a.'
## Warning: Expecting numeric in D33395 / R33395C4: got 'n.a.'
## Warning: Expecting numeric in D33396 / R33396C4: got 'n.a.'
## Warning: Expecting numeric in D33397 / R33397C4: got 'n.a.'
## Warning: Expecting numeric in D33398 / R33398C4: got 'n.a.'
## Warning: Expecting numeric in D33399 / R33399C4: got 'n.a.'
## Warning: Expecting numeric in D33400 / R33400C4: got 'n.a.'
## Warning: Expecting numeric in D33401 / R33401C4: got 'n.a.'
## Warning: Expecting numeric in D33402 / R33402C4: got 'n.a.'
## Warning: Expecting numeric in D33403 / R33403C4: got 'n.a.'
## Warning: Expecting numeric in D33404 / R33404C4: got 'n.a.'
## Warning: Expecting numeric in D33405 / R33405C4: got 'n.a.'
## Warning: Expecting numeric in D33406 / R33406C4: got 'n.a.'
## Warning: Expecting numeric in D33407 / R33407C4: got 'n.a.'
## Warning: Expecting numeric in D33408 / R33408C4: got 'n.a.'
## Warning: Expecting numeric in D33409 / R33409C4: got 'n.a.'
## Warning: Expecting numeric in D33410 / R33410C4: got 'n.a.'
## Warning: Expecting numeric in D33411 / R33411C4: got 'n.a.'
## Warning: Expecting numeric in D33412 / R33412C4: got 'n.a.'
## Warning: Expecting numeric in D33413 / R33413C4: got 'n.a.'
## Warning: Expecting numeric in D33414 / R33414C4: got 'n.a.'
## Warning: Expecting numeric in D33415 / R33415C4: got 'n.a.'
## Warning: Expecting numeric in D33416 / R33416C4: got 'n.a.'
## Warning: Expecting numeric in D33417 / R33417C4: got 'n.a.'
## Warning: Expecting numeric in D33418 / R33418C4: got 'n.a.'
## Warning: Expecting numeric in D33419 / R33419C4: got 'n.a.'
## Warning: Expecting numeric in D33420 / R33420C4: got 'n.a.'
## Warning: Expecting numeric in D33421 / R33421C4: got 'n.a.'
## Warning: Expecting numeric in D33422 / R33422C4: got 'n.a.'
## Warning: Expecting numeric in D33423 / R33423C4: got 'n.a.'
## Warning: Expecting numeric in D33424 / R33424C4: got 'n.a.'
## Warning: Expecting numeric in D33425 / R33425C4: got 'n.a.'
## Warning: Expecting numeric in D33426 / R33426C4: got 'n.a.'
## Warning: Expecting numeric in D33427 / R33427C4: got 'n.a.'
## Warning: Expecting numeric in D33428 / R33428C4: got 'n.a.'
## Warning: Expecting numeric in D33429 / R33429C4: got 'n.a.'
## Warning: Expecting numeric in D33430 / R33430C4: got 'n.a.'
## Warning: Expecting numeric in D33431 / R33431C4: got 'n.a.'
## Warning: Expecting numeric in D33432 / R33432C4: got 'n.a.'
## Warning: Expecting numeric in D33433 / R33433C4: got 'n.a.'
## Warning: Expecting numeric in D33434 / R33434C4: got 'n.a.'
## Warning: Expecting numeric in D33435 / R33435C4: got 'n.a.'
## Warning: Expecting numeric in D33436 / R33436C4: got 'n.a.'
## Warning: Expecting numeric in D33437 / R33437C4: got 'n.a.'
## Warning: Expecting numeric in D33438 / R33438C4: got 'n.a.'
## Warning: Expecting numeric in D33439 / R33439C4: got 'n.a.'
## Warning: Expecting numeric in D33440 / R33440C4: got 'n.a.'
## Warning: Expecting numeric in D33441 / R33441C4: got 'n.a.'
## Warning: Expecting numeric in D33442 / R33442C4: got 'n.a.'
## Warning: Expecting numeric in D33443 / R33443C4: got 'n.a.'
## Warning: Expecting numeric in D33444 / R33444C4: got 'n.a.'
## Warning: Expecting numeric in D33445 / R33445C4: got 'n.a.'
## Warning: Expecting numeric in D33446 / R33446C4: got 'n.a.'
## Warning: Expecting numeric in D33447 / R33447C4: got 'n.a.'
## Warning: Expecting numeric in D33448 / R33448C4: got 'n.a.'
## Warning: Expecting numeric in D33449 / R33449C4: got 'n.a.'
## Warning: Expecting numeric in D33450 / R33450C4: got 'n.a.'
## Warning: Expecting numeric in D33451 / R33451C4: got 'n.a.'
## Warning: Expecting numeric in D33452 / R33452C4: got 'n.a.'
## Warning: Expecting numeric in D33453 / R33453C4: got 'n.a.'
## Warning: Expecting numeric in D33454 / R33454C4: got 'n.a.'
## Warning: Expecting numeric in D33455 / R33455C4: got 'n.a.'
## Warning: Expecting numeric in D33456 / R33456C4: got 'n.a.'
## Warning: Expecting numeric in D33457 / R33457C4: got 'n.a.'
## Warning: Expecting numeric in D33458 / R33458C4: got 'n.a.'
## Warning: Expecting numeric in D33459 / R33459C4: got 'n.a.'
## Warning: Expecting numeric in D33460 / R33460C4: got 'n.a.'
## Warning: Expecting numeric in D33461 / R33461C4: got 'n.a.'
## Warning: Expecting numeric in D33462 / R33462C4: got 'n.a.'
## Warning: Expecting numeric in D33463 / R33463C4: got 'n.a.'
## Warning: Expecting numeric in D33464 / R33464C4: got 'n.a.'
## Warning: Expecting numeric in D33465 / R33465C4: got 'n.a.'
## Warning: Expecting numeric in D33466 / R33466C4: got 'n.a.'
## Warning: Expecting numeric in D33467 / R33467C4: got 'n.a.'
## Warning: Expecting numeric in D33468 / R33468C4: got 'n.a.'
## Warning: Expecting numeric in D33469 / R33469C4: got 'n.a.'
## Warning: Expecting numeric in D33470 / R33470C4: got 'n.a.'
## Warning: Expecting numeric in D33471 / R33471C4: got 'n.a.'
## Warning: Expecting numeric in D33472 / R33472C4: got 'n.a.'
## Warning: Expecting numeric in D33473 / R33473C4: got 'n.a.'
## Warning: Expecting numeric in D33474 / R33474C4: got 'n.a.'
## Warning: Expecting numeric in D33475 / R33475C4: got 'n.a.'
## Warning: Expecting numeric in D33476 / R33476C4: got 'n.a.'
## Warning: Expecting numeric in D33477 / R33477C4: got 'n.a.'
## Warning: Expecting numeric in D33478 / R33478C4: got 'n.a.'
## Warning: Expecting numeric in D33479 / R33479C4: got 'n.a.'
## Warning: Expecting numeric in D33480 / R33480C4: got 'n.a.'
## Warning: Expecting numeric in D33481 / R33481C4: got 'n.a.'
## Warning: Expecting numeric in D33482 / R33482C4: got 'n.a.'
## Warning: Expecting numeric in D33483 / R33483C4: got 'n.a.'
## Warning: Expecting numeric in D33484 / R33484C4: got 'n.a.'
## Warning: Expecting numeric in D33485 / R33485C4: got 'n.a.'
## Warning: Expecting numeric in D33486 / R33486C4: got 'n.a.'
## Warning: Expecting numeric in D33487 / R33487C4: got 'n.a.'
## Warning: Expecting numeric in D33488 / R33488C4: got 'n.a.'
## Warning: Expecting numeric in D33489 / R33489C4: got 'n.a.'
## Warning: Expecting numeric in D33490 / R33490C4: got 'n.a.'
## Warning: Expecting numeric in D33491 / R33491C4: got 'n.a.'
## Warning: Expecting numeric in D33492 / R33492C4: got 'n.a.'
## Warning: Expecting numeric in D33493 / R33493C4: got 'n.a.'
## Warning: Expecting numeric in D33494 / R33494C4: got 'n.a.'
## Warning: Expecting numeric in D33495 / R33495C4: got 'n.a.'
## Warning: Expecting numeric in D33496 / R33496C4: got 'n.a.'
## Warning: Expecting numeric in D33497 / R33497C4: got 'n.a.'
## Warning: Expecting numeric in D33498 / R33498C4: got 'n.a.'
## Warning: Expecting numeric in D33499 / R33499C4: got 'n.a.'
## Warning: Expecting numeric in D33500 / R33500C4: got 'n.a.'
## Warning: Expecting numeric in D33501 / R33501C4: got 'n.a.'
## Warning: Expecting numeric in D33502 / R33502C4: got 'n.a.'
## Warning: Expecting numeric in D33503 / R33503C4: got 'n.a.'
## Warning: Expecting numeric in D33504 / R33504C4: got 'n.a.'
## Warning: Expecting numeric in D33505 / R33505C4: got 'n.a.'
## Warning: Expecting numeric in D33506 / R33506C4: got 'n.a.'
## Warning: Expecting numeric in D33507 / R33507C4: got 'n.a.'
## Warning: Expecting numeric in D33508 / R33508C4: got 'n.a.'
## Warning: Expecting numeric in D33509 / R33509C4: got 'n.a.'
## Warning: Expecting numeric in D33510 / R33510C4: got 'n.a.'
## Warning: Expecting numeric in D33511 / R33511C4: got 'n.a.'
## Warning: Expecting numeric in D33512 / R33512C4: got 'n.a.'
## Warning: Expecting numeric in D33513 / R33513C4: got 'n.a.'
## Warning: Expecting numeric in D33514 / R33514C4: got 'n.a.'
## Warning: Expecting numeric in D33515 / R33515C4: got 'n.a.'
## Warning: Expecting numeric in D33516 / R33516C4: got 'n.a.'
## Warning: Expecting numeric in D33517 / R33517C4: got 'n.a.'
## Warning: Expecting numeric in D33518 / R33518C4: got 'n.a.'
## Warning: Expecting numeric in D33519 / R33519C4: got 'n.a.'
## Warning: Expecting numeric in D33520 / R33520C4: got 'n.a.'
## Warning: Expecting numeric in D33521 / R33521C4: got 'n.a.'
## Warning: Expecting numeric in D33522 / R33522C4: got 'n.a.'
## Warning: Expecting numeric in D33523 / R33523C4: got 'n.a.'
## Warning: Expecting numeric in D33524 / R33524C4: got 'n.a.'
## Warning: Expecting numeric in D33525 / R33525C4: got 'n.a.'
## Warning: Expecting numeric in D33526 / R33526C4: got 'n.a.'
## Warning: Expecting numeric in D33527 / R33527C4: got 'n.a.'
## Warning: Expecting numeric in D33528 / R33528C4: got 'n.a.'
## Warning: Expecting numeric in D33529 / R33529C4: got 'n.a.'
## Warning: Expecting numeric in D33530 / R33530C4: got 'n.a.'
## Warning: Expecting numeric in D33531 / R33531C4: got 'n.a.'
## Warning: Expecting numeric in D33532 / R33532C4: got 'n.a.'
## Warning: Expecting numeric in D33533 / R33533C4: got 'n.a.'
## Warning: Expecting numeric in D33534 / R33534C4: got 'n.a.'
## Warning: Expecting numeric in D33535 / R33535C4: got 'n.a.'
## Warning: Expecting numeric in D33536 / R33536C4: got 'n.a.'
## Warning: Expecting numeric in D33537 / R33537C4: got 'n.a.'
## Warning: Expecting numeric in D33538 / R33538C4: got 'n.a.'
## Warning: Expecting numeric in D33539 / R33539C4: got 'n.a.'
## Warning: Expecting numeric in D33540 / R33540C4: got 'n.a.'
## Warning: Expecting numeric in D33541 / R33541C4: got 'n.a.'
## Warning: Expecting numeric in D33542 / R33542C4: got 'n.a.'
## Warning: Expecting numeric in D33543 / R33543C4: got 'n.a.'
## Warning: Expecting numeric in D33544 / R33544C4: got 'n.a.'
## Warning: Expecting numeric in D33545 / R33545C4: got 'n.a.'
## Warning: Expecting numeric in D33546 / R33546C4: got 'n.a.'
## Warning: Expecting numeric in D33547 / R33547C4: got 'n.a.'
## Warning: Expecting numeric in D33548 / R33548C4: got 'n.a.'
## Warning: Expecting numeric in D33549 / R33549C4: got 'n.a.'
## Warning: Expecting numeric in D33550 / R33550C4: got 'n.a.'
## Warning: Expecting numeric in D33551 / R33551C4: got 'n.a.'
## Warning: Expecting numeric in D33552 / R33552C4: got 'n.a.'
## Warning: Expecting numeric in D33553 / R33553C4: got 'n.a.'
## Warning: Expecting numeric in D33554 / R33554C4: got 'n.a.'
## Warning: Expecting numeric in D33555 / R33555C4: got 'n.a.'
## Warning: Expecting numeric in D33556 / R33556C4: got 'n.a.'
## Warning: Expecting numeric in D33557 / R33557C4: got 'n.a.'
## Warning: Expecting numeric in D33558 / R33558C4: got 'n.a.'
## Warning: Expecting numeric in D33559 / R33559C4: got 'n.a.'
## Warning: Expecting numeric in D33560 / R33560C4: got 'n.a.'
## Warning: Expecting numeric in D33561 / R33561C4: got 'n.a.'
## Warning: Expecting numeric in D33562 / R33562C4: got 'n.a.'
## Warning: Expecting numeric in D33563 / R33563C4: got 'n.a.'
## Warning: Expecting numeric in D33564 / R33564C4: got 'n.a.'
## Warning: Expecting numeric in D33565 / R33565C4: got 'n.a.'
## Warning: Expecting numeric in D33566 / R33566C4: got 'n.a.'
## Warning: Expecting numeric in D33567 / R33567C4: got 'n.a.'
## Warning: Expecting numeric in D33568 / R33568C4: got 'n.a.'
## Warning: Expecting numeric in D33569 / R33569C4: got 'n.a.'
## Warning: Expecting numeric in D33570 / R33570C4: got 'n.a.'
## Warning: Expecting numeric in D33571 / R33571C4: got 'n.a.'
## Warning: Expecting numeric in D33572 / R33572C4: got 'n.a.'
## Warning: Expecting numeric in D33573 / R33573C4: got 'n.a.'
## Warning: Expecting numeric in D33574 / R33574C4: got 'n.a.'
## Warning: Expecting numeric in D33575 / R33575C4: got 'n.a.'
## Warning: Expecting numeric in D33576 / R33576C4: got 'n.a.'
## Warning: Expecting numeric in D33577 / R33577C4: got 'n.a.'
## Warning: Expecting numeric in D33578 / R33578C4: got 'n.a.'
## Warning: Expecting numeric in D33579 / R33579C4: got 'n.a.'
## Warning: Expecting numeric in D33580 / R33580C4: got 'n.a.'
## Warning: Expecting numeric in D33581 / R33581C4: got 'n.a.'
## Warning: Expecting numeric in D33582 / R33582C4: got 'n.a.'
## Warning: Expecting numeric in D33583 / R33583C4: got 'n.a.'
## Warning: Expecting numeric in D33584 / R33584C4: got 'n.a.'
## Warning: Expecting numeric in D33585 / R33585C4: got 'n.a.'
## Warning: Expecting numeric in D33586 / R33586C4: got 'n.a.'
## Warning: Expecting numeric in D33587 / R33587C4: got 'n.a.'
## Warning: Expecting numeric in D33588 / R33588C4: got 'n.a.'
## Warning: Expecting numeric in D33589 / R33589C4: got 'n.a.'
## Warning: Expecting numeric in D33590 / R33590C4: got 'n.a.'
## Warning: Expecting numeric in D33591 / R33591C4: got 'n.a.'
## Warning: Expecting numeric in D33592 / R33592C4: got 'n.a.'
## Warning: Expecting numeric in D33593 / R33593C4: got 'n.a.'
## Warning: Expecting numeric in D33594 / R33594C4: got 'n.a.'
## Warning: Expecting numeric in D33595 / R33595C4: got 'n.a.'
## Warning: Expecting numeric in D33596 / R33596C4: got 'n.a.'
## Warning: Expecting numeric in D33597 / R33597C4: got 'n.a.'
## Warning: Expecting numeric in D33598 / R33598C4: got 'n.a.'
## Warning: Expecting numeric in D33599 / R33599C4: got 'n.a.'
## Warning: Expecting numeric in D33600 / R33600C4: got 'n.a.'
## Warning: Expecting numeric in D33601 / R33601C4: got 'n.a.'
## Warning: Expecting numeric in D33602 / R33602C4: got 'n.a.'
## Warning: Expecting numeric in D33603 / R33603C4: got 'n.a.'
## Warning: Expecting numeric in D33604 / R33604C4: got 'n.a.'
## Warning: Expecting numeric in D33605 / R33605C4: got 'n.a.'
## Warning: Expecting numeric in D33606 / R33606C4: got 'n.a.'
## Warning: Expecting numeric in D33607 / R33607C4: got 'n.a.'
## Warning: Expecting numeric in D33608 / R33608C4: got 'n.a.'
## Warning: Expecting numeric in D33609 / R33609C4: got 'n.a.'
## Warning: Expecting numeric in D33610 / R33610C4: got 'n.a.'
## Warning: Expecting numeric in D33611 / R33611C4: got 'n.a.'
## Warning: Expecting numeric in D33612 / R33612C4: got 'n.a.'
## Warning: Expecting numeric in D33613 / R33613C4: got 'n.a.'
## Warning: Expecting numeric in D33614 / R33614C4: got 'n.a.'
## Warning: Expecting numeric in D33615 / R33615C4: got 'n.a.'
## Warning: Expecting numeric in D33616 / R33616C4: got 'n.a.'
## Warning: Expecting numeric in D33617 / R33617C4: got 'n.a.'
## Warning: Expecting numeric in D33618 / R33618C4: got 'n.a.'
## Warning: Expecting numeric in D33619 / R33619C4: got 'n.a.'
## Warning: Expecting numeric in D33620 / R33620C4: got 'n.a.'
## Warning: Expecting numeric in D33621 / R33621C4: got 'n.a.'
## Warning: Expecting numeric in D33622 / R33622C4: got 'n.a.'
## Warning: Expecting numeric in D33623 / R33623C4: got 'n.a.'
## Warning: Expecting numeric in D33624 / R33624C4: got 'n.a.'
## Warning: Expecting numeric in D33625 / R33625C4: got 'n.a.'
## Warning: Expecting numeric in D33626 / R33626C4: got 'n.a.'
## Warning: Expecting numeric in D33627 / R33627C4: got 'n.a.'
## Warning: Expecting numeric in D33628 / R33628C4: got 'n.a.'
## Warning: Expecting numeric in D33629 / R33629C4: got 'n.a.'
## Warning: Expecting numeric in D33630 / R33630C4: got 'n.a.'
## Warning: Expecting numeric in D33631 / R33631C4: got 'n.a.'
## Warning: Expecting numeric in D33632 / R33632C4: got 'n.a.'
## Warning: Expecting numeric in D33633 / R33633C4: got 'n.a.'
## Warning: Expecting numeric in D33634 / R33634C4: got 'n.a.'
## Warning: Expecting numeric in D33635 / R33635C4: got 'n.a.'
## Warning: Expecting numeric in D33636 / R33636C4: got 'n.a.'
## Warning: Expecting numeric in D33637 / R33637C4: got 'n.a.'
## Warning: Expecting numeric in D33638 / R33638C4: got 'n.a.'
## Warning: Expecting numeric in D33639 / R33639C4: got 'n.a.'
## Warning: Expecting numeric in D33640 / R33640C4: got 'n.a.'
## Warning: Expecting numeric in D33641 / R33641C4: got 'n.a.'
## Warning: Expecting numeric in D33642 / R33642C4: got 'n.a.'
## Warning: Expecting numeric in D33643 / R33643C4: got 'n.a.'
## Warning: Expecting numeric in D33644 / R33644C4: got 'n.a.'
## Warning: Expecting numeric in D33645 / R33645C4: got 'n.a.'
## Warning: Expecting numeric in D33646 / R33646C4: got 'n.a.'
## Warning: Expecting numeric in D33647 / R33647C4: got 'n.a.'
## Warning: Expecting numeric in D33648 / R33648C4: got 'n.a.'
## Warning: Expecting numeric in D33649 / R33649C4: got 'n.a.'
## Warning: Expecting numeric in D33650 / R33650C4: got 'n.a.'
## Warning: Expecting numeric in D33651 / R33651C4: got 'n.a.'
## Warning: Expecting numeric in D33652 / R33652C4: got 'n.a.'
## Warning: Expecting numeric in D33653 / R33653C4: got 'n.a.'
## Warning: Expecting numeric in D33654 / R33654C4: got 'n.a.'
## Warning: Expecting numeric in D33655 / R33655C4: got 'n.a.'
## Warning: Expecting numeric in D33656 / R33656C4: got 'n.a.'
## Warning: Expecting numeric in D33657 / R33657C4: got 'n.a.'
## Warning: Expecting numeric in D33658 / R33658C4: got 'n.a.'
## Warning: Expecting numeric in D33659 / R33659C4: got 'n.a.'
## Warning: Expecting numeric in D33660 / R33660C4: got 'n.a.'
## Warning: Expecting numeric in D33661 / R33661C4: got 'n.a.'
## Warning: Expecting numeric in D33662 / R33662C4: got 'n.a.'
## Warning: Expecting numeric in D33663 / R33663C4: got 'n.a.'
## Warning: Expecting numeric in D33664 / R33664C4: got 'n.a.'
## Warning: Expecting numeric in D33665 / R33665C4: got 'n.a.'
## Warning: Expecting numeric in D33666 / R33666C4: got 'n.a.'
## Warning: Expecting numeric in D33667 / R33667C4: got 'n.a.'
## Warning: Expecting numeric in D33668 / R33668C4: got 'n.a.'
## Warning: Expecting numeric in D33669 / R33669C4: got 'n.a.'
## Warning: Expecting numeric in D33670 / R33670C4: got 'n.a.'
## Warning: Expecting numeric in D33671 / R33671C4: got 'n.a.'
## Warning: Expecting numeric in D33672 / R33672C4: got 'n.a.'
## Warning: Expecting numeric in D33673 / R33673C4: got 'n.a.'
## Warning: Expecting numeric in D33674 / R33674C4: got 'n.a.'
## Warning: Expecting numeric in D33675 / R33675C4: got 'n.a.'
## Warning: Expecting numeric in D33676 / R33676C4: got 'n.a.'
## Warning: Expecting numeric in D33677 / R33677C4: got 'n.a.'
## Warning: Expecting numeric in D33678 / R33678C4: got 'n.a.'
## Warning: Expecting numeric in D33679 / R33679C4: got 'n.a.'
## Warning: Expecting numeric in D33680 / R33680C4: got 'n.a.'
## Warning: Expecting numeric in D33681 / R33681C4: got 'n.a.'
## Warning: Expecting numeric in D33682 / R33682C4: got 'n.a.'
## Warning: Expecting numeric in D33683 / R33683C4: got 'n.a.'
## Warning: Expecting numeric in D33684 / R33684C4: got 'n.a.'
## Warning: Expecting numeric in D33685 / R33685C4: got 'n.a.'
## Warning: Expecting numeric in D33686 / R33686C4: got 'n.a.'
## Warning: Expecting numeric in D33687 / R33687C4: got 'n.a.'
## Warning: Expecting numeric in D33688 / R33688C4: got 'n.a.'
## Warning: Expecting numeric in D33689 / R33689C4: got 'n.a.'
## Warning: Expecting numeric in D33690 / R33690C4: got 'n.a.'
## Warning: Expecting numeric in D33691 / R33691C4: got 'n.a.'
## Warning: Expecting numeric in D33692 / R33692C4: got 'n.a.'
## Warning: Expecting numeric in D33693 / R33693C4: got 'n.a.'
## Warning: Expecting numeric in D33694 / R33694C4: got 'n.a.'
## Warning: Expecting numeric in D33695 / R33695C4: got 'n.a.'
## Warning: Expecting numeric in D33696 / R33696C4: got 'n.a.'
## Warning: Expecting numeric in D33697 / R33697C4: got 'n.a.'
## Warning: Expecting numeric in D33698 / R33698C4: got 'n.a.'
## Warning: Expecting numeric in D33699 / R33699C4: got 'n.a.'
## Warning: Expecting numeric in D33700 / R33700C4: got 'n.a.'
## Warning: Expecting numeric in D33701 / R33701C4: got 'n.a.'
## Warning: Expecting numeric in D33702 / R33702C4: got 'n.a.'
## Warning: Expecting numeric in D33703 / R33703C4: got 'n.a.'
## Warning: Expecting numeric in D33704 / R33704C4: got 'n.a.'
## Warning: Expecting numeric in D33705 / R33705C4: got 'n.a.'
## Warning: Expecting numeric in D33706 / R33706C4: got 'n.a.'
## Warning: Expecting numeric in D33707 / R33707C4: got 'n.a.'
## Warning: Expecting numeric in D33708 / R33708C4: got 'n.a.'
## Warning: Expecting numeric in D33709 / R33709C4: got 'n.a.'
## Warning: Expecting numeric in D33710 / R33710C4: got 'n.a.'
## Warning: Expecting numeric in D33711 / R33711C4: got 'n.a.'
## Warning: Expecting numeric in D33712 / R33712C4: got 'n.a.'
## Warning: Expecting numeric in D33713 / R33713C4: got 'n.a.'
## Warning: Expecting numeric in D33714 / R33714C4: got 'n.a.'
## Warning: Expecting numeric in D33715 / R33715C4: got 'n.a.'
## Warning: Expecting numeric in D33716 / R33716C4: got 'n.a.'
## Warning: Expecting numeric in D33717 / R33717C4: got 'n.a.'
## Warning: Expecting numeric in D33718 / R33718C4: got 'n.a.'
## Warning: Expecting numeric in D33719 / R33719C4: got 'n.a.'
## Warning: Expecting numeric in D33720 / R33720C4: got 'n.a.'
## Warning: Expecting numeric in D33721 / R33721C4: got 'n.a.'
## Warning: Expecting numeric in D33722 / R33722C4: got 'n.a.'
## Warning: Expecting numeric in D33723 / R33723C4: got 'n.a.'
## Warning: Expecting numeric in D33724 / R33724C4: got 'n.a.'
## Warning: Expecting numeric in D33725 / R33725C4: got 'n.a.'
## Warning: Expecting numeric in D33726 / R33726C4: got 'n.a.'
## Warning: Expecting numeric in D33727 / R33727C4: got 'n.a.'
## Warning: Expecting numeric in D33728 / R33728C4: got 'n.a.'
## Warning: Expecting numeric in D33729 / R33729C4: got 'n.a.'
## Warning: Expecting numeric in D33730 / R33730C4: got 'n.a.'
## Warning: Expecting numeric in D33731 / R33731C4: got 'n.a.'
## Warning: Expecting numeric in D33732 / R33732C4: got 'n.a.'
## Warning: Expecting numeric in D33733 / R33733C4: got 'n.a.'
## Warning: Expecting numeric in D33734 / R33734C4: got 'n.a.'
## Warning: Expecting numeric in D33735 / R33735C4: got 'n.a.'
## Warning: Expecting numeric in D33736 / R33736C4: got 'n.a.'
## Warning: Expecting numeric in D33737 / R33737C4: got 'n.a.'
## Warning: Expecting numeric in D33738 / R33738C4: got 'n.a.'
## Warning: Expecting numeric in D33739 / R33739C4: got 'n.a.'
## Warning: Expecting numeric in D33740 / R33740C4: got 'n.a.'
## Warning: Expecting numeric in D33741 / R33741C4: got 'n.a.'
## Warning: Expecting numeric in D33742 / R33742C4: got 'n.a.'
## Warning: Expecting numeric in D33743 / R33743C4: got 'n.a.'
## Warning: Expecting numeric in D33744 / R33744C4: got 'n.a.'
## Warning: Expecting numeric in D33745 / R33745C4: got 'n.a.'
## Warning: Expecting numeric in D33746 / R33746C4: got 'n.a.'
## Warning: Expecting numeric in D33747 / R33747C4: got 'n.a.'
## Warning: Expecting numeric in D33748 / R33748C4: got 'n.a.'
## Warning: Expecting numeric in D33749 / R33749C4: got 'n.a.'
## Warning: Expecting numeric in D33750 / R33750C4: got 'n.a.'
## Warning: Expecting numeric in D33751 / R33751C4: got 'n.a.'
## Warning: Expecting numeric in D33752 / R33752C4: got 'n.a.'
## Warning: Expecting numeric in D33753 / R33753C4: got 'n.a.'
## Warning: Expecting numeric in D33754 / R33754C4: got 'n.a.'
## Warning: Expecting numeric in D33755 / R33755C4: got 'n.a.'
## Warning: Expecting numeric in D33756 / R33756C4: got 'n.a.'
## Warning: Expecting numeric in D33757 / R33757C4: got 'n.a.'
## Warning: Expecting numeric in D33758 / R33758C4: got 'n.a.'
## Warning: Expecting numeric in D33759 / R33759C4: got 'n.a.'
## Warning: Expecting numeric in D33760 / R33760C4: got 'n.a.'
## Warning: Expecting numeric in D33761 / R33761C4: got 'n.a.'
## Warning: Expecting numeric in D33762 / R33762C4: got 'n.a.'
## Warning: Expecting numeric in D33763 / R33763C4: got 'n.a.'
## Warning: Expecting numeric in D33764 / R33764C4: got 'n.a.'
## Warning: Expecting numeric in D33765 / R33765C4: got 'n.a.'
## Warning: Expecting numeric in D33766 / R33766C4: got 'n.a.'
## Warning: Expecting numeric in D33767 / R33767C4: got 'n.a.'
## Warning: Expecting numeric in D33768 / R33768C4: got 'n.a.'
## Warning: Expecting numeric in D33769 / R33769C4: got 'n.a.'
## Warning: Expecting numeric in D33770 / R33770C4: got 'n.a.'
## Warning: Expecting numeric in D33771 / R33771C4: got 'n.a.'
## Warning: Expecting numeric in D33772 / R33772C4: got 'n.a.'
## Warning: Expecting numeric in D33773 / R33773C4: got 'n.a.'
## Warning: Expecting numeric in D33774 / R33774C4: got 'n.a.'
## Warning: Expecting numeric in D33775 / R33775C4: got 'n.a.'
## Warning: Expecting numeric in D33776 / R33776C4: got 'n.a.'
## Warning: Expecting numeric in D33777 / R33777C4: got 'n.a.'
## Warning: Expecting numeric in D33778 / R33778C4: got 'n.a.'
## Warning: Expecting numeric in D33779 / R33779C4: got 'n.a.'
## Warning: Expecting numeric in D33780 / R33780C4: got 'n.a.'
## Warning: Expecting numeric in D33781 / R33781C4: got 'n.a.'
## Warning: Expecting numeric in D33782 / R33782C4: got 'n.a.'
## Warning: Expecting numeric in D33783 / R33783C4: got 'n.a.'
## Warning: Expecting numeric in D33784 / R33784C4: got 'n.a.'
## Warning: Expecting numeric in D33785 / R33785C4: got 'n.a.'
## Warning: Expecting numeric in D33786 / R33786C4: got 'n.a.'
## Warning: Expecting numeric in D33787 / R33787C4: got 'n.a.'
## Warning: Expecting numeric in D33788 / R33788C4: got 'n.a.'
## Warning: Expecting numeric in D33789 / R33789C4: got 'n.a.'
## Warning: Expecting numeric in D33790 / R33790C4: got 'n.a.'
## Warning: Expecting numeric in D33791 / R33791C4: got 'n.a.'
## Warning: Expecting numeric in D33792 / R33792C4: got 'n.a.'
## Warning: Expecting numeric in D33793 / R33793C4: got 'n.a.'
## Warning: Expecting numeric in D33794 / R33794C4: got 'n.a.'
## Warning: Expecting numeric in D33795 / R33795C4: got 'n.a.'
## Warning: Expecting numeric in D33796 / R33796C4: got 'n.a.'
## Warning: Expecting numeric in D33797 / R33797C4: got 'n.a.'
## Warning: Expecting numeric in D33798 / R33798C4: got 'n.a.'
## Warning: Expecting numeric in D33799 / R33799C4: got 'n.a.'
## Warning: Expecting numeric in D33800 / R33800C4: got 'n.a.'
## Warning: Expecting numeric in D33801 / R33801C4: got 'n.a.'
## Warning: Expecting numeric in D33802 / R33802C4: got 'n.a.'
## Warning: Expecting numeric in D33803 / R33803C4: got 'n.a.'
## Warning: Expecting numeric in D33804 / R33804C4: got 'n.a.'
## Warning: Expecting numeric in D33805 / R33805C4: got 'n.a.'
## Warning: Expecting numeric in D33806 / R33806C4: got 'n.a.'
## Warning: Expecting numeric in D33807 / R33807C4: got 'n.a.'
## Warning: Expecting numeric in D33808 / R33808C4: got 'n.a.'
## Warning: Expecting numeric in D33809 / R33809C4: got 'n.a.'
## Warning: Expecting numeric in D33810 / R33810C4: got 'n.a.'
## Warning: Expecting numeric in D33811 / R33811C4: got 'n.a.'
## Warning: Expecting numeric in D33812 / R33812C4: got 'n.a.'
## Warning: Expecting numeric in D33813 / R33813C4: got 'n.a.'
## Warning: Expecting numeric in D33814 / R33814C4: got 'n.a.'
## Warning: Expecting numeric in D33815 / R33815C4: got 'n.a.'
## Warning: Expecting numeric in D33816 / R33816C4: got 'n.a.'
## Warning: Expecting numeric in D33817 / R33817C4: got 'n.a.'
## Warning: Expecting numeric in D33818 / R33818C4: got 'n.a.'
## Warning: Expecting numeric in D33819 / R33819C4: got 'n.a.'
## Warning: Expecting numeric in D33820 / R33820C4: got 'n.a.'
## Warning: Expecting numeric in D33821 / R33821C4: got 'n.a.'
## Warning: Expecting numeric in D33822 / R33822C4: got 'n.a.'
## Warning: Expecting numeric in D33823 / R33823C4: got 'n.a.'
## Warning: Expecting numeric in D33824 / R33824C4: got 'n.a.'
## Warning: Expecting numeric in D33825 / R33825C4: got 'n.a.'
## Warning: Expecting numeric in D33826 / R33826C4: got 'n.a.'
## Warning: Expecting numeric in D33827 / R33827C4: got 'n.a.'
## Warning: Expecting numeric in D33828 / R33828C4: got 'n.a.'
## Warning: Expecting numeric in D33829 / R33829C4: got 'n.a.'
## Warning: Expecting numeric in D33830 / R33830C4: got 'n.a.'
## Warning: Expecting numeric in D33831 / R33831C4: got 'n.a.'
## Warning: Expecting numeric in D33832 / R33832C4: got 'n.a.'
## Warning: Expecting numeric in D33833 / R33833C4: got 'n.a.'
## Warning: Expecting numeric in D33834 / R33834C4: got 'n.a.'
## Warning: Expecting numeric in D33835 / R33835C4: got 'n.a.'
## Warning: Expecting numeric in D33836 / R33836C4: got 'n.a.'
## Warning: Expecting numeric in D33837 / R33837C4: got 'n.a.'
## Warning: Expecting numeric in D33838 / R33838C4: got 'n.a.'
## Warning: Expecting numeric in D33839 / R33839C4: got 'n.a.'
## Warning: Expecting numeric in D33840 / R33840C4: got 'n.a.'
## Warning: Expecting numeric in D33841 / R33841C4: got 'n.a.'
## Warning: Expecting numeric in D33842 / R33842C4: got 'n.a.'
## Warning: Expecting numeric in D33843 / R33843C4: got 'n.a.'
## Warning: Expecting numeric in D33844 / R33844C4: got 'n.a.'
## Warning: Expecting numeric in D33845 / R33845C4: got 'n.a.'
## Warning: Expecting numeric in D33846 / R33846C4: got 'n.a.'
## Warning: Expecting numeric in D33847 / R33847C4: got 'n.a.'
## Warning: Expecting numeric in D33848 / R33848C4: got 'n.a.'
## Warning: Expecting numeric in D33849 / R33849C4: got 'n.a.'
## Warning: Expecting numeric in D33850 / R33850C4: got 'n.a.'
## Warning: Expecting numeric in D33851 / R33851C4: got 'n.a.'
## Warning: Expecting numeric in D33852 / R33852C4: got 'n.a.'
## Warning: Expecting numeric in D33853 / R33853C4: got 'n.a.'
## Warning: Expecting numeric in D33854 / R33854C4: got 'n.a.'
## Warning: Expecting numeric in D33855 / R33855C4: got 'n.a.'
## Warning: Expecting numeric in D33856 / R33856C4: got 'n.a.'
## Warning: Expecting numeric in D33857 / R33857C4: got 'n.a.'
## Warning: Expecting numeric in D33858 / R33858C4: got 'n.a.'
## Warning: Expecting numeric in D33859 / R33859C4: got 'n.a.'
## Warning: Expecting numeric in D33860 / R33860C4: got 'n.a.'
## Warning: Expecting numeric in D33861 / R33861C4: got 'n.a.'
## Warning: Expecting numeric in D33862 / R33862C4: got 'n.a.'
## Warning: Expecting numeric in D33863 / R33863C4: got 'n.a.'
## Warning: Expecting numeric in D33864 / R33864C4: got 'n.a.'
## Warning: Expecting numeric in D33865 / R33865C4: got 'n.a.'
## Warning: Expecting numeric in D33866 / R33866C4: got 'n.a.'
## Warning: Expecting numeric in D33867 / R33867C4: got 'n.a.'
## Warning: Expecting numeric in D33868 / R33868C4: got 'n.a.'
## Warning: Expecting numeric in D33869 / R33869C4: got 'n.a.'
## Warning: Expecting numeric in D33870 / R33870C4: got 'n.a.'
## Warning: Expecting numeric in D33871 / R33871C4: got 'n.a.'
## Warning: Expecting numeric in D33872 / R33872C4: got 'n.a.'
## Warning: Expecting numeric in D33873 / R33873C4: got 'n.a.'
## Warning: Expecting numeric in D33874 / R33874C4: got 'n.a.'
## Warning: Expecting numeric in D33875 / R33875C4: got 'n.a.'
## Warning: Expecting numeric in D33876 / R33876C4: got 'n.a.'
## Warning: Expecting numeric in D33877 / R33877C4: got 'n.a.'
## Warning: Expecting numeric in D33878 / R33878C4: got 'n.a.'
## Warning: Expecting numeric in D33879 / R33879C4: got 'n.a.'
## Warning: Expecting numeric in D33880 / R33880C4: got 'n.a.'
## Warning: Expecting numeric in D33881 / R33881C4: got 'n.a.'
## Warning: Expecting numeric in D33882 / R33882C4: got 'n.a.'
## Warning: Expecting numeric in D33883 / R33883C4: got 'n.a.'
## Warning: Expecting numeric in D33884 / R33884C4: got 'n.a.'
## Warning: Expecting numeric in D33885 / R33885C4: got 'n.a.'
## Warning: Expecting numeric in D33886 / R33886C4: got 'n.a.'
## Warning: Expecting numeric in D33887 / R33887C4: got 'n.a.'
## Warning: Expecting numeric in D33888 / R33888C4: got 'n.a.'
## Warning: Expecting numeric in D33889 / R33889C4: got 'n.a.'
## Warning: Expecting numeric in D33890 / R33890C4: got 'n.a.'
## Warning: Expecting numeric in D33891 / R33891C4: got 'n.a.'
## Warning: Expecting numeric in D33892 / R33892C4: got 'n.a.'
## Warning: Expecting numeric in D33893 / R33893C4: got 'n.a.'
## Warning: Expecting numeric in D33894 / R33894C4: got 'n.a.'
## Warning: Expecting numeric in D33895 / R33895C4: got 'n.a.'
## Warning: Expecting numeric in D33896 / R33896C4: got 'n.a.'
## Warning: Expecting numeric in D33897 / R33897C4: got 'n.a.'
## Warning: Expecting numeric in D33898 / R33898C4: got 'n.a.'
## Warning: Expecting numeric in D33899 / R33899C4: got 'n.a.'
## Warning: Expecting numeric in D33900 / R33900C4: got 'n.a.'
## Warning: Expecting numeric in D33901 / R33901C4: got 'n.a.'
## Warning: Expecting numeric in D33902 / R33902C4: got 'n.a.'
## Warning: Expecting numeric in D33903 / R33903C4: got 'n.a.'
## Warning: Expecting numeric in D33904 / R33904C4: got 'n.a.'
## Warning: Expecting numeric in D33905 / R33905C4: got 'n.a.'
## Warning: Expecting numeric in D33906 / R33906C4: got 'n.a.'
## Warning: Expecting numeric in D33907 / R33907C4: got 'n.a.'
## Warning: Expecting numeric in D33908 / R33908C4: got 'n.a.'
## Warning: Expecting numeric in D33909 / R33909C4: got 'n.a.'
## Warning: Expecting numeric in D33910 / R33910C4: got 'n.a.'
## Warning: Expecting numeric in D33911 / R33911C4: got 'n.a.'
## Warning: Expecting numeric in D33912 / R33912C4: got 'n.a.'
## Warning: Expecting numeric in D33913 / R33913C4: got 'n.a.'
## Warning: Expecting numeric in D33914 / R33914C4: got 'n.a.'
## Warning: Expecting numeric in D33915 / R33915C4: got 'n.a.'
## Warning: Expecting numeric in D33916 / R33916C4: got 'n.a.'
## Warning: Expecting numeric in D33917 / R33917C4: got 'n.a.'
## Warning: Expecting numeric in D33918 / R33918C4: got 'n.a.'
## Warning: Expecting numeric in D33919 / R33919C4: got 'n.a.'
## Warning: Expecting numeric in D33920 / R33920C4: got 'n.a.'
## Warning: Expecting numeric in D33921 / R33921C4: got 'n.a.'
## Warning: Expecting numeric in D33922 / R33922C4: got 'n.a.'
## Warning: Expecting numeric in D33923 / R33923C4: got 'n.a.'
## Warning: Expecting numeric in D33924 / R33924C4: got 'n.a.'
## Warning: Expecting numeric in D33925 / R33925C4: got 'n.a.'
## Warning: Expecting numeric in D33926 / R33926C4: got 'n.a.'
## Warning: Expecting numeric in D33927 / R33927C4: got 'n.a.'
## Warning: Expecting numeric in D33928 / R33928C4: got 'n.a.'
## Warning: Expecting numeric in D33929 / R33929C4: got 'n.a.'
## Warning: Expecting numeric in D33930 / R33930C4: got 'n.a.'
## Warning: Expecting numeric in D33931 / R33931C4: got 'n.a.'
## Warning: Expecting numeric in D33932 / R33932C4: got 'n.a.'
## Warning: Expecting numeric in D33933 / R33933C4: got 'n.a.'
## Warning: Expecting numeric in D33934 / R33934C4: got 'n.a.'
## Warning: Expecting numeric in D33935 / R33935C4: got 'n.a.'
## Warning: Expecting numeric in D33936 / R33936C4: got 'n.a.'
## Warning: Expecting numeric in D33937 / R33937C4: got 'n.a.'
## Warning: Expecting numeric in D33938 / R33938C4: got 'n.a.'
## Warning: Expecting numeric in D33939 / R33939C4: got 'n.a.'
## Warning: Expecting numeric in D33940 / R33940C4: got 'n.a.'
## Warning: Expecting numeric in D33941 / R33941C4: got 'n.a.'
## Warning: Expecting numeric in D33942 / R33942C4: got 'n.a.'
## Warning: Expecting numeric in D33943 / R33943C4: got 'n.a.'
## Warning: Expecting numeric in D33944 / R33944C4: got 'n.a.'
## Warning: Expecting numeric in D33945 / R33945C4: got 'n.a.'
## Warning: Expecting numeric in D33946 / R33946C4: got 'n.a.'
## Warning: Expecting numeric in D33947 / R33947C4: got 'n.a.'
## Warning: Expecting numeric in D33948 / R33948C4: got 'n.a.'
## Warning: Expecting numeric in D33949 / R33949C4: got 'n.a.'
## Warning: Expecting numeric in D33950 / R33950C4: got 'n.a.'
## Warning: Expecting numeric in D33951 / R33951C4: got 'n.a.'
## Warning: Expecting numeric in D33952 / R33952C4: got 'n.a.'
## Warning: Expecting numeric in D33953 / R33953C4: got 'n.a.'
## Warning: Expecting numeric in D33954 / R33954C4: got 'n.a.'
## Warning: Expecting numeric in D33955 / R33955C4: got 'n.a.'
## Warning: Expecting numeric in D33956 / R33956C4: got 'n.a.'
## Warning: Expecting numeric in D33957 / R33957C4: got 'n.a.'
## Warning: Expecting numeric in D33958 / R33958C4: got 'n.a.'
## Warning: Expecting numeric in D33959 / R33959C4: got 'n.a.'
## Warning: Expecting numeric in D33960 / R33960C4: got 'n.a.'
## Warning: Expecting numeric in D33961 / R33961C4: got 'n.a.'
## Warning: Expecting numeric in D33962 / R33962C4: got 'n.a.'
## Warning: Expecting numeric in D33963 / R33963C4: got 'n.a.'
## Warning: Expecting numeric in D33964 / R33964C4: got 'n.a.'
## Warning: Expecting numeric in D33965 / R33965C4: got 'n.a.'
## Warning: Expecting numeric in D33966 / R33966C4: got 'n.a.'
## Warning: Expecting numeric in D33967 / R33967C4: got 'n.a.'
## Warning: Expecting numeric in D33968 / R33968C4: got 'n.a.'
## Warning: Expecting numeric in D33969 / R33969C4: got 'n.a.'
## Warning: Expecting numeric in D33970 / R33970C4: got 'n.a.'
## Warning: Expecting numeric in D33971 / R33971C4: got 'n.a.'
## Warning: Expecting numeric in D33972 / R33972C4: got 'n.a.'
## Warning: Expecting numeric in D33973 / R33973C4: got 'n.a.'
## Warning: Expecting numeric in D33974 / R33974C4: got 'n.a.'
## Warning: Expecting numeric in D33975 / R33975C4: got 'n.a.'
## Warning: Expecting numeric in D33976 / R33976C4: got 'n.a.'
## Warning: Expecting numeric in D33977 / R33977C4: got 'n.a.'
## Warning: Expecting numeric in D33978 / R33978C4: got 'n.a.'
## Warning: Expecting numeric in D33979 / R33979C4: got 'n.a.'
## Warning: Expecting numeric in D33980 / R33980C4: got 'n.a.'
## Warning: Expecting numeric in D33981 / R33981C4: got 'n.a.'
## Warning: Expecting numeric in D33982 / R33982C4: got 'n.a.'
## Warning: Expecting numeric in D33983 / R33983C4: got 'n.a.'
## Warning: Expecting numeric in D33984 / R33984C4: got 'n.a.'
## Warning: Expecting numeric in D33985 / R33985C4: got 'n.a.'
## Warning: Expecting numeric in D33986 / R33986C4: got 'n.a.'
## Warning: Expecting numeric in D33987 / R33987C4: got 'n.a.'
## Warning: Expecting numeric in D33988 / R33988C4: got 'n.a.'
## Warning: Expecting numeric in D33989 / R33989C4: got 'n.a.'
## Warning: Expecting numeric in D33990 / R33990C4: got 'n.a.'
## Warning: Expecting numeric in D33991 / R33991C4: got 'n.a.'
## Warning: Expecting numeric in D33992 / R33992C4: got 'n.a.'
## Warning: Expecting numeric in D33993 / R33993C4: got 'n.a.'
## Warning: Expecting numeric in D33994 / R33994C4: got 'n.a.'
## Warning: Expecting numeric in D33995 / R33995C4: got 'n.a.'
## Warning: Expecting numeric in D33996 / R33996C4: got 'n.a.'
## Warning: Expecting numeric in D33997 / R33997C4: got 'n.a.'
## Warning: Expecting numeric in D33998 / R33998C4: got 'n.a.'
## Warning: Expecting numeric in D33999 / R33999C4: got 'n.a.'
## Warning: Expecting numeric in D34000 / R34000C4: got 'n.a.'
## Warning: Expecting numeric in D34001 / R34001C4: got 'n.a.'
## Warning: Expecting numeric in D34002 / R34002C4: got 'n.a.'
## Warning: Expecting numeric in D34003 / R34003C4: got 'n.a.'
## Warning: Expecting numeric in D34004 / R34004C4: got 'n.a.'
## Warning: Expecting numeric in D34005 / R34005C4: got 'n.a.'
## Warning: Expecting numeric in D34006 / R34006C4: got 'n.a.'
## Warning: Expecting numeric in D34007 / R34007C4: got 'n.a.'
## Warning: Expecting numeric in D34008 / R34008C4: got 'n.a.'
## Warning: Expecting numeric in D34009 / R34009C4: got 'n.a.'
## Warning: Expecting numeric in D34010 / R34010C4: got 'n.a.'
## Warning: Expecting numeric in D34011 / R34011C4: got 'n.a.'
## Warning: Expecting numeric in D34012 / R34012C4: got 'n.a.'
## Warning: Expecting numeric in D34013 / R34013C4: got 'n.a.'
## Warning: Expecting numeric in D34014 / R34014C4: got 'n.a.'
## Warning: Expecting numeric in D34015 / R34015C4: got 'n.a.'
## Warning: Expecting numeric in D34016 / R34016C4: got 'n.a.'
## Warning: Expecting numeric in D34017 / R34017C4: got 'n.a.'
## Warning: Expecting numeric in D34018 / R34018C4: got 'n.a.'
## Warning: Expecting numeric in D34019 / R34019C4: got 'n.a.'
## Warning: Expecting numeric in D34020 / R34020C4: got 'n.a.'
## Warning: Expecting numeric in D34021 / R34021C4: got 'n.a.'
## Warning: Expecting numeric in D34022 / R34022C4: got 'n.a.'
## Warning: Expecting numeric in D34023 / R34023C4: got 'n.a.'
## Warning: Expecting numeric in D34024 / R34024C4: got 'n.a.'
## Warning: Expecting numeric in D34025 / R34025C4: got 'n.a.'
## Warning: Expecting numeric in D34026 / R34026C4: got 'n.a.'
## Warning: Expecting numeric in D34027 / R34027C4: got 'n.a.'
## Warning: Expecting numeric in D34028 / R34028C4: got 'n.a.'
## Warning: Expecting numeric in D34029 / R34029C4: got 'n.a.'
## Warning: Expecting numeric in D34030 / R34030C4: got 'n.a.'
## Warning: Expecting numeric in D34031 / R34031C4: got 'n.a.'
## Warning: Expecting numeric in D34032 / R34032C4: got 'n.a.'
## Warning: Expecting numeric in D34033 / R34033C4: got 'n.a.'
## Warning: Expecting numeric in D34034 / R34034C4: got 'n.a.'
## Warning: Expecting numeric in D34035 / R34035C4: got 'n.a.'
## Warning: Expecting numeric in D34036 / R34036C4: got 'n.a.'
## Warning: Expecting numeric in D34037 / R34037C4: got 'n.a.'
## Warning: Expecting numeric in D34038 / R34038C4: got 'n.a.'
## Warning: Expecting numeric in D34039 / R34039C4: got 'n.a.'
## Warning: Expecting numeric in D34040 / R34040C4: got 'n.a.'
## Warning: Expecting numeric in D34041 / R34041C4: got 'n.a.'
## Warning: Expecting numeric in D34042 / R34042C4: got 'n.a.'
## Warning: Expecting numeric in D34043 / R34043C4: got 'n.a.'
## Warning: Expecting numeric in D34044 / R34044C4: got 'n.a.'
## Warning: Expecting numeric in D34045 / R34045C4: got 'n.a.'
## Warning: Expecting numeric in D34046 / R34046C4: got 'n.a.'
## Warning: Expecting numeric in D34047 / R34047C4: got 'n.a.'
## Warning: Expecting numeric in D34048 / R34048C4: got 'n.a.'
## Warning: Expecting numeric in D34049 / R34049C4: got 'n.a.'
## Warning: Expecting numeric in D34050 / R34050C4: got 'n.a.'
## Warning: Expecting numeric in D34051 / R34051C4: got 'n.a.'
## Warning: Expecting numeric in D34052 / R34052C4: got 'n.a.'
## Warning: Expecting numeric in D34053 / R34053C4: got 'n.a.'
## Warning: Expecting numeric in D34054 / R34054C4: got 'n.a.'
## Warning: Expecting numeric in D34055 / R34055C4: got 'n.a.'
## Warning: Expecting numeric in D34056 / R34056C4: got 'n.a.'
## Warning: Expecting numeric in D34057 / R34057C4: got 'n.a.'
## Warning: Expecting numeric in D34058 / R34058C4: got 'n.a.'
## Warning: Expecting numeric in D34059 / R34059C4: got 'n.a.'
## Warning: Expecting numeric in D34060 / R34060C4: got 'n.a.'
## Warning: Expecting numeric in D34061 / R34061C4: got 'n.a.'
## Warning: Expecting numeric in D34062 / R34062C4: got 'n.a.'
## Warning: Expecting numeric in D34063 / R34063C4: got 'n.a.'
## Warning: Expecting numeric in D34064 / R34064C4: got 'n.a.'
## Warning: Expecting numeric in D34065 / R34065C4: got 'n.a.'
## Warning: Expecting numeric in D34066 / R34066C4: got 'n.a.'
## Warning: Expecting numeric in D34067 / R34067C4: got 'n.a.'
## Warning: Expecting numeric in D34068 / R34068C4: got 'n.a.'
## Warning: Expecting numeric in D34069 / R34069C4: got 'n.a.'
## Warning: Expecting numeric in D34070 / R34070C4: got 'n.a.'
## Warning: Expecting numeric in D34071 / R34071C4: got 'n.a.'
## Warning: Expecting numeric in D34072 / R34072C4: got 'n.a.'
## Warning: Expecting numeric in D34073 / R34073C4: got 'n.a.'
## Warning: Expecting numeric in D34074 / R34074C4: got 'n.a.'
## Warning: Expecting numeric in D34075 / R34075C4: got 'n.a.'
## Warning: Expecting numeric in D34076 / R34076C4: got 'n.a.'
## Warning: Expecting numeric in D34077 / R34077C4: got 'n.a.'
## Warning: Expecting numeric in D34078 / R34078C4: got 'n.a.'
## Warning: Expecting numeric in D34079 / R34079C4: got 'n.a.'
## Warning: Expecting numeric in D34080 / R34080C4: got 'n.a.'
## Warning: Expecting numeric in D34081 / R34081C4: got 'n.a.'
## Warning: Expecting numeric in D34082 / R34082C4: got 'n.a.'
## Warning: Expecting numeric in D34083 / R34083C4: got 'n.a.'
## Warning: Expecting numeric in D34084 / R34084C4: got 'n.a.'
## Warning: Expecting numeric in D34085 / R34085C4: got 'n.a.'
## Warning: Expecting numeric in D34086 / R34086C4: got 'n.a.'
## Warning: Expecting numeric in D34087 / R34087C4: got 'n.a.'
## Warning: Expecting numeric in D34088 / R34088C4: got 'n.a.'
## Warning: Expecting numeric in D34089 / R34089C4: got 'n.a.'
## Warning: Expecting numeric in D34090 / R34090C4: got 'n.a.'
## Warning: Expecting numeric in D34091 / R34091C4: got 'n.a.'
## Warning: Expecting numeric in D34092 / R34092C4: got 'n.a.'
## Warning: Expecting numeric in D34093 / R34093C4: got 'n.a.'
## Warning: Expecting numeric in D34094 / R34094C4: got 'n.a.'
## Warning: Expecting numeric in D34095 / R34095C4: got 'n.a.'
## Warning: Expecting numeric in D34096 / R34096C4: got 'n.a.'
## Warning: Expecting numeric in D34097 / R34097C4: got 'n.a.'
## Warning: Expecting numeric in D34098 / R34098C4: got 'n.a.'
## Warning: Expecting numeric in D34099 / R34099C4: got 'n.a.'
## Warning: Expecting numeric in D34100 / R34100C4: got 'n.a.'
## Warning: Expecting numeric in D34101 / R34101C4: got 'n.a.'
## Warning: Expecting numeric in D34102 / R34102C4: got 'n.a.'
## Warning: Expecting numeric in D34103 / R34103C4: got 'n.a.'
## Warning: Expecting numeric in D34104 / R34104C4: got 'n.a.'
## Warning: Expecting numeric in D34105 / R34105C4: got 'n.a.'
## Warning: Expecting numeric in D34106 / R34106C4: got 'n.a.'
## Warning: Expecting numeric in D34107 / R34107C4: got 'n.a.'
## Warning: Expecting numeric in D34108 / R34108C4: got 'n.a.'
## Warning: Expecting numeric in D34109 / R34109C4: got 'n.a.'
## Warning: Expecting numeric in D34110 / R34110C4: got 'n.a.'
## Warning: Expecting numeric in D34111 / R34111C4: got 'n.a.'
## Warning: Expecting numeric in D34112 / R34112C4: got 'n.a.'
## Warning: Expecting numeric in D34113 / R34113C4: got 'n.a.'
## Warning: Expecting numeric in D34114 / R34114C4: got 'n.a.'
## Warning: Expecting numeric in D34115 / R34115C4: got 'n.a.'
## Warning: Expecting numeric in D34116 / R34116C4: got 'n.a.'
## Warning: Expecting numeric in D34117 / R34117C4: got 'n.a.'
## Warning: Expecting numeric in D34118 / R34118C4: got 'n.a.'
## Warning: Expecting numeric in D34119 / R34119C4: got 'n.a.'
## Warning: Expecting numeric in D34120 / R34120C4: got 'n.a.'
## Warning: Expecting numeric in D34121 / R34121C4: got 'n.a.'
## Warning: Expecting numeric in D34122 / R34122C4: got 'n.a.'
## Warning: Expecting numeric in D34123 / R34123C4: got 'n.a.'
## Warning: Expecting numeric in D34124 / R34124C4: got 'n.a.'
## Warning: Expecting numeric in D34125 / R34125C4: got 'n.a.'
## Warning: Expecting numeric in D34126 / R34126C4: got 'n.a.'
## Warning: Expecting numeric in D34127 / R34127C4: got 'n.a.'
## Warning: Expecting numeric in D34128 / R34128C4: got 'n.a.'
## Warning: Expecting numeric in D34129 / R34129C4: got 'n.a.'
## Warning: Expecting numeric in D34130 / R34130C4: got 'n.a.'
## Warning: Expecting numeric in D34131 / R34131C4: got 'n.a.'
## Warning: Expecting numeric in D34132 / R34132C4: got 'n.a.'
## Warning: Expecting numeric in D34133 / R34133C4: got 'n.a.'
## Warning: Expecting numeric in D34134 / R34134C4: got 'n.a.'
## Warning: Expecting numeric in D34135 / R34135C4: got 'n.a.'
## Warning: Expecting numeric in D34136 / R34136C4: got 'n.a.'
## Warning: Expecting numeric in D34137 / R34137C4: got 'n.a.'
## Warning: Expecting numeric in D34138 / R34138C4: got 'n.a.'
## Warning: Expecting numeric in D34139 / R34139C4: got 'n.a.'
## Warning: Expecting numeric in D34140 / R34140C4: got 'n.a.'
## Warning: Expecting numeric in D34141 / R34141C4: got 'n.a.'
## Warning: Expecting numeric in D34142 / R34142C4: got 'n.a.'
## Warning: Expecting numeric in D34143 / R34143C4: got 'n.a.'
## Warning: Expecting numeric in D34144 / R34144C4: got 'n.a.'
## Warning: Expecting numeric in D34145 / R34145C4: got 'n.a.'
## Warning: Expecting numeric in D34146 / R34146C4: got 'n.a.'
## Warning: Expecting numeric in D34147 / R34147C4: got 'n.a.'
## Warning: Expecting numeric in D34148 / R34148C4: got 'n.a.'
## Warning: Expecting numeric in D34149 / R34149C4: got 'n.a.'
## Warning: Expecting numeric in D34150 / R34150C4: got 'n.a.'
## Warning: Expecting numeric in D34151 / R34151C4: got 'n.a.'
## Warning: Expecting numeric in D34152 / R34152C4: got 'n.a.'
## Warning: Expecting numeric in D34153 / R34153C4: got 'n.a.'
## Warning: Expecting numeric in D34154 / R34154C4: got 'n.a.'
## Warning: Expecting numeric in D34155 / R34155C4: got 'n.a.'
## Warning: Expecting numeric in D34156 / R34156C4: got 'n.a.'
## Warning: Expecting numeric in D34157 / R34157C4: got 'n.a.'
## Warning: Expecting numeric in D34158 / R34158C4: got 'n.a.'
## Warning: Expecting numeric in D34159 / R34159C4: got 'n.a.'
## Warning: Expecting numeric in D34160 / R34160C4: got 'n.a.'
## Warning: Expecting numeric in D34161 / R34161C4: got 'n.a.'
## Warning: Expecting numeric in D34162 / R34162C4: got 'n.a.'
## Warning: Expecting numeric in D34163 / R34163C4: got 'n.a.'
## Warning: Expecting numeric in D34164 / R34164C4: got 'n.a.'
## Warning: Expecting numeric in D34165 / R34165C4: got 'n.a.'
## Warning: Expecting numeric in D34166 / R34166C4: got 'n.a.'
## Warning: Expecting numeric in D34167 / R34167C4: got 'n.a.'
## Warning: Expecting numeric in D34168 / R34168C4: got 'n.a.'
## Warning: Expecting numeric in D34169 / R34169C4: got 'n.a.'
## Warning: Expecting numeric in D34170 / R34170C4: got 'n.a.'
## Warning: Expecting numeric in D34171 / R34171C4: got 'n.a.'
## Warning: Expecting numeric in D34172 / R34172C4: got 'n.a.'
## Warning: Expecting numeric in D34173 / R34173C4: got 'n.a.'
## Warning: Expecting numeric in D34174 / R34174C4: got 'n.a.'
## Warning: Expecting numeric in D34175 / R34175C4: got 'n.a.'
## Warning: Expecting numeric in D34176 / R34176C4: got 'n.a.'
## Warning: Expecting numeric in D34177 / R34177C4: got 'n.a.'
## Warning: Expecting numeric in D34178 / R34178C4: got 'n.a.'
## Warning: Expecting numeric in D34179 / R34179C4: got 'n.a.'
## Warning: Expecting numeric in D34180 / R34180C4: got 'n.a.'
## Warning: Expecting numeric in D34181 / R34181C4: got 'n.a.'
## Warning: Expecting numeric in D34182 / R34182C4: got 'n.a.'
## Warning: Expecting numeric in D34183 / R34183C4: got 'n.a.'
## Warning: Expecting numeric in D34184 / R34184C4: got 'n.a.'
## Warning: Expecting numeric in D34185 / R34185C4: got 'n.a.'
## Warning: Expecting numeric in D34186 / R34186C4: got 'n.a.'
## Warning: Expecting numeric in D34187 / R34187C4: got 'n.a.'
## Warning: Expecting numeric in D34188 / R34188C4: got 'n.a.'
## Warning: Expecting numeric in D34189 / R34189C4: got 'n.a.'
## Warning: Expecting numeric in D34190 / R34190C4: got 'n.a.'
## Warning: Expecting numeric in D34191 / R34191C4: got 'n.a.'
## Warning: Expecting numeric in D34192 / R34192C4: got 'n.a.'
## Warning: Expecting numeric in D34193 / R34193C4: got 'n.a.'
## Warning: Expecting numeric in D34194 / R34194C4: got 'n.a.'
## Warning: Expecting numeric in D34195 / R34195C4: got 'n.a.'
## Warning: Expecting numeric in D34196 / R34196C4: got 'n.a.'
## Warning: Expecting numeric in D34197 / R34197C4: got 'n.a.'
## Warning: Expecting numeric in D34198 / R34198C4: got 'n.a.'
## Warning: Expecting numeric in D34199 / R34199C4: got 'n.a.'
## Warning: Expecting numeric in D34200 / R34200C4: got 'n.a.'
## Warning: Expecting numeric in D34201 / R34201C4: got 'n.a.'
## Warning: Expecting numeric in D34202 / R34202C4: got 'n.a.'
## Warning: Expecting numeric in D34203 / R34203C4: got 'n.a.'
## Warning: Expecting numeric in D34204 / R34204C4: got 'n.a.'
## Warning: Expecting numeric in D34205 / R34205C4: got 'n.a.'
## Warning: Expecting numeric in D34206 / R34206C4: got 'n.a.'
## Warning: Expecting numeric in D34207 / R34207C4: got 'n.a.'
## Warning: Expecting numeric in D34208 / R34208C4: got 'n.a.'
## Warning: Expecting numeric in D34209 / R34209C4: got 'n.a.'
## Warning: Expecting numeric in D34210 / R34210C4: got 'n.a.'
## Warning: Expecting numeric in D34211 / R34211C4: got 'n.a.'
## Warning: Expecting numeric in D34212 / R34212C4: got 'n.a.'
## Warning: Expecting numeric in D34213 / R34213C4: got 'n.a.'
## Warning: Expecting numeric in D34214 / R34214C4: got 'n.a.'
## Warning: Expecting numeric in D34215 / R34215C4: got 'n.a.'
## Warning: Expecting numeric in D34216 / R34216C4: got 'n.a.'
## Warning: Expecting numeric in D34217 / R34217C4: got 'n.a.'
## Warning: Expecting numeric in D34218 / R34218C4: got 'n.a.'
## Warning: Expecting numeric in D34219 / R34219C4: got 'n.a.'
## Warning: Expecting numeric in D34220 / R34220C4: got 'n.a.'
## Warning: Expecting numeric in D34221 / R34221C4: got 'n.a.'
## Warning: Expecting numeric in D34222 / R34222C4: got 'n.a.'
## Warning: Expecting numeric in D34223 / R34223C4: got 'n.a.'
## Warning: Expecting numeric in D34224 / R34224C4: got 'n.a.'
## Warning: Expecting numeric in D34225 / R34225C4: got 'n.a.'
## Warning: Expecting numeric in D34226 / R34226C4: got 'n.a.'
## Warning: Expecting numeric in D34227 / R34227C4: got 'n.a.'
## Warning: Expecting numeric in D34228 / R34228C4: got 'n.a.'
## Warning: Expecting numeric in D34229 / R34229C4: got 'n.a.'
## Warning: Expecting numeric in D34230 / R34230C4: got 'n.a.'
## Warning: Expecting numeric in D34231 / R34231C4: got 'n.a.'
## Warning: Expecting numeric in D34232 / R34232C4: got 'n.a.'
## Warning: Expecting numeric in D34233 / R34233C4: got 'n.a.'
## Warning: Expecting numeric in D34234 / R34234C4: got 'n.a.'
## Warning: Expecting numeric in D34235 / R34235C4: got 'n.a.'
## Warning: Expecting numeric in D34236 / R34236C4: got 'n.a.'
## Warning: Expecting numeric in D34237 / R34237C4: got 'n.a.'
## Warning: Expecting numeric in D34238 / R34238C4: got 'n.a.'
## Warning: Expecting numeric in D34239 / R34239C4: got 'n.a.'
## Warning: Expecting numeric in D34240 / R34240C4: got 'n.a.'
## Warning: Expecting numeric in D34241 / R34241C4: got 'n.a.'
## Warning: Expecting numeric in D34242 / R34242C4: got 'n.a.'
## Warning: Expecting numeric in D34243 / R34243C4: got 'n.a.'
## Warning: Expecting numeric in D34244 / R34244C4: got 'n.a.'
## Warning: Expecting numeric in D34245 / R34245C4: got 'n.a.'
## Warning: Expecting numeric in D34246 / R34246C4: got 'n.a.'
## Warning: Expecting numeric in D34247 / R34247C4: got 'n.a.'
## Warning: Expecting numeric in D34248 / R34248C4: got 'n.a.'
## Warning: Expecting numeric in D34249 / R34249C4: got 'n.a.'
## Warning: Expecting numeric in D34250 / R34250C4: got 'n.a.'
## Warning: Expecting numeric in D34251 / R34251C4: got 'n.a.'
## Warning: Expecting numeric in D34252 / R34252C4: got 'n.a.'
## Warning: Expecting numeric in D34253 / R34253C4: got 'n.a.'
## Warning: Expecting numeric in D34254 / R34254C4: got 'n.a.'
## Warning: Expecting numeric in D34255 / R34255C4: got 'n.a.'
## Warning: Expecting numeric in D34256 / R34256C4: got 'n.a.'
## Warning: Expecting numeric in D34257 / R34257C4: got 'n.a.'
## Warning: Expecting numeric in D34258 / R34258C4: got 'n.a.'
## Warning: Expecting numeric in D34259 / R34259C4: got 'n.a.'
## Warning: Expecting numeric in D34260 / R34260C4: got 'n.a.'
## Warning: Expecting numeric in D34261 / R34261C4: got 'n.a.'
## Warning: Expecting numeric in D34262 / R34262C4: got 'n.a.'
## Warning: Expecting numeric in D34263 / R34263C4: got 'n.a.'
## Warning: Expecting numeric in D34264 / R34264C4: got 'n.a.'
## Warning: Expecting numeric in D34265 / R34265C4: got 'n.a.'
## Warning: Expecting numeric in D34266 / R34266C4: got 'n.a.'
## Warning: Expecting numeric in D34267 / R34267C4: got 'n.a.'
## Warning: Expecting numeric in D34268 / R34268C4: got 'n.a.'
## Warning: Expecting numeric in D34269 / R34269C4: got 'n.a.'
## Warning: Expecting numeric in D34270 / R34270C4: got 'n.a.'
## Warning: Expecting numeric in D34271 / R34271C4: got 'n.a.'
## Warning: Expecting numeric in D34272 / R34272C4: got 'n.a.'
## Warning: Expecting numeric in D34273 / R34273C4: got 'n.a.'
## Warning: Expecting numeric in D34274 / R34274C4: got 'n.a.'
## Warning: Expecting numeric in D34275 / R34275C4: got 'n.a.'
## Warning: Expecting numeric in D34276 / R34276C4: got 'n.a.'
## Warning: Expecting numeric in D34277 / R34277C4: got 'n.a.'
## Warning: Expecting numeric in D34278 / R34278C4: got 'n.a.'
## Warning: Expecting numeric in D34279 / R34279C4: got 'n.a.'
## Warning: Expecting numeric in D34280 / R34280C4: got 'n.a.'
## Warning: Expecting numeric in D34281 / R34281C4: got 'n.a.'
## Warning: Expecting numeric in D34282 / R34282C4: got 'n.a.'
## Warning: Expecting numeric in D34283 / R34283C4: got 'n.a.'
## Warning: Expecting numeric in D34284 / R34284C4: got 'n.a.'
## Warning: Expecting numeric in D34285 / R34285C4: got 'n.a.'
## Warning: Expecting numeric in D34286 / R34286C4: got 'n.a.'
## Warning: Expecting numeric in D34287 / R34287C4: got 'n.a.'
## Warning: Expecting numeric in D34288 / R34288C4: got 'n.a.'
## Warning: Expecting numeric in D34289 / R34289C4: got 'n.a.'
## Warning: Expecting numeric in D34290 / R34290C4: got 'n.a.'
## Warning: Expecting numeric in D34291 / R34291C4: got 'n.a.'
## Warning: Expecting numeric in D34292 / R34292C4: got 'n.a.'
## Warning: Expecting numeric in D34293 / R34293C4: got 'n.a.'
## Warning: Expecting numeric in D34294 / R34294C4: got 'n.a.'
## Warning: Expecting numeric in D34295 / R34295C4: got 'n.a.'
## Warning: Expecting numeric in D34296 / R34296C4: got 'n.a.'
## Warning: Expecting numeric in D34297 / R34297C4: got 'n.a.'
## Warning: Expecting numeric in D34298 / R34298C4: got 'n.a.'
## Warning: Expecting numeric in D34299 / R34299C4: got 'n.a.'
## Warning: Expecting numeric in D34300 / R34300C4: got 'n.a.'
## Warning: Expecting numeric in D34301 / R34301C4: got 'n.a.'
## Warning: Expecting numeric in D34302 / R34302C4: got 'n.a.'
## Warning: Expecting numeric in D34303 / R34303C4: got 'n.a.'
## Warning: Expecting numeric in D34304 / R34304C4: got 'n.a.'
## Warning: Expecting numeric in D34305 / R34305C4: got 'n.a.'
## Warning: Expecting numeric in D34306 / R34306C4: got 'n.a.'
## Warning: Expecting numeric in D34307 / R34307C4: got 'n.a.'
## Warning: Expecting numeric in D34308 / R34308C4: got 'n.a.'
## Warning: Expecting numeric in D34309 / R34309C4: got 'n.a.'
## Warning: Expecting numeric in D34310 / R34310C4: got 'n.a.'
## Warning: Expecting numeric in D34311 / R34311C4: got 'n.a.'
## Warning: Expecting numeric in D34312 / R34312C4: got 'n.a.'
## Warning: Expecting numeric in D34313 / R34313C4: got 'n.a.'
## Warning: Expecting numeric in D34314 / R34314C4: got 'n.a.'
## Warning: Expecting numeric in D34315 / R34315C4: got 'n.a.'
## Warning: Expecting numeric in D34316 / R34316C4: got 'n.a.'
## Warning: Expecting numeric in D34317 / R34317C4: got 'n.a.'
## Warning: Expecting numeric in D34318 / R34318C4: got 'n.a.'
## Warning: Expecting numeric in D34319 / R34319C4: got 'n.a.'
## Warning: Expecting numeric in D34320 / R34320C4: got 'n.a.'
## Warning: Expecting numeric in D34321 / R34321C4: got 'n.a.'
## Warning: Expecting numeric in D34322 / R34322C4: got 'n.a.'
## Warning: Expecting numeric in D34323 / R34323C4: got 'n.a.'
## Warning: Expecting numeric in D34324 / R34324C4: got 'n.a.'
## Warning: Expecting numeric in D34325 / R34325C4: got 'n.a.'
## Warning: Expecting numeric in D34326 / R34326C4: got 'n.a.'
## Warning: Expecting numeric in D34327 / R34327C4: got 'n.a.'
## Warning: Expecting numeric in D34328 / R34328C4: got 'n.a.'
## Warning: Expecting numeric in D34329 / R34329C4: got 'n.a.'
## Warning: Expecting numeric in D34330 / R34330C4: got 'n.a.'
## Warning: Expecting numeric in D34331 / R34331C4: got 'n.a.'
## Warning: Expecting numeric in D34332 / R34332C4: got 'n.a.'
## Warning: Expecting numeric in D34333 / R34333C4: got 'n.a.'
## Warning: Expecting numeric in D34334 / R34334C4: got 'n.a.'
## Warning: Expecting numeric in D34335 / R34335C4: got 'n.a.'
## Warning: Expecting numeric in D34336 / R34336C4: got 'n.a.'
## Warning: Expecting numeric in D34337 / R34337C4: got 'n.a.'
## Warning: Expecting numeric in D34338 / R34338C4: got 'n.a.'
## Warning: Expecting numeric in D34339 / R34339C4: got 'n.a.'
## Warning: Expecting numeric in D34340 / R34340C4: got 'n.a.'
## Warning: Expecting numeric in D34341 / R34341C4: got 'n.a.'
## Warning: Expecting numeric in D34342 / R34342C4: got 'n.a.'
## Warning: Expecting numeric in D34343 / R34343C4: got 'n.a.'
## Warning: Expecting numeric in D34344 / R34344C4: got 'n.a.'
## Warning: Expecting numeric in D34345 / R34345C4: got 'n.a.'
## Warning: Expecting numeric in D34346 / R34346C4: got 'n.a.'
## Warning: Expecting numeric in D34347 / R34347C4: got 'n.a.'
## Warning: Expecting numeric in D34348 / R34348C4: got 'n.a.'
## Warning: Expecting numeric in D34349 / R34349C4: got 'n.a.'
## Warning: Expecting numeric in D34350 / R34350C4: got 'n.a.'
## Warning: Expecting numeric in D34351 / R34351C4: got 'n.a.'
## Warning: Expecting numeric in D34352 / R34352C4: got 'n.a.'
## Warning: Expecting numeric in D34353 / R34353C4: got 'n.a.'
## Warning: Expecting numeric in D34354 / R34354C4: got 'n.a.'
## Warning: Expecting numeric in D34355 / R34355C4: got 'n.a.'
## Warning: Expecting numeric in D34356 / R34356C4: got 'n.a.'
## Warning: Expecting numeric in D34357 / R34357C4: got 'n.a.'
## Warning: Expecting numeric in D34358 / R34358C4: got 'n.a.'
## Warning: Expecting numeric in D34359 / R34359C4: got 'n.a.'
## Warning: Expecting numeric in D34360 / R34360C4: got 'n.a.'
## Warning: Expecting numeric in D34361 / R34361C4: got 'n.a.'
## Warning: Expecting numeric in D34362 / R34362C4: got 'n.a.'
## Warning: Expecting numeric in D34363 / R34363C4: got 'n.a.'
## Warning: Expecting numeric in D34364 / R34364C4: got 'n.a.'
## Warning: Expecting numeric in D34365 / R34365C4: got 'n.a.'
## Warning: Expecting numeric in D34366 / R34366C4: got 'n.a.'
## Warning: Expecting numeric in D34367 / R34367C4: got 'n.a.'
## Warning: Expecting numeric in D34368 / R34368C4: got 'n.a.'
## Warning: Expecting numeric in D34369 / R34369C4: got 'n.a.'
## Warning: Expecting numeric in D34370 / R34370C4: got 'n.a.'
## Warning: Expecting numeric in D34371 / R34371C4: got 'n.a.'
## Warning: Expecting numeric in D34372 / R34372C4: got 'n.a.'
## Warning: Expecting numeric in D34373 / R34373C4: got 'n.a.'
## Warning: Expecting numeric in D34374 / R34374C4: got 'n.a.'
## Warning: Expecting numeric in D34375 / R34375C4: got 'n.a.'
## Warning: Expecting numeric in D34376 / R34376C4: got 'n.a.'
## Warning: Expecting numeric in D34377 / R34377C4: got 'n.a.'
## Warning: Expecting numeric in D34378 / R34378C4: got 'n.a.'
## Warning: Expecting numeric in D34379 / R34379C4: got 'n.a.'
## Warning: Expecting numeric in D34380 / R34380C4: got 'n.a.'
## Warning: Expecting numeric in D34381 / R34381C4: got 'n.a.'
## Warning: Expecting numeric in D34382 / R34382C4: got 'n.a.'
## Warning: Expecting numeric in D34383 / R34383C4: got 'n.a.'
## Warning: Expecting numeric in D34384 / R34384C4: got 'n.a.'
## Warning: Expecting numeric in D34385 / R34385C4: got 'n.a.'
## Warning: Expecting numeric in D34386 / R34386C4: got 'n.a.'
## Warning: Expecting numeric in D34387 / R34387C4: got 'n.a.'
## Warning: Expecting numeric in D34388 / R34388C4: got 'n.a.'
## Warning: Expecting numeric in D34389 / R34389C4: got 'n.a.'
## Warning: Expecting numeric in D34390 / R34390C4: got 'n.a.'
## Warning: Expecting numeric in D34391 / R34391C4: got 'n.a.'
## Warning: Expecting numeric in D34392 / R34392C4: got 'n.a.'
## Warning: Expecting numeric in D34393 / R34393C4: got 'n.a.'
## Warning: Expecting numeric in D34394 / R34394C4: got 'n.a.'
## Warning: Expecting numeric in D34395 / R34395C4: got 'n.a.'
## Warning: Expecting numeric in D34396 / R34396C4: got 'n.a.'
## Warning: Expecting numeric in D34397 / R34397C4: got 'n.a.'
## Warning: Expecting numeric in D34398 / R34398C4: got 'n.a.'
## Warning: Expecting numeric in D34399 / R34399C4: got 'n.a.'
## Warning: Expecting numeric in D34400 / R34400C4: got 'n.a.'
## Warning: Expecting numeric in D34401 / R34401C4: got 'n.a.'
## Warning: Expecting numeric in D34402 / R34402C4: got 'n.a.'
## Warning: Expecting numeric in D34403 / R34403C4: got 'n.a.'
## Warning: Expecting numeric in D34404 / R34404C4: got 'n.a.'
## Warning: Expecting numeric in D34405 / R34405C4: got 'n.a.'
## Warning: Expecting numeric in D34406 / R34406C4: got 'n.a.'
## Warning: Expecting numeric in D34407 / R34407C4: got 'n.a.'
## Warning: Expecting numeric in D34408 / R34408C4: got 'n.a.'
## Warning: Expecting numeric in D34409 / R34409C4: got 'n.a.'
## Warning: Expecting numeric in D34410 / R34410C4: got 'n.a.'
## Warning: Expecting numeric in D34411 / R34411C4: got 'n.a.'
## Warning: Expecting numeric in D34412 / R34412C4: got 'n.a.'
## Warning: Expecting numeric in D34413 / R34413C4: got 'n.a.'
## Warning: Expecting numeric in D34414 / R34414C4: got 'n.a.'
## Warning: Expecting numeric in D34415 / R34415C4: got 'n.a.'
## Warning: Expecting numeric in D34416 / R34416C4: got 'n.a.'
## Warning: Expecting numeric in D34417 / R34417C4: got 'n.a.'
## Warning: Expecting numeric in D34418 / R34418C4: got 'n.a.'
## Warning: Expecting numeric in D34419 / R34419C4: got 'n.a.'
## Warning: Expecting numeric in D34420 / R34420C4: got 'n.a.'
## Warning: Expecting numeric in D34421 / R34421C4: got 'n.a.'
## Warning: Expecting numeric in D34422 / R34422C4: got 'n.a.'
## Warning: Expecting numeric in D34423 / R34423C4: got 'n.a.'
## Warning: Expecting numeric in D34424 / R34424C4: got 'n.a.'
## Warning: Expecting numeric in D34425 / R34425C4: got 'n.a.'
## Warning: Expecting numeric in D34426 / R34426C4: got 'n.a.'
## Warning: Expecting numeric in D34427 / R34427C4: got 'n.a.'
## Warning: Expecting numeric in D34428 / R34428C4: got 'n.a.'
## Warning: Expecting numeric in D34429 / R34429C4: got 'n.a.'
## Warning: Expecting numeric in D34430 / R34430C4: got 'n.a.'
## Warning: Expecting numeric in D34431 / R34431C4: got 'n.a.'
## Warning: Expecting numeric in D34432 / R34432C4: got 'n.a.'
## Warning: Expecting numeric in D34433 / R34433C4: got 'n.a.'
## Warning: Expecting numeric in D34434 / R34434C4: got 'n.a.'
## Warning: Expecting numeric in D34435 / R34435C4: got 'n.a.'
## Warning: Expecting numeric in D34436 / R34436C4: got 'n.a.'
## Warning: Expecting numeric in D34437 / R34437C4: got 'n.a.'
## Warning: Expecting numeric in D34438 / R34438C4: got 'n.a.'
## Warning: Expecting numeric in D34439 / R34439C4: got 'n.a.'
## Warning: Expecting numeric in D34440 / R34440C4: got 'n.a.'
## Warning: Expecting numeric in D34441 / R34441C4: got 'n.a.'
## Warning: Expecting numeric in D34442 / R34442C4: got 'n.a.'
## Warning: Expecting numeric in D34443 / R34443C4: got 'n.a.'
## Warning: Expecting numeric in D34444 / R34444C4: got 'n.a.'
## Warning: Expecting numeric in D34445 / R34445C4: got 'n.a.'
## Warning: Expecting numeric in D34446 / R34446C4: got 'n.a.'
## Warning: Expecting numeric in D34447 / R34447C4: got 'n.a.'
## Warning: Expecting numeric in D34448 / R34448C4: got 'n.a.'
## Warning: Expecting numeric in D34449 / R34449C4: got 'n.a.'
## Warning: Expecting numeric in D34450 / R34450C4: got 'n.a.'
## Warning: Expecting numeric in D34451 / R34451C4: got 'n.a.'
## Warning: Expecting numeric in D34452 / R34452C4: got 'n.a.'
## Warning: Expecting numeric in D34453 / R34453C4: got 'n.a.'
## Warning: Expecting numeric in D34454 / R34454C4: got 'n.a.'
## Warning: Expecting numeric in D34455 / R34455C4: got 'n.a.'
## Warning: Expecting numeric in D34456 / R34456C4: got 'n.a.'
## Warning: Expecting numeric in D34457 / R34457C4: got 'n.a.'
## Warning: Expecting numeric in D34458 / R34458C4: got 'n.a.'
## Warning: Expecting numeric in D34459 / R34459C4: got 'n.a.'
## Warning: Expecting numeric in D34460 / R34460C4: got 'n.a.'
## Warning: Expecting numeric in D34461 / R34461C4: got 'n.a.'
## Warning: Expecting numeric in D34462 / R34462C4: got 'n.a.'
## Warning: Expecting numeric in D34463 / R34463C4: got 'n.a.'
## Warning: Expecting numeric in D34464 / R34464C4: got 'n.a.'
## Warning: Expecting numeric in D34465 / R34465C4: got 'n.a.'
## Warning: Expecting numeric in D34466 / R34466C4: got 'n.a.'
## Warning: Expecting numeric in D34467 / R34467C4: got 'n.a.'
## Warning: Expecting numeric in D34468 / R34468C4: got 'n.a.'
## Warning: Expecting numeric in D34469 / R34469C4: got 'n.a.'
## Warning: Expecting numeric in D34470 / R34470C4: got 'n.a.'
## Warning: Expecting numeric in D34471 / R34471C4: got 'n.a.'
## Warning: Expecting numeric in D34472 / R34472C4: got 'n.a.'
## Warning: Expecting numeric in D34473 / R34473C4: got 'n.a.'
## Warning: Expecting numeric in D34474 / R34474C4: got 'n.a.'
## Warning: Expecting numeric in D34475 / R34475C4: got 'n.a.'
## Warning: Expecting numeric in D34476 / R34476C4: got 'n.a.'
## Warning: Expecting numeric in D34477 / R34477C4: got 'n.a.'
## Warning: Expecting numeric in D34478 / R34478C4: got 'n.a.'
## Warning: Expecting numeric in D34479 / R34479C4: got 'n.a.'
## Warning: Expecting numeric in D34480 / R34480C4: got 'n.a.'
## Warning: Expecting numeric in D34481 / R34481C4: got 'n.a.'
## Warning: Expecting numeric in D34482 / R34482C4: got 'n.a.'
## Warning: Expecting numeric in D34483 / R34483C4: got 'n.a.'
## Warning: Expecting numeric in D34484 / R34484C4: got 'n.a.'
## Warning: Expecting numeric in D34485 / R34485C4: got 'n.a.'
## Warning: Expecting numeric in D34486 / R34486C4: got 'n.a.'
## Warning: Expecting numeric in D34487 / R34487C4: got 'n.a.'
## Warning: Expecting numeric in D34488 / R34488C4: got 'n.a.'
## Warning: Expecting numeric in D34489 / R34489C4: got 'n.a.'
## Warning: Expecting numeric in D34490 / R34490C4: got 'n.a.'
## Warning: Expecting numeric in D34491 / R34491C4: got 'n.a.'
## Warning: Expecting numeric in D34492 / R34492C4: got 'n.a.'
## Warning: Expecting numeric in D34493 / R34493C4: got 'n.a.'
## Warning: Expecting numeric in D34494 / R34494C4: got 'n.a.'
## Warning: Expecting numeric in D34495 / R34495C4: got 'n.a.'
## Warning: Expecting numeric in D34496 / R34496C4: got 'n.a.'
## Warning: Expecting numeric in D34497 / R34497C4: got 'n.a.'
## Warning: Expecting numeric in D34498 / R34498C4: got 'n.a.'
## Warning: Expecting numeric in D34499 / R34499C4: got 'n.a.'
## Warning: Expecting numeric in D34500 / R34500C4: got 'n.a.'
## Warning: Expecting numeric in D34501 / R34501C4: got 'n.a.'
## Warning: Expecting numeric in D34502 / R34502C4: got 'n.a.'
## Warning: Expecting numeric in D34503 / R34503C4: got 'n.a.'
## Warning: Expecting numeric in D34504 / R34504C4: got 'n.a.'
## Warning: Expecting numeric in D34505 / R34505C4: got 'n.a.'
## Warning: Expecting numeric in D34506 / R34506C4: got 'n.a.'
## Warning: Expecting numeric in D34507 / R34507C4: got 'n.a.'
## Warning: Expecting numeric in D34508 / R34508C4: got 'n.a.'
## Warning: Expecting numeric in D34509 / R34509C4: got 'n.a.'
## Warning: Expecting numeric in D34510 / R34510C4: got 'n.a.'
## Warning: Expecting numeric in D34511 / R34511C4: got 'n.a.'
## Warning: Expecting numeric in D34512 / R34512C4: got 'n.a.'
## Warning: Expecting numeric in D34513 / R34513C4: got 'n.a.'
## Warning: Expecting numeric in D34514 / R34514C4: got 'n.a.'
## Warning: Expecting numeric in D34515 / R34515C4: got 'n.a.'
## Warning: Expecting numeric in D34516 / R34516C4: got 'n.a.'
## Warning: Expecting numeric in D34517 / R34517C4: got 'n.a.'
## Warning: Expecting numeric in D34518 / R34518C4: got 'n.a.'
## Warning: Expecting numeric in D34519 / R34519C4: got 'n.a.'
## Warning: Expecting numeric in D34520 / R34520C4: got 'n.a.'
## Warning: Expecting numeric in D34521 / R34521C4: got 'n.a.'
## Warning: Expecting numeric in D34522 / R34522C4: got 'n.a.'
## Warning: Expecting numeric in D34523 / R34523C4: got 'n.a.'
## Warning: Expecting numeric in D34524 / R34524C4: got 'n.a.'
## Warning: Expecting numeric in D34525 / R34525C4: got 'n.a.'
## Warning: Expecting numeric in D34526 / R34526C4: got 'n.a.'
## Warning: Expecting numeric in D34527 / R34527C4: got 'n.a.'
## Warning: Expecting numeric in D34528 / R34528C4: got 'n.a.'
## Warning: Expecting numeric in D34529 / R34529C4: got 'n.a.'
## Warning: Expecting numeric in D34530 / R34530C4: got 'n.a.'
## Warning: Expecting numeric in D34531 / R34531C4: got 'n.a.'
## Warning: Expecting numeric in D34532 / R34532C4: got 'n.a.'
## Warning: Expecting numeric in D34533 / R34533C4: got 'n.a.'
## Warning: Expecting numeric in D34534 / R34534C4: got 'n.a.'
## Warning: Expecting numeric in D34535 / R34535C4: got 'n.a.'
## Warning: Expecting numeric in D34536 / R34536C4: got 'n.a.'
## Warning: Expecting numeric in D34537 / R34537C4: got 'n.a.'
## Warning: Expecting numeric in D34538 / R34538C4: got 'n.a.'
## Warning: Expecting numeric in D34539 / R34539C4: got 'n.a.'
## Warning: Expecting numeric in D34540 / R34540C4: got 'n.a.'
## Warning: Expecting numeric in D34541 / R34541C4: got 'n.a.'
## Warning: Expecting numeric in D34542 / R34542C4: got 'n.a.'
## Warning: Expecting numeric in D34543 / R34543C4: got 'n.a.'
## Warning: Expecting numeric in D34544 / R34544C4: got 'n.a.'
## Warning: Expecting numeric in D34545 / R34545C4: got 'n.a.'
## Warning: Expecting numeric in D34546 / R34546C4: got 'n.a.'
## Warning: Expecting numeric in D34547 / R34547C4: got 'n.a.'
## Warning: Expecting numeric in D34548 / R34548C4: got 'n.a.'
## Warning: Expecting numeric in D34549 / R34549C4: got 'n.a.'
## Warning: Expecting numeric in D34550 / R34550C4: got 'n.a.'
## Warning: Expecting numeric in D34551 / R34551C4: got 'n.a.'
## Warning: Expecting numeric in D34552 / R34552C4: got 'n.a.'
## Warning: Expecting numeric in D34553 / R34553C4: got 'n.a.'
## Warning: Expecting numeric in D34554 / R34554C4: got 'n.a.'
## Warning: Expecting numeric in D34555 / R34555C4: got 'n.a.'
## Warning: Expecting numeric in D34556 / R34556C4: got 'n.a.'
## Warning: Expecting numeric in D34557 / R34557C4: got 'n.a.'
## Warning: Expecting numeric in D34558 / R34558C4: got 'n.a.'
## Warning: Expecting numeric in D34559 / R34559C4: got 'n.a.'
## Warning: Expecting numeric in D34560 / R34560C4: got 'n.a.'
## Warning: Expecting numeric in D34561 / R34561C4: got 'n.a.'
## Warning: Expecting numeric in D34562 / R34562C4: got 'n.a.'
## Warning: Expecting numeric in D34563 / R34563C4: got 'n.a.'
## Warning: Expecting numeric in D34564 / R34564C4: got 'n.a.'
## Warning: Expecting numeric in D34565 / R34565C4: got 'n.a.'
## Warning: Expecting numeric in D34566 / R34566C4: got 'n.a.'
## Warning: Expecting numeric in D34567 / R34567C4: got 'n.a.'
## Warning: Expecting numeric in D34568 / R34568C4: got 'n.a.'
## Warning: Expecting numeric in D34569 / R34569C4: got 'n.a.'
## Warning: Expecting numeric in D34570 / R34570C4: got 'n.a.'
## Warning: Expecting numeric in D34571 / R34571C4: got 'n.a.'
## Warning: Expecting numeric in D34572 / R34572C4: got 'n.a.'
## Warning: Expecting numeric in D34573 / R34573C4: got 'n.a.'
## Warning: Expecting numeric in D34574 / R34574C4: got 'n.a.'
## Warning: Expecting numeric in D34575 / R34575C4: got 'n.a.'
## Warning: Expecting numeric in D34576 / R34576C4: got 'n.a.'
## Warning: Expecting numeric in D34577 / R34577C4: got 'n.a.'
## Warning: Expecting numeric in D34578 / R34578C4: got 'n.a.'
## Warning: Expecting numeric in D34579 / R34579C4: got 'n.a.'
## Warning: Expecting numeric in D34580 / R34580C4: got 'n.a.'
## Warning: Expecting numeric in D34581 / R34581C4: got 'n.a.'
## Warning: Expecting numeric in D34582 / R34582C4: got 'n.a.'
## Warning: Expecting numeric in D34583 / R34583C4: got 'n.a.'
## Warning: Expecting numeric in D34584 / R34584C4: got 'n.a.'
## Warning: Expecting numeric in D34585 / R34585C4: got 'n.a.'
## Warning: Expecting numeric in D34586 / R34586C4: got 'n.a.'
## Warning: Expecting numeric in D34587 / R34587C4: got 'n.a.'
## Warning: Expecting numeric in D34588 / R34588C4: got 'n.a.'
## Warning: Expecting numeric in D34589 / R34589C4: got 'n.a.'
## Warning: Expecting numeric in D34590 / R34590C4: got 'n.a.'
## Warning: Expecting numeric in D34591 / R34591C4: got 'n.a.'
## Warning: Expecting numeric in D34592 / R34592C4: got 'n.a.'
## Warning: Expecting numeric in D34593 / R34593C4: got 'n.a.'
## Warning: Expecting numeric in D34594 / R34594C4: got 'n.a.'
## Warning: Expecting numeric in D34595 / R34595C4: got 'n.a.'
## Warning: Expecting numeric in D34596 / R34596C4: got 'n.a.'
## Warning: Expecting numeric in D34597 / R34597C4: got 'n.a.'
## Warning: Expecting numeric in D34598 / R34598C4: got 'n.a.'
## Warning: Expecting numeric in D34599 / R34599C4: got 'n.a.'
## Warning: Expecting numeric in D34600 / R34600C4: got 'n.a.'
## Warning: Expecting numeric in D34601 / R34601C4: got 'n.a.'
## Warning: Expecting numeric in D34602 / R34602C4: got 'n.a.'
## Warning: Expecting numeric in D34603 / R34603C4: got 'n.a.'
## Warning: Expecting numeric in D34604 / R34604C4: got 'n.a.'
## Warning: Expecting numeric in D34605 / R34605C4: got 'n.a.'
## Warning: Expecting numeric in D34606 / R34606C4: got 'n.a.'
## Warning: Expecting numeric in D34607 / R34607C4: got 'n.a.'
## Warning: Expecting numeric in D34608 / R34608C4: got 'n.a.'
## Warning: Expecting numeric in D34609 / R34609C4: got 'n.a.'
## Warning: Expecting numeric in D34610 / R34610C4: got 'n.a.'
## Warning: Expecting numeric in D34611 / R34611C4: got 'n.a.'
## Warning: Expecting numeric in D34612 / R34612C4: got 'n.a.'
## Warning: Expecting numeric in D34613 / R34613C4: got 'n.a.'
## Warning: Expecting numeric in D34614 / R34614C4: got 'n.a.'
## Warning: Expecting numeric in D34615 / R34615C4: got 'n.a.'
## Warning: Expecting numeric in D34616 / R34616C4: got 'n.a.'
## Warning: Expecting numeric in D34617 / R34617C4: got 'n.a.'
## Warning: Expecting numeric in D34618 / R34618C4: got 'n.a.'
## Warning: Expecting numeric in D34619 / R34619C4: got 'n.a.'
## Warning: Expecting numeric in D34620 / R34620C4: got 'n.a.'
## Warning: Expecting numeric in D34621 / R34621C4: got 'n.a.'
## Warning: Expecting numeric in D34622 / R34622C4: got 'n.a.'
## Warning: Expecting numeric in D34623 / R34623C4: got 'n.a.'
## Warning: Expecting numeric in D34624 / R34624C4: got 'n.a.'
## Warning: Expecting numeric in D34625 / R34625C4: got 'n.a.'
## Warning: Expecting numeric in D34626 / R34626C4: got 'n.a.'
## Warning: Expecting numeric in D34627 / R34627C4: got 'n.a.'
## Warning: Expecting numeric in D34628 / R34628C4: got 'n.a.'
## Warning: Expecting numeric in D34629 / R34629C4: got 'n.a.'
## Warning: Expecting numeric in D34630 / R34630C4: got 'n.a.'
## Warning: Expecting numeric in D34631 / R34631C4: got 'n.a.'
## Warning: Expecting numeric in D34632 / R34632C4: got 'n.a.'
## Warning: Expecting numeric in D34633 / R34633C4: got 'n.a.'
## Warning: Expecting numeric in D34634 / R34634C4: got 'n.a.'
## Warning: Expecting numeric in D34635 / R34635C4: got 'n.a.'
## Warning: Expecting numeric in D34636 / R34636C4: got 'n.a.'
## Warning: Expecting numeric in D34637 / R34637C4: got 'n.a.'
## Warning: Expecting numeric in D34638 / R34638C4: got 'n.a.'
## Warning: Expecting numeric in D34639 / R34639C4: got 'n.a.'
## Warning: Expecting numeric in D34640 / R34640C4: got 'n.a.'
## Warning: Expecting numeric in D34641 / R34641C4: got 'n.a.'
## Warning: Expecting numeric in D34642 / R34642C4: got 'n.a.'
## Warning: Expecting numeric in D34643 / R34643C4: got 'n.a.'
## Warning: Expecting numeric in D34644 / R34644C4: got 'n.a.'
## Warning: Expecting numeric in D34645 / R34645C4: got 'n.a.'
## Warning: Expecting numeric in D34646 / R34646C4: got 'n.a.'
## Warning: Expecting numeric in D34647 / R34647C4: got 'n.a.'
## Warning: Expecting numeric in D34648 / R34648C4: got 'n.a.'
## Warning: Expecting numeric in D34649 / R34649C4: got 'n.a.'
## Warning: Expecting numeric in D34650 / R34650C4: got 'n.a.'
## Warning: Expecting numeric in D34651 / R34651C4: got 'n.a.'
## Warning: Expecting numeric in D34652 / R34652C4: got 'n.a.'
## Warning: Expecting numeric in D34653 / R34653C4: got 'n.a.'
## Warning: Expecting numeric in D34654 / R34654C4: got 'n.a.'
## Warning: Expecting numeric in D34655 / R34655C4: got 'n.a.'
## Warning: Expecting numeric in D34656 / R34656C4: got 'n.a.'
## Warning: Expecting numeric in D34657 / R34657C4: got 'n.a.'
## Warning: Expecting numeric in D34658 / R34658C4: got 'n.a.'
## Warning: Expecting numeric in D34659 / R34659C4: got 'n.a.'
## Warning: Expecting numeric in D34660 / R34660C4: got 'n.a.'
## Warning: Expecting numeric in D34661 / R34661C4: got 'n.a.'
## Warning: Expecting numeric in D34662 / R34662C4: got 'n.a.'
## Warning: Expecting numeric in D34663 / R34663C4: got 'n.a.'
## Warning: Expecting numeric in D34664 / R34664C4: got 'n.a.'
## Warning: Expecting numeric in D34665 / R34665C4: got 'n.a.'
## Warning: Expecting numeric in D34666 / R34666C4: got 'n.a.'
## Warning: Expecting numeric in D34667 / R34667C4: got 'n.a.'
## Warning: Expecting numeric in D34668 / R34668C4: got 'n.a.'
## Warning: Expecting numeric in D34669 / R34669C4: got 'n.a.'
## Warning: Expecting numeric in D34670 / R34670C4: got 'n.a.'
## Warning: Expecting numeric in D34671 / R34671C4: got 'n.a.'
## Warning: Expecting numeric in D34672 / R34672C4: got 'n.a.'
## Warning: Expecting numeric in D34673 / R34673C4: got 'n.a.'
## Warning: Expecting numeric in D34674 / R34674C4: got 'n.a.'
## Warning: Expecting numeric in D34675 / R34675C4: got 'n.a.'
## Warning: Expecting numeric in D34676 / R34676C4: got 'n.a.'
## Warning: Expecting numeric in D34677 / R34677C4: got 'n.a.'
## Warning: Expecting numeric in D34678 / R34678C4: got 'n.a.'
## Warning: Expecting numeric in D34679 / R34679C4: got 'n.a.'
## Warning: Expecting numeric in D34680 / R34680C4: got 'n.a.'
## Warning: Expecting numeric in D34681 / R34681C4: got 'n.a.'
## Warning: Expecting numeric in D34682 / R34682C4: got 'n.a.'
## Warning: Expecting numeric in D34683 / R34683C4: got 'n.a.'
## Warning: Expecting numeric in D34684 / R34684C4: got 'n.a.'
## Warning: Expecting numeric in D34685 / R34685C4: got 'n.a.'
## Warning: Expecting numeric in D34686 / R34686C4: got 'n.a.'
## Warning: Expecting numeric in D34687 / R34687C4: got 'n.a.'
## Warning: Expecting numeric in D34688 / R34688C4: got 'n.a.'
## Warning: Expecting numeric in D34689 / R34689C4: got 'n.a.'
## Warning: Expecting numeric in D34690 / R34690C4: got 'n.a.'
## Warning: Expecting numeric in D34691 / R34691C4: got 'n.a.'
## Warning: Expecting numeric in D34692 / R34692C4: got 'n.a.'
## Warning: Expecting numeric in D34693 / R34693C4: got 'n.a.'
## Warning: Expecting numeric in D34694 / R34694C4: got 'n.a.'
## Warning: Expecting numeric in D34695 / R34695C4: got 'n.a.'
## Warning: Expecting numeric in D34696 / R34696C4: got 'n.a.'
## Warning: Expecting numeric in D34697 / R34697C4: got 'n.a.'
## Warning: Expecting numeric in D34698 / R34698C4: got 'n.a.'
## Warning: Expecting numeric in D34699 / R34699C4: got 'n.a.'
## Warning: Expecting numeric in D34700 / R34700C4: got 'n.a.'
## Warning: Expecting numeric in D34701 / R34701C4: got 'n.a.'
## Warning: Expecting numeric in D34702 / R34702C4: got 'n.a.'
## Warning: Expecting numeric in D34703 / R34703C4: got 'n.a.'
## Warning: Expecting numeric in D34704 / R34704C4: got 'n.a.'
## Warning: Expecting numeric in D34705 / R34705C4: got 'n.a.'
## Warning: Expecting numeric in D34706 / R34706C4: got 'n.a.'
## Warning: Expecting numeric in D34707 / R34707C4: got 'n.a.'
## Warning: Expecting numeric in D34708 / R34708C4: got 'n.a.'
## Warning: Expecting numeric in D34709 / R34709C4: got 'n.a.'
## Warning: Expecting numeric in D34710 / R34710C4: got 'n.a.'
## Warning: Expecting numeric in D34711 / R34711C4: got 'n.a.'
## Warning: Expecting numeric in D34712 / R34712C4: got 'n.a.'
## Warning: Expecting numeric in D34713 / R34713C4: got 'n.a.'
## Warning: Expecting numeric in D34714 / R34714C4: got 'n.a.'
## Warning: Expecting numeric in D34715 / R34715C4: got 'n.a.'
## Warning: Expecting numeric in D34716 / R34716C4: got 'n.a.'
## Warning: Expecting numeric in D34717 / R34717C4: got 'n.a.'
## Warning: Expecting numeric in D34718 / R34718C4: got 'n.a.'
## Warning: Expecting numeric in D34719 / R34719C4: got 'n.a.'
## Warning: Expecting numeric in D34720 / R34720C4: got 'n.a.'
## Warning: Expecting numeric in D34721 / R34721C4: got 'n.a.'
## Warning: Expecting numeric in D34722 / R34722C4: got 'n.a.'
## Warning: Expecting numeric in D34723 / R34723C4: got 'n.a.'
## Warning: Expecting numeric in D34724 / R34724C4: got 'n.a.'
## Warning: Expecting numeric in D34725 / R34725C4: got 'n.a.'
## Warning: Expecting numeric in D34726 / R34726C4: got 'n.a.'
## Warning: Expecting numeric in D34727 / R34727C4: got 'n.a.'
## Warning: Expecting numeric in D34728 / R34728C4: got 'n.a.'
## Warning: Expecting numeric in D34729 / R34729C4: got 'n.a.'
## Warning: Expecting numeric in D34730 / R34730C4: got 'n.a.'
## Warning: Expecting numeric in D34731 / R34731C4: got 'n.a.'
## Warning: Expecting numeric in D34732 / R34732C4: got 'n.a.'
## Warning: Expecting numeric in D34733 / R34733C4: got 'n.a.'
## Warning: Expecting numeric in D34734 / R34734C4: got 'n.a.'
## Warning: Expecting numeric in D34735 / R34735C4: got 'n.a.'
## Warning: Expecting numeric in D34736 / R34736C4: got 'n.a.'
## Warning: Expecting numeric in D34737 / R34737C4: got 'n.a.'
## Warning: Expecting numeric in D34738 / R34738C4: got 'n.a.'
## Warning: Expecting numeric in D34739 / R34739C4: got 'n.a.'
## Warning: Expecting numeric in D34740 / R34740C4: got 'n.a.'
## Warning: Expecting numeric in D34741 / R34741C4: got 'n.a.'
## Warning: Expecting numeric in D34742 / R34742C4: got 'n.a.'
## Warning: Expecting numeric in D34743 / R34743C4: got 'n.a.'
## Warning: Expecting numeric in D34744 / R34744C4: got 'n.a.'
## Warning: Expecting numeric in D34745 / R34745C4: got 'n.a.'
## Warning: Expecting numeric in D34746 / R34746C4: got 'n.a.'
## Warning: Expecting numeric in D34747 / R34747C4: got 'n.a.'
## Warning: Expecting numeric in D34748 / R34748C4: got 'n.a.'
## Warning: Expecting numeric in D34749 / R34749C4: got 'n.a.'
## Warning: Expecting numeric in D34750 / R34750C4: got 'n.a.'
## Warning: Expecting numeric in D34751 / R34751C4: got 'n.a.'
## Warning: Expecting numeric in D34752 / R34752C4: got 'n.a.'
## Warning: Expecting numeric in D34753 / R34753C4: got 'n.a.'
## Warning: Expecting numeric in D34754 / R34754C4: got 'n.a.'
## Warning: Expecting numeric in D34755 / R34755C4: got 'n.a.'
## Warning: Expecting numeric in D34756 / R34756C4: got 'n.a.'
## Warning: Expecting numeric in D34757 / R34757C4: got 'n.a.'
## Warning: Expecting numeric in D34758 / R34758C4: got 'n.a.'
## Warning: Expecting numeric in D34759 / R34759C4: got 'n.a.'
## Warning: Expecting numeric in D34760 / R34760C4: got 'n.a.'
## Warning: Expecting numeric in D34761 / R34761C4: got 'n.a.'
## Warning: Expecting numeric in D34762 / R34762C4: got 'n.a.'
## Warning: Expecting numeric in D34763 / R34763C4: got 'n.a.'
## Warning: Expecting numeric in D34764 / R34764C4: got 'n.a.'
## Warning: Expecting numeric in D34765 / R34765C4: got 'n.a.'
## Warning: Expecting numeric in D34766 / R34766C4: got 'n.a.'
## Warning: Expecting numeric in D34767 / R34767C4: got 'n.a.'
## Warning: Expecting numeric in D34768 / R34768C4: got 'n.a.'
## Warning: Expecting numeric in D34769 / R34769C4: got 'n.a.'
## Warning: Expecting numeric in D34770 / R34770C4: got 'n.a.'
## Warning: Expecting numeric in D34771 / R34771C4: got 'n.a.'
## Warning: Expecting numeric in D34772 / R34772C4: got 'n.a.'
## Warning: Expecting numeric in D34773 / R34773C4: got 'n.a.'
## Warning: Expecting numeric in D34774 / R34774C4: got 'n.a.'
## Warning: Expecting numeric in D34775 / R34775C4: got 'n.a.'
## Warning: Expecting numeric in D34776 / R34776C4: got 'n.a.'
## Warning: Expecting numeric in D34777 / R34777C4: got 'n.a.'
## Warning: Expecting numeric in D34778 / R34778C4: got 'n.a.'
## Warning: Expecting numeric in D34779 / R34779C4: got 'n.a.'
## Warning: Expecting numeric in D34780 / R34780C4: got 'n.a.'
## Warning: Expecting numeric in D34781 / R34781C4: got 'n.a.'
## Warning: Expecting numeric in D34782 / R34782C4: got 'n.a.'
## Warning: Expecting numeric in D34783 / R34783C4: got 'n.a.'
## Warning: Expecting numeric in D34784 / R34784C4: got 'n.a.'
## Warning: Expecting numeric in D34785 / R34785C4: got 'n.a.'
## Warning: Expecting numeric in D34786 / R34786C4: got 'n.a.'
## Warning: Expecting numeric in D34787 / R34787C4: got 'n.a.'
## Warning: Expecting numeric in D34788 / R34788C4: got 'n.a.'
## Warning: Expecting numeric in D34789 / R34789C4: got 'n.a.'
## Warning: Expecting numeric in D34790 / R34790C4: got 'n.a.'
## Warning: Expecting numeric in D34791 / R34791C4: got 'n.a.'
## Warning: Expecting numeric in D34792 / R34792C4: got 'n.a.'
## Warning: Expecting numeric in D34793 / R34793C4: got 'n.a.'
## Warning: Expecting numeric in D34794 / R34794C4: got 'n.a.'
## Warning: Expecting numeric in D34795 / R34795C4: got 'n.a.'
## Warning: Expecting numeric in D34796 / R34796C4: got 'n.a.'
## Warning: Expecting numeric in D34797 / R34797C4: got 'n.a.'
## Warning: Expecting numeric in D34798 / R34798C4: got 'n.a.'
## Warning: Expecting numeric in D34799 / R34799C4: got 'n.a.'
## Warning: Expecting numeric in D34800 / R34800C4: got 'n.a.'
## Warning: Expecting numeric in D34801 / R34801C4: got 'n.a.'
## Warning: Expecting numeric in D34802 / R34802C4: got 'n.a.'
## Warning: Expecting numeric in D34803 / R34803C4: got 'n.a.'
## Warning: Expecting numeric in D34804 / R34804C4: got 'n.a.'
## Warning: Expecting numeric in D34805 / R34805C4: got 'n.a.'
## Warning: Expecting numeric in D34806 / R34806C4: got 'n.a.'
## Warning: Expecting numeric in D34807 / R34807C4: got 'n.a.'
## Warning: Expecting numeric in D34808 / R34808C4: got 'n.a.'
## Warning: Expecting numeric in D34809 / R34809C4: got 'n.a.'
## Warning: Expecting numeric in D34810 / R34810C4: got 'n.a.'
## Warning: Expecting numeric in D34811 / R34811C4: got 'n.a.'
## Warning: Expecting numeric in D34812 / R34812C4: got 'n.a.'
## Warning: Expecting numeric in D34813 / R34813C4: got 'n.a.'
## Warning: Expecting numeric in D34814 / R34814C4: got 'n.a.'
## Warning: Expecting numeric in D34815 / R34815C4: got 'n.a.'
## Warning: Expecting numeric in D34816 / R34816C4: got 'n.a.'
## Warning: Expecting numeric in D34817 / R34817C4: got 'n.a.'
## Warning: Expecting numeric in D34818 / R34818C4: got 'n.a.'
## Warning: Expecting numeric in D34819 / R34819C4: got 'n.a.'
## Warning: Expecting numeric in D34820 / R34820C4: got 'n.a.'
## Warning: Expecting numeric in D34821 / R34821C4: got 'n.a.'
## Warning: Expecting numeric in D34822 / R34822C4: got 'n.a.'
## Warning: Expecting numeric in D34823 / R34823C4: got 'n.a.'
## Warning: Expecting numeric in D34824 / R34824C4: got 'n.a.'
## Warning: Expecting numeric in D34825 / R34825C4: got 'n.a.'
## Warning: Expecting numeric in D34826 / R34826C4: got 'n.a.'
## Warning: Expecting numeric in D34827 / R34827C4: got 'n.a.'
## Warning: Expecting numeric in D34828 / R34828C4: got 'n.a.'
## Warning: Expecting numeric in D34829 / R34829C4: got 'n.a.'
## Warning: Expecting numeric in D34830 / R34830C4: got 'n.a.'
## Warning: Expecting numeric in D34831 / R34831C4: got 'n.a.'
## Warning: Expecting numeric in D34832 / R34832C4: got 'n.a.'
## Warning: Expecting numeric in D34833 / R34833C4: got 'n.a.'
## Warning: Expecting numeric in D34834 / R34834C4: got 'n.a.'
## Warning: Expecting numeric in D34835 / R34835C4: got 'n.a.'
## Warning: Expecting numeric in D34836 / R34836C4: got 'n.a.'
## Warning: Expecting numeric in D34837 / R34837C4: got 'n.a.'
## Warning: Expecting numeric in D34838 / R34838C4: got 'n.a.'
## Warning: Expecting numeric in D34839 / R34839C4: got 'n.a.'
## Warning: Expecting numeric in D34840 / R34840C4: got 'n.a.'
## Warning: Expecting numeric in D34841 / R34841C4: got 'n.a.'
## Warning: Expecting numeric in D34842 / R34842C4: got 'n.a.'
## Warning: Expecting numeric in D34843 / R34843C4: got 'n.a.'
## Warning: Expecting numeric in D34844 / R34844C4: got 'n.a.'
## Warning: Expecting numeric in D34845 / R34845C4: got 'n.a.'
## Warning: Expecting numeric in D34846 / R34846C4: got 'n.a.'
## Warning: Expecting numeric in D34847 / R34847C4: got 'n.a.'
## Warning: Expecting numeric in D34848 / R34848C4: got 'n.a.'
## Warning: Expecting numeric in D34849 / R34849C4: got 'n.a.'
## Warning: Expecting numeric in D34850 / R34850C4: got 'n.a.'
## Warning: Expecting numeric in D34851 / R34851C4: got 'n.a.'
## Warning: Expecting numeric in D34852 / R34852C4: got 'n.a.'
## Warning: Expecting numeric in D34853 / R34853C4: got 'n.a.'
## Warning: Expecting numeric in D34854 / R34854C4: got 'n.a.'
## Warning: Expecting numeric in D34855 / R34855C4: got 'n.a.'
## Warning: Expecting numeric in D34856 / R34856C4: got 'n.a.'
## Warning: Expecting numeric in D34857 / R34857C4: got 'n.a.'
## Warning: Expecting numeric in D34858 / R34858C4: got 'n.a.'
## Warning: Expecting numeric in D34859 / R34859C4: got 'n.a.'
## Warning: Expecting numeric in D34860 / R34860C4: got 'n.a.'
## Warning: Expecting numeric in D34861 / R34861C4: got 'n.a.'
## Warning: Expecting numeric in D34862 / R34862C4: got 'n.a.'
## Warning: Expecting numeric in D34863 / R34863C4: got 'n.a.'
## Warning: Expecting numeric in D34864 / R34864C4: got 'n.a.'
## Warning: Expecting numeric in D34865 / R34865C4: got 'n.a.'
## Warning: Expecting numeric in D34866 / R34866C4: got 'n.a.'
## Warning: Expecting numeric in D34867 / R34867C4: got 'n.a.'
## Warning: Expecting numeric in D34868 / R34868C4: got 'n.a.'
## Warning: Expecting numeric in D34869 / R34869C4: got 'n.a.'
## Warning: Expecting numeric in D34870 / R34870C4: got 'n.a.'
## Warning: Expecting numeric in D34871 / R34871C4: got 'n.a.'
## Warning: Expecting numeric in D34872 / R34872C4: got 'n.a.'
## Warning: Expecting numeric in D34873 / R34873C4: got 'n.a.'
## Warning: Expecting numeric in D34874 / R34874C4: got 'n.a.'
## Warning: Expecting numeric in D34875 / R34875C4: got 'n.a.'
## Warning: Expecting numeric in D34876 / R34876C4: got 'n.a.'
## Warning: Expecting numeric in D34877 / R34877C4: got 'n.a.'
## Warning: Expecting numeric in D34878 / R34878C4: got 'n.a.'
## Warning: Expecting numeric in D34879 / R34879C4: got 'n.a.'
## Warning: Expecting numeric in D34880 / R34880C4: got 'n.a.'
## Warning: Expecting numeric in D34881 / R34881C4: got 'n.a.'
## Warning: Expecting numeric in D34882 / R34882C4: got 'n.a.'
## Warning: Expecting numeric in D34883 / R34883C4: got 'n.a.'
## Warning: Expecting numeric in D34884 / R34884C4: got 'n.a.'
## Warning: Expecting numeric in D34885 / R34885C4: got 'n.a.'
## Warning: Expecting numeric in D34886 / R34886C4: got 'n.a.'
## Warning: Expecting numeric in D34887 / R34887C4: got 'n.a.'
## Warning: Expecting numeric in D34888 / R34888C4: got 'n.a.'
## Warning: Expecting numeric in D34889 / R34889C4: got 'n.a.'
## Warning: Expecting numeric in D34890 / R34890C4: got 'n.a.'
## Warning: Expecting numeric in D34891 / R34891C4: got 'n.a.'
## Warning: Expecting numeric in D34892 / R34892C4: got 'n.a.'
## Warning: Expecting numeric in D34893 / R34893C4: got 'n.a.'
## Warning: Expecting numeric in D34894 / R34894C4: got 'n.a.'
## Warning: Expecting numeric in D34895 / R34895C4: got 'n.a.'
## Warning: Expecting numeric in D34896 / R34896C4: got 'n.a.'
## Warning: Expecting numeric in D34897 / R34897C4: got 'n.a.'
## Warning: Expecting numeric in D34898 / R34898C4: got 'n.a.'
## Warning: Expecting numeric in D34899 / R34899C4: got 'n.a.'
## Warning: Expecting numeric in D34900 / R34900C4: got 'n.a.'
## Warning: Expecting numeric in D34901 / R34901C4: got 'n.a.'
## Warning: Expecting numeric in D34902 / R34902C4: got 'n.a.'
## Warning: Expecting numeric in D34903 / R34903C4: got 'n.a.'
## Warning: Expecting numeric in D34904 / R34904C4: got 'n.a.'
## Warning: Expecting numeric in D34905 / R34905C4: got 'n.a.'
## Warning: Expecting numeric in D34906 / R34906C4: got 'n.a.'
## Warning: Expecting numeric in D34907 / R34907C4: got 'n.a.'
## Warning: Expecting numeric in D34908 / R34908C4: got 'n.a.'
## Warning: Expecting numeric in D34909 / R34909C4: got 'n.a.'
## Warning: Expecting numeric in D34910 / R34910C4: got 'n.a.'
## Warning: Expecting numeric in D34911 / R34911C4: got 'n.a.'
## Warning: Expecting numeric in D34912 / R34912C4: got 'n.a.'
## Warning: Expecting numeric in D34913 / R34913C4: got 'n.a.'
## Warning: Expecting numeric in D34914 / R34914C4: got 'n.a.'
## Warning: Expecting numeric in D34915 / R34915C4: got 'n.a.'
## Warning: Expecting numeric in D34916 / R34916C4: got 'n.a.'
## Warning: Expecting numeric in D34917 / R34917C4: got 'n.a.'
## Warning: Expecting numeric in D34918 / R34918C4: got 'n.a.'
## Warning: Expecting numeric in D34919 / R34919C4: got 'n.a.'
## Warning: Expecting numeric in D34920 / R34920C4: got 'n.a.'
## Warning: Expecting numeric in D34921 / R34921C4: got 'n.a.'
## Warning: Expecting numeric in D34922 / R34922C4: got 'n.a.'
## Warning: Expecting numeric in D34923 / R34923C4: got 'n.a.'
## Warning: Expecting numeric in D34924 / R34924C4: got 'n.a.'
## Warning: Expecting numeric in D34925 / R34925C4: got 'n.a.'
## Warning: Expecting numeric in D34926 / R34926C4: got 'n.a.'
## Warning: Expecting numeric in D34927 / R34927C4: got 'n.a.'
## Warning: Expecting numeric in D34928 / R34928C4: got 'n.a.'
## Warning: Expecting numeric in D34929 / R34929C4: got 'n.a.'
## Warning: Expecting numeric in D34930 / R34930C4: got 'n.a.'
## Warning: Expecting numeric in D34931 / R34931C4: got 'n.a.'
## Warning: Expecting numeric in D34932 / R34932C4: got 'n.a.'
## Warning: Expecting numeric in D34933 / R34933C4: got 'n.a.'
## Warning: Expecting numeric in D34934 / R34934C4: got 'n.a.'
## Warning: Expecting numeric in D34935 / R34935C4: got 'n.a.'
## Warning: Expecting numeric in D34936 / R34936C4: got 'n.a.'
## Warning: Expecting numeric in D34937 / R34937C4: got 'n.a.'
## Warning: Expecting numeric in D34938 / R34938C4: got 'n.a.'
## Warning: Expecting numeric in D34939 / R34939C4: got 'n.a.'
## Warning: Expecting numeric in D34940 / R34940C4: got 'n.a.'
## Warning: Expecting numeric in D34941 / R34941C4: got 'n.a.'
## Warning: Expecting numeric in D34942 / R34942C4: got 'n.a.'
## Warning: Expecting numeric in D34943 / R34943C4: got 'n.a.'
## Warning: Expecting numeric in D34944 / R34944C4: got 'n.a.'
## Warning: Expecting numeric in D34945 / R34945C4: got 'n.a.'
## Warning: Expecting numeric in D34946 / R34946C4: got 'n.a.'
## Warning: Expecting numeric in D34947 / R34947C4: got 'n.a.'
## Warning: Expecting numeric in D34948 / R34948C4: got 'n.a.'
## Warning: Expecting numeric in D34949 / R34949C4: got 'n.a.'
## Warning: Expecting numeric in D34950 / R34950C4: got 'n.a.'
## Warning: Expecting numeric in D34951 / R34951C4: got 'n.a.'
## Warning: Expecting numeric in D34952 / R34952C4: got 'n.a.'
## Warning: Expecting numeric in D34953 / R34953C4: got 'n.a.'
## Warning: Expecting numeric in D34954 / R34954C4: got 'n.a.'
## Warning: Expecting numeric in D34955 / R34955C4: got 'n.a.'
## Warning: Expecting numeric in D34956 / R34956C4: got 'n.a.'
## Warning: Expecting numeric in D34957 / R34957C4: got 'n.a.'
## Warning: Expecting numeric in D34958 / R34958C4: got 'n.a.'
## Warning: Expecting numeric in D34959 / R34959C4: got 'n.a.'
## Warning: Expecting numeric in D34960 / R34960C4: got 'n.a.'
## Warning: Expecting numeric in D34961 / R34961C4: got 'n.a.'
## Warning: Expecting numeric in D34962 / R34962C4: got 'n.a.'
## Warning: Expecting numeric in D34963 / R34963C4: got 'n.a.'
## Warning: Expecting numeric in D34964 / R34964C4: got 'n.a.'
## Warning: Expecting numeric in D34965 / R34965C4: got 'n.a.'
## Warning: Expecting numeric in D34966 / R34966C4: got 'n.a.'
## Warning: Expecting numeric in D34967 / R34967C4: got 'n.a.'
## Warning: Expecting numeric in D34968 / R34968C4: got 'n.a.'
## Warning: Expecting numeric in D34969 / R34969C4: got 'n.a.'
## Warning: Expecting numeric in D34970 / R34970C4: got 'n.a.'
## Warning: Expecting numeric in D34971 / R34971C4: got 'n.a.'
## Warning: Expecting numeric in D34972 / R34972C4: got 'n.a.'
## Warning: Expecting numeric in D34973 / R34973C4: got 'n.a.'
## Warning: Expecting numeric in D34974 / R34974C4: got 'n.a.'
## Warning: Expecting numeric in D34975 / R34975C4: got 'n.a.'
## Warning: Expecting numeric in D34976 / R34976C4: got 'n.a.'
## Warning: Expecting numeric in D34977 / R34977C4: got 'n.a.'
## Warning: Expecting numeric in D34978 / R34978C4: got 'n.a.'
## Warning: Expecting numeric in D34979 / R34979C4: got 'n.a.'
## Warning: Expecting numeric in D34980 / R34980C4: got 'n.a.'
## Warning: Expecting numeric in D34981 / R34981C4: got 'n.a.'
## Warning: Expecting numeric in D34982 / R34982C4: got 'n.a.'
## Warning: Expecting numeric in D34983 / R34983C4: got 'n.a.'
## Warning: Expecting numeric in D34984 / R34984C4: got 'n.a.'
## Warning: Expecting numeric in D34985 / R34985C4: got 'n.a.'
## Warning: Expecting numeric in D34986 / R34986C4: got 'n.a.'
## Warning: Expecting numeric in D34987 / R34987C4: got 'n.a.'
## Warning: Expecting numeric in D34988 / R34988C4: got 'n.a.'
## Warning: Expecting numeric in D34989 / R34989C4: got 'n.a.'
## Warning: Expecting numeric in D34990 / R34990C4: got 'n.a.'
## Warning: Expecting numeric in D34991 / R34991C4: got 'n.a.'
## Warning: Expecting numeric in D34992 / R34992C4: got 'n.a.'
## Warning: Expecting numeric in D34993 / R34993C4: got 'n.a.'
## Warning: Expecting numeric in D34994 / R34994C4: got 'n.a.'
## Warning: Expecting numeric in D34995 / R34995C4: got 'n.a.'
## Warning: Expecting numeric in D34996 / R34996C4: got 'n.a.'
## Warning: Expecting numeric in D34997 / R34997C4: got 'n.a.'
## Warning: Expecting numeric in D34998 / R34998C4: got 'n.a.'
## Warning: Expecting numeric in D34999 / R34999C4: got 'n.a.'
## Warning: Expecting numeric in D35000 / R35000C4: got 'n.a.'
## Warning: Expecting numeric in D35001 / R35001C4: got 'n.a.'
## Warning: Expecting numeric in D35002 / R35002C4: got 'n.a.'
## Warning: Expecting numeric in D35003 / R35003C4: got 'n.a.'
## Warning: Expecting numeric in D35004 / R35004C4: got 'n.a.'
## Warning: Expecting numeric in D35005 / R35005C4: got 'n.a.'
## Warning: Expecting numeric in D35006 / R35006C4: got 'n.a.'
## Warning: Expecting numeric in D35007 / R35007C4: got 'n.a.'
## Warning: Expecting numeric in D35008 / R35008C4: got 'n.a.'
## Warning: Expecting numeric in D35009 / R35009C4: got 'n.a.'
## Warning: Expecting numeric in D35010 / R35010C4: got 'n.a.'
## Warning: Expecting numeric in D35011 / R35011C4: got 'n.a.'
## Warning: Expecting numeric in D35012 / R35012C4: got 'n.a.'
## Warning: Expecting numeric in D35013 / R35013C4: got 'n.a.'
## Warning: Expecting numeric in D35014 / R35014C4: got 'n.a.'
## Warning: Expecting numeric in D35015 / R35015C4: got 'n.a.'
## Warning: Expecting numeric in D35016 / R35016C4: got 'n.a.'
## Warning: Expecting numeric in D35017 / R35017C4: got 'n.a.'
## Warning: Expecting numeric in D35018 / R35018C4: got 'n.a.'
## Warning: Expecting numeric in D35019 / R35019C4: got 'n.a.'
## Warning: Expecting numeric in D35020 / R35020C4: got 'n.a.'
## Warning: Expecting numeric in D35021 / R35021C4: got 'n.a.'
## Warning: Expecting numeric in D35022 / R35022C4: got 'n.a.'
## Warning: Expecting numeric in D35023 / R35023C4: got 'n.a.'
## Warning: Expecting numeric in D35024 / R35024C4: got 'n.a.'
## Warning: Expecting numeric in D35025 / R35025C4: got 'n.a.'
## Warning: Expecting numeric in D35026 / R35026C4: got 'n.a.'
## Warning: Expecting numeric in D35027 / R35027C4: got 'n.a.'
## Warning: Expecting numeric in D35028 / R35028C4: got 'n.a.'
## Warning: Expecting numeric in D35029 / R35029C4: got 'n.a.'
## Warning: Expecting numeric in D35030 / R35030C4: got 'n.a.'
## Warning: Expecting numeric in D35031 / R35031C4: got 'n.a.'
## Warning: Expecting numeric in D35032 / R35032C4: got 'n.a.'
## Warning: Expecting numeric in D35033 / R35033C4: got 'n.a.'
## Warning: Expecting numeric in D35034 / R35034C4: got 'n.a.'
## Warning: Expecting numeric in D35035 / R35035C4: got 'n.a.'
## Warning: Expecting numeric in D35036 / R35036C4: got 'n.a.'
## Warning: Expecting numeric in D35037 / R35037C4: got 'n.a.'
## Warning: Expecting numeric in D35038 / R35038C4: got 'n.a.'
## Warning: Expecting numeric in D35039 / R35039C4: got 'n.a.'
## Warning: Expecting numeric in D35040 / R35040C4: got 'n.a.'
## Warning: Expecting numeric in D35041 / R35041C4: got 'n.a.'
## Warning: Expecting numeric in D35042 / R35042C4: got 'n.a.'
## Warning: Expecting numeric in D35043 / R35043C4: got 'n.a.'
## Warning: Expecting numeric in D35044 / R35044C4: got 'n.a.'
## Warning: Expecting numeric in D35045 / R35045C4: got 'n.a.'
## Warning: Expecting numeric in D35046 / R35046C4: got 'n.a.'
## Warning: Expecting numeric in D35047 / R35047C4: got 'n.a.'
## Warning: Expecting numeric in D35048 / R35048C4: got 'n.a.'
## Warning: Expecting numeric in D35049 / R35049C4: got 'n.a.'
## Warning: Expecting numeric in D35050 / R35050C4: got 'n.a.'
## Warning: Expecting numeric in D35051 / R35051C4: got 'n.a.'
## Warning: Expecting numeric in D35052 / R35052C4: got 'n.a.'
## Warning: Expecting numeric in D35053 / R35053C4: got 'n.a.'
## Warning: Expecting numeric in D35054 / R35054C4: got 'n.a.'
## Warning: Expecting numeric in D35055 / R35055C4: got 'n.a.'
## Warning: Expecting numeric in D35056 / R35056C4: got 'n.a.'
## Warning: Expecting numeric in D35057 / R35057C4: got 'n.a.'
## Warning: Expecting numeric in D35058 / R35058C4: got 'n.a.'
## Warning: Expecting numeric in D35059 / R35059C4: got 'n.a.'
## Warning: Expecting numeric in D35060 / R35060C4: got 'n.a.'
## Warning: Expecting numeric in D35061 / R35061C4: got 'n.a.'
## Warning: Expecting numeric in D35062 / R35062C4: got 'n.a.'
## Warning: Expecting numeric in D35063 / R35063C4: got 'n.a.'
## Warning: Expecting numeric in D35064 / R35064C4: got 'n.a.'
## Warning: Expecting numeric in D35065 / R35065C4: got 'n.a.'
## Warning: Expecting numeric in D35066 / R35066C4: got 'n.a.'
## Warning: Expecting numeric in D35067 / R35067C4: got 'n.a.'
## Warning: Expecting numeric in D35068 / R35068C4: got 'n.a.'
## Warning: Expecting numeric in D35069 / R35069C4: got 'n.a.'
## Warning: Expecting numeric in D35070 / R35070C4: got 'n.a.'
## Warning: Expecting numeric in D35071 / R35071C4: got 'n.a.'
## Warning: Expecting numeric in D35072 / R35072C4: got 'n.a.'
## Warning: Expecting numeric in D35073 / R35073C4: got 'n.a.'
## Warning: Expecting numeric in D35074 / R35074C4: got 'n.a.'
## Warning: Expecting numeric in D35075 / R35075C4: got 'n.a.'
## Warning: Expecting numeric in D35076 / R35076C4: got 'n.a.'
## Warning: Expecting numeric in D35077 / R35077C4: got 'n.a.'
## Warning: Expecting numeric in D35078 / R35078C4: got 'n.a.'
## Warning: Expecting numeric in D35079 / R35079C4: got 'n.a.'
## Warning: Expecting numeric in D35080 / R35080C4: got 'n.a.'
## Warning: Expecting numeric in D35081 / R35081C4: got 'n.a.'
## Warning: Expecting numeric in D35082 / R35082C4: got 'n.a.'
## Warning: Expecting numeric in D35083 / R35083C4: got 'n.a.'
## Warning: Expecting numeric in D35084 / R35084C4: got 'n.a.'
## Warning: Expecting numeric in D35085 / R35085C4: got 'n.a.'
## Warning: Expecting numeric in D35086 / R35086C4: got 'n.a.'
## Warning: Expecting numeric in D35087 / R35087C4: got 'n.a.'
## Warning: Expecting numeric in D35088 / R35088C4: got 'n.a.'
## Warning: Expecting numeric in D35089 / R35089C4: got 'n.a.'
## Warning: Expecting numeric in D35090 / R35090C4: got 'n.a.'
## Warning: Expecting numeric in D35091 / R35091C4: got 'n.a.'
## Warning: Expecting numeric in D35092 / R35092C4: got 'n.a.'
## Warning: Expecting numeric in D35093 / R35093C4: got 'n.a.'
## Warning: Expecting numeric in D35094 / R35094C4: got 'n.a.'
## Warning: Expecting numeric in D35095 / R35095C4: got 'n.a.'
## Warning: Expecting numeric in D35096 / R35096C4: got 'n.a.'
## Warning: Expecting numeric in D35097 / R35097C4: got 'n.a.'
## Warning: Expecting numeric in D35098 / R35098C4: got 'n.a.'
## Warning: Expecting numeric in D35099 / R35099C4: got 'n.a.'
## Warning: Expecting numeric in D35100 / R35100C4: got 'n.a.'
## Warning: Expecting numeric in D35101 / R35101C4: got 'n.a.'
## Warning: Expecting numeric in D35102 / R35102C4: got 'n.a.'
## Warning: Expecting numeric in D35103 / R35103C4: got 'n.a.'
## Warning: Expecting numeric in D35104 / R35104C4: got 'n.a.'
## Warning: Expecting numeric in D35105 / R35105C4: got 'n.a.'
## Warning: Expecting numeric in D35106 / R35106C4: got 'n.a.'
## Warning: Expecting numeric in D35107 / R35107C4: got 'n.a.'
## Warning: Expecting numeric in D35108 / R35108C4: got 'n.a.'
## Warning: Expecting numeric in D35109 / R35109C4: got 'n.a.'
## Warning: Expecting numeric in D35110 / R35110C4: got 'n.a.'
## Warning: Expecting numeric in D35111 / R35111C4: got 'n.a.'
## Warning: Expecting numeric in D35112 / R35112C4: got 'n.a.'
## Warning: Expecting numeric in D35113 / R35113C4: got 'n.a.'
## Warning: Expecting numeric in D35114 / R35114C4: got 'n.a.'
## Warning: Expecting numeric in D35115 / R35115C4: got 'n.a.'
## Warning: Expecting numeric in D35116 / R35116C4: got 'n.a.'
## Warning: Expecting numeric in D35117 / R35117C4: got 'n.a.'
## Warning: Expecting numeric in D35118 / R35118C4: got 'n.a.'
## Warning: Expecting numeric in D35119 / R35119C4: got 'n.a.'
## Warning: Expecting numeric in D35120 / R35120C4: got 'n.a.'
## Warning: Expecting numeric in D35121 / R35121C4: got 'n.a.'
## Warning: Expecting numeric in D35122 / R35122C4: got 'n.a.'
## Warning: Expecting numeric in D35123 / R35123C4: got 'n.a.'
## Warning: Expecting numeric in D35124 / R35124C4: got 'n.a.'
## Warning: Expecting numeric in D35125 / R35125C4: got 'n.a.'
## Warning: Expecting numeric in D35126 / R35126C4: got 'n.a.'
## Warning: Expecting numeric in D35127 / R35127C4: got 'n.a.'
## Warning: Expecting numeric in D35128 / R35128C4: got 'n.a.'
## Warning: Expecting numeric in D35129 / R35129C4: got 'n.a.'
## Warning: Expecting numeric in D35130 / R35130C4: got 'n.a.'
## Warning: Expecting numeric in D35131 / R35131C4: got 'n.a.'
## Warning: Expecting numeric in D35132 / R35132C4: got 'n.a.'
## Warning: Expecting numeric in D35133 / R35133C4: got 'n.a.'
## Warning: Expecting numeric in D35134 / R35134C4: got 'n.a.'
## Warning: Expecting numeric in D35135 / R35135C4: got 'n.a.'
## Warning: Expecting numeric in D35136 / R35136C4: got 'n.a.'
## Warning: Expecting numeric in D35137 / R35137C4: got 'n.a.'
## Warning: Expecting numeric in D35138 / R35138C4: got 'n.a.'
## Warning: Expecting numeric in D35139 / R35139C4: got 'n.a.'
## Warning: Expecting numeric in D35140 / R35140C4: got 'n.a.'
## Warning: Expecting numeric in D35141 / R35141C4: got 'n.a.'
## Warning: Expecting numeric in D35142 / R35142C4: got 'n.a.'
## Warning: Expecting numeric in D35143 / R35143C4: got 'n.a.'
## Warning: Expecting numeric in D35144 / R35144C4: got 'n.a.'
## Warning: Expecting numeric in D35145 / R35145C4: got 'n.a.'
## Warning: Expecting numeric in D35146 / R35146C4: got 'n.a.'
## Warning: Expecting numeric in D35147 / R35147C4: got 'n.a.'
## Warning: Expecting numeric in D35148 / R35148C4: got 'n.a.'
## Warning: Expecting numeric in D35149 / R35149C4: got 'n.a.'
## Warning: Expecting numeric in D35150 / R35150C4: got 'n.a.'
## Warning: Expecting numeric in D35151 / R35151C4: got 'n.a.'
## Warning: Expecting numeric in D35152 / R35152C4: got 'n.a.'
## Warning: Expecting numeric in D35153 / R35153C4: got 'n.a.'
## Warning: Expecting numeric in D35154 / R35154C4: got 'n.a.'
## Warning: Expecting numeric in D35155 / R35155C4: got 'n.a.'
## Warning: Expecting numeric in D35156 / R35156C4: got 'n.a.'
## Warning: Expecting numeric in D35157 / R35157C4: got 'n.a.'
## Warning: Expecting numeric in D35158 / R35158C4: got 'n.a.'
## Warning: Expecting numeric in D35159 / R35159C4: got 'n.a.'
## Warning: Expecting numeric in D35160 / R35160C4: got 'n.a.'
## Warning: Expecting numeric in D35161 / R35161C4: got 'n.a.'
## Warning: Expecting numeric in D35162 / R35162C4: got 'n.a.'
## Warning: Expecting numeric in D35163 / R35163C4: got 'n.a.'
## Warning: Expecting numeric in D35164 / R35164C4: got 'n.a.'
## Warning: Expecting numeric in D35165 / R35165C4: got 'n.a.'
## Warning: Expecting numeric in D35166 / R35166C4: got 'n.a.'
## Warning: Expecting numeric in D35167 / R35167C4: got 'n.a.'
## Warning: Expecting numeric in D35168 / R35168C4: got 'n.a.'
## Warning: Expecting numeric in D35169 / R35169C4: got 'n.a.'
## Warning: Expecting numeric in D35170 / R35170C4: got 'n.a.'
## Warning: Expecting numeric in D35171 / R35171C4: got 'n.a.'
## Warning: Expecting numeric in D35172 / R35172C4: got 'n.a.'
## Warning: Expecting numeric in D35173 / R35173C4: got 'n.a.'
## Warning: Expecting numeric in D35174 / R35174C4: got 'n.a.'
## Warning: Expecting numeric in D35175 / R35175C4: got 'n.a.'
## Warning: Expecting numeric in D35176 / R35176C4: got 'n.a.'
## Warning: Expecting numeric in D35177 / R35177C4: got 'n.a.'
## Warning: Expecting numeric in D35178 / R35178C4: got 'n.a.'
## Warning: Expecting numeric in D35179 / R35179C4: got 'n.a.'
## Warning: Expecting numeric in D35180 / R35180C4: got 'n.a.'
## Warning: Expecting numeric in D35181 / R35181C4: got 'n.a.'
## Warning: Expecting numeric in D35182 / R35182C4: got 'n.a.'
## Warning: Expecting numeric in D35183 / R35183C4: got 'n.a.'
## Warning: Expecting numeric in D35184 / R35184C4: got 'n.a.'
## Warning: Expecting numeric in D35185 / R35185C4: got 'n.a.'
## Warning: Expecting numeric in D35186 / R35186C4: got 'n.a.'
## Warning: Expecting numeric in D35187 / R35187C4: got 'n.a.'
## Warning: Expecting numeric in D35188 / R35188C4: got 'n.a.'
## Warning: Expecting numeric in D35189 / R35189C4: got 'n.a.'
## Warning: Expecting numeric in D35190 / R35190C4: got 'n.a.'
## Warning: Expecting numeric in D35191 / R35191C4: got 'n.a.'
## Warning: Expecting numeric in D35192 / R35192C4: got 'n.a.'
## Warning: Expecting numeric in D35193 / R35193C4: got 'n.a.'
## Warning: Expecting numeric in D35194 / R35194C4: got 'n.a.'
## Warning: Expecting numeric in D35195 / R35195C4: got 'n.a.'
## Warning: Expecting numeric in D35196 / R35196C4: got 'n.a.'
## Warning: Expecting numeric in D35197 / R35197C4: got 'n.a.'
## Warning: Expecting numeric in D35198 / R35198C4: got 'n.a.'
## Warning: Expecting numeric in D35199 / R35199C4: got 'n.a.'
## Warning: Expecting numeric in D35200 / R35200C4: got 'n.a.'
## Warning: Expecting numeric in D35201 / R35201C4: got 'n.a.'
## Warning: Expecting numeric in D35202 / R35202C4: got 'n.a.'
## Warning: Expecting numeric in D35203 / R35203C4: got 'n.a.'
## Warning: Expecting numeric in D35204 / R35204C4: got 'n.a.'
## Warning: Expecting numeric in D35205 / R35205C4: got 'n.a.'
## Warning: Expecting numeric in D35206 / R35206C4: got 'n.a.'
## Warning: Expecting numeric in D35207 / R35207C4: got 'n.a.'
## Warning: Expecting numeric in D35208 / R35208C4: got 'n.a.'
## Warning: Expecting numeric in D35209 / R35209C4: got 'n.a.'
## Warning: Expecting numeric in D35210 / R35210C4: got 'n.a.'
## Warning: Expecting numeric in D35211 / R35211C4: got 'n.a.'
## Warning: Expecting numeric in D35212 / R35212C4: got 'n.a.'
## Warning: Expecting numeric in D35213 / R35213C4: got 'n.a.'
## Warning: Expecting numeric in D35214 / R35214C4: got 'n.a.'
## Warning: Expecting numeric in D35215 / R35215C4: got 'n.a.'
## Warning: Expecting numeric in D35216 / R35216C4: got 'n.a.'
## Warning: Expecting numeric in D35217 / R35217C4: got 'n.a.'
## Warning: Expecting numeric in D35218 / R35218C4: got 'n.a.'
## Warning: Expecting numeric in D35219 / R35219C4: got 'n.a.'
## Warning: Expecting numeric in D35220 / R35220C4: got 'n.a.'
## Warning: Expecting numeric in D35221 / R35221C4: got 'n.a.'
## Warning: Expecting numeric in D35222 / R35222C4: got 'n.a.'
## Warning: Expecting numeric in D35223 / R35223C4: got 'n.a.'
## Warning: Expecting numeric in D35224 / R35224C4: got 'n.a.'
## Warning: Expecting numeric in D35225 / R35225C4: got 'n.a.'
## Warning: Expecting numeric in D35226 / R35226C4: got 'n.a.'
## Warning: Expecting numeric in D35227 / R35227C4: got 'n.a.'
## Warning: Expecting numeric in D35228 / R35228C4: got 'n.a.'
## Warning: Expecting numeric in D35229 / R35229C4: got 'n.a.'
## Warning: Expecting numeric in D35230 / R35230C4: got 'n.a.'
## Warning: Expecting numeric in D35231 / R35231C4: got 'n.a.'
## Warning: Expecting numeric in D35232 / R35232C4: got 'n.a.'
## Warning: Expecting numeric in D35233 / R35233C4: got 'n.a.'
## Warning: Expecting numeric in D35234 / R35234C4: got 'n.a.'
## Warning: Expecting numeric in D35235 / R35235C4: got 'n.a.'
## Warning: Expecting numeric in D35236 / R35236C4: got 'n.a.'
## Warning: Expecting numeric in D35237 / R35237C4: got 'n.a.'
## Warning: Expecting numeric in D35238 / R35238C4: got 'n.a.'
## Warning: Expecting numeric in D35239 / R35239C4: got 'n.a.'
## Warning: Expecting numeric in D35240 / R35240C4: got 'n.a.'
## Warning: Expecting numeric in D35241 / R35241C4: got 'n.a.'
## Warning: Expecting numeric in D35242 / R35242C4: got 'n.a.'
## Warning: Expecting numeric in D35243 / R35243C4: got 'n.a.'
## Warning: Expecting numeric in D35244 / R35244C4: got 'n.a.'
## Warning: Expecting numeric in D35245 / R35245C4: got 'n.a.'
## Warning: Expecting numeric in D35246 / R35246C4: got 'n.a.'
## Warning: Expecting numeric in D35247 / R35247C4: got 'n.a.'
## Warning: Expecting numeric in D35248 / R35248C4: got 'n.a.'
## Warning: Expecting numeric in D35249 / R35249C4: got 'n.a.'
## Warning: Expecting numeric in D35250 / R35250C4: got 'n.a.'
## Warning: Expecting numeric in D35251 / R35251C4: got 'n.a.'
## Warning: Expecting numeric in D35252 / R35252C4: got 'n.a.'
## Warning: Expecting numeric in D35253 / R35253C4: got 'n.a.'
## Warning: Expecting numeric in D35254 / R35254C4: got 'n.a.'
## Warning: Expecting numeric in D35255 / R35255C4: got 'n.a.'
## Warning: Expecting numeric in D35256 / R35256C4: got 'n.a.'
## Warning: Expecting numeric in D35257 / R35257C4: got 'n.a.'
## Warning: Expecting numeric in D35258 / R35258C4: got 'n.a.'
## Warning: Expecting numeric in D35259 / R35259C4: got 'n.a.'
## Warning: Expecting numeric in D35260 / R35260C4: got 'n.a.'
## Warning: Expecting numeric in D35261 / R35261C4: got 'n.a.'
## Warning: Expecting numeric in D35262 / R35262C4: got 'n.a.'
## Warning: Expecting numeric in D35263 / R35263C4: got 'n.a.'
## Warning: Expecting numeric in D35264 / R35264C4: got 'n.a.'
## Warning: Expecting numeric in D35265 / R35265C4: got 'n.a.'
## Warning: Expecting numeric in D35266 / R35266C4: got 'n.a.'
## Warning: Expecting numeric in D35267 / R35267C4: got 'n.a.'
## Warning: Expecting numeric in D35268 / R35268C4: got 'n.a.'
## Warning: Expecting numeric in D35269 / R35269C4: got 'n.a.'
## Warning: Expecting numeric in D35270 / R35270C4: got 'n.a.'
## Warning: Expecting numeric in D35271 / R35271C4: got 'n.a.'
## Warning: Expecting numeric in D35272 / R35272C4: got 'n.a.'
## Warning: Expecting numeric in D35273 / R35273C4: got 'n.a.'
## Warning: Expecting numeric in D35274 / R35274C4: got 'n.a.'
## Warning: Expecting numeric in D35275 / R35275C4: got 'n.a.'
## Warning: Expecting numeric in D35276 / R35276C4: got 'n.a.'
## Warning: Expecting numeric in D35277 / R35277C4: got 'n.a.'
## Warning: Expecting numeric in D35278 / R35278C4: got 'n.a.'
## Warning: Expecting numeric in D35279 / R35279C4: got 'n.a.'
## Warning: Expecting numeric in D35280 / R35280C4: got 'n.a.'
## Warning: Expecting numeric in D35281 / R35281C4: got 'n.a.'
## Warning: Expecting numeric in D35282 / R35282C4: got 'n.a.'
## Warning: Expecting numeric in D35283 / R35283C4: got 'n.a.'
## Warning: Expecting numeric in D35284 / R35284C4: got 'n.a.'
## Warning: Expecting numeric in D35285 / R35285C4: got 'n.a.'
## Warning: Expecting numeric in D35286 / R35286C4: got 'n.a.'
## Warning: Expecting numeric in D35287 / R35287C4: got 'n.a.'
## Warning: Expecting numeric in D35288 / R35288C4: got 'n.a.'
## Warning: Expecting numeric in D35289 / R35289C4: got 'n.a.'
## Warning: Expecting numeric in D35290 / R35290C4: got 'n.a.'
## Warning: Expecting numeric in D35291 / R35291C4: got 'n.a.'
## Warning: Expecting numeric in D35292 / R35292C4: got 'n.a.'
## Warning: Expecting numeric in D35293 / R35293C4: got 'n.a.'
## Warning: Expecting numeric in D35294 / R35294C4: got 'n.a.'
## Warning: Expecting numeric in D35295 / R35295C4: got 'n.a.'
## Warning: Expecting numeric in D35296 / R35296C4: got 'n.a.'
## Warning: Expecting numeric in D35297 / R35297C4: got 'n.a.'
## Warning: Expecting numeric in D35298 / R35298C4: got 'n.a.'
## Warning: Expecting numeric in D35299 / R35299C4: got 'n.a.'
## Warning: Expecting numeric in D35300 / R35300C4: got 'n.a.'
## Warning: Expecting numeric in D35301 / R35301C4: got 'n.a.'
## Warning: Expecting numeric in D35302 / R35302C4: got 'n.a.'
## Warning: Expecting numeric in D35303 / R35303C4: got 'n.a.'
## Warning: Expecting numeric in D35304 / R35304C4: got 'n.a.'
## Warning: Expecting numeric in D35305 / R35305C4: got 'n.a.'
## Warning: Expecting numeric in D35306 / R35306C4: got 'n.a.'
## Warning: Expecting numeric in D35307 / R35307C4: got 'n.a.'
## Warning: Expecting numeric in D35308 / R35308C4: got 'n.a.'
## Warning: Expecting numeric in D35309 / R35309C4: got 'n.a.'
## Warning: Expecting numeric in D35310 / R35310C4: got 'n.a.'
## Warning: Expecting numeric in D35311 / R35311C4: got 'n.a.'
## Warning: Expecting numeric in D35312 / R35312C4: got 'n.a.'
## Warning: Expecting numeric in D35313 / R35313C4: got 'n.a.'
## Warning: Expecting numeric in D35314 / R35314C4: got 'n.a.'
## Warning: Expecting numeric in D35315 / R35315C4: got 'n.a.'
## Warning: Expecting numeric in D35316 / R35316C4: got 'n.a.'
## Warning: Expecting numeric in D35317 / R35317C4: got 'n.a.'
## Warning: Expecting numeric in D35318 / R35318C4: got 'n.a.'
## Warning: Expecting numeric in D35319 / R35319C4: got 'n.a.'
## Warning: Expecting numeric in D35320 / R35320C4: got 'n.a.'
## Warning: Expecting numeric in D35321 / R35321C4: got 'n.a.'
## Warning: Expecting numeric in D35322 / R35322C4: got 'n.a.'
## Warning: Expecting numeric in D35323 / R35323C4: got 'n.a.'
## Warning: Expecting numeric in D35324 / R35324C4: got 'n.a.'
## Warning: Expecting numeric in D35325 / R35325C4: got 'n.a.'
## Warning: Expecting numeric in D35326 / R35326C4: got 'n.a.'
## Warning: Expecting numeric in D35327 / R35327C4: got 'n.a.'
## Warning: Expecting numeric in D35328 / R35328C4: got 'n.a.'
## Warning: Expecting numeric in D35329 / R35329C4: got 'n.a.'
## Warning: Expecting numeric in D35330 / R35330C4: got 'n.a.'
## Warning: Expecting numeric in D35331 / R35331C4: got 'n.a.'
## Warning: Expecting numeric in D35332 / R35332C4: got 'n.a.'
## Warning: Expecting numeric in D35333 / R35333C4: got 'n.a.'
## Warning: Expecting numeric in D35334 / R35334C4: got 'n.a.'
## Warning: Expecting numeric in D35335 / R35335C4: got 'n.a.'
## Warning: Expecting numeric in D35336 / R35336C4: got 'n.a.'
## Warning: Expecting numeric in D35337 / R35337C4: got 'n.a.'
## Warning: Expecting numeric in D35338 / R35338C4: got 'n.a.'
## Warning: Expecting numeric in D35339 / R35339C4: got 'n.a.'
## Warning: Expecting numeric in D35340 / R35340C4: got 'n.a.'
## Warning: Expecting numeric in D35341 / R35341C4: got 'n.a.'
## Warning: Expecting numeric in D35342 / R35342C4: got 'n.a.'
## Warning: Expecting numeric in D35343 / R35343C4: got 'n.a.'
## Warning: Expecting numeric in D35344 / R35344C4: got 'n.a.'
## Warning: Expecting numeric in D35345 / R35345C4: got 'n.a.'
## Warning: Expecting numeric in D35346 / R35346C4: got 'n.a.'
## Warning: Expecting numeric in D35347 / R35347C4: got 'n.a.'
## Warning: Expecting numeric in D35348 / R35348C4: got 'n.a.'
## Warning: Expecting numeric in D35349 / R35349C4: got 'n.a.'
## Warning: Expecting numeric in D35350 / R35350C4: got 'n.a.'
## Warning: Expecting numeric in D35351 / R35351C4: got 'n.a.'
## Warning: Expecting numeric in D35352 / R35352C4: got 'n.a.'
## Warning: Expecting numeric in D35353 / R35353C4: got 'n.a.'
## Warning: Expecting numeric in D35354 / R35354C4: got 'n.a.'
## Warning: Expecting numeric in D35355 / R35355C4: got 'n.a.'
## Warning: Expecting numeric in D35356 / R35356C4: got 'n.a.'
## Warning: Expecting numeric in D35357 / R35357C4: got 'n.a.'
## Warning: Expecting numeric in D35358 / R35358C4: got 'n.a.'
## Warning: Expecting numeric in D35359 / R35359C4: got 'n.a.'
## Warning: Expecting numeric in D35360 / R35360C4: got 'n.a.'
## Warning: Expecting numeric in D35361 / R35361C4: got 'n.a.'
## Warning: Expecting numeric in D35362 / R35362C4: got 'n.a.'
## Warning: Expecting numeric in D35363 / R35363C4: got 'n.a.'
## Warning: Expecting numeric in D35364 / R35364C4: got 'n.a.'
## Warning: Expecting numeric in D35365 / R35365C4: got 'n.a.'
## Warning: Expecting numeric in D35366 / R35366C4: got 'n.a.'
## Warning: Expecting numeric in D35367 / R35367C4: got 'n.a.'
## Warning: Expecting numeric in D35368 / R35368C4: got 'n.a.'
## Warning: Expecting numeric in D35369 / R35369C4: got 'n.a.'
## Warning: Expecting numeric in D35370 / R35370C4: got 'n.a.'
## Warning: Expecting numeric in D35371 / R35371C4: got 'n.a.'
## Warning: Expecting numeric in D35372 / R35372C4: got 'n.a.'
## Warning: Expecting numeric in D35373 / R35373C4: got 'n.a.'
## Warning: Expecting numeric in D35374 / R35374C4: got 'n.a.'
## Warning: Expecting numeric in D35375 / R35375C4: got 'n.a.'
## Warning: Expecting numeric in D35376 / R35376C4: got 'n.a.'
## Warning: Expecting numeric in D35377 / R35377C4: got 'n.a.'
## Warning: Expecting numeric in D35378 / R35378C4: got 'n.a.'
## Warning: Expecting numeric in D35379 / R35379C4: got 'n.a.'
## Warning: Expecting numeric in D35380 / R35380C4: got 'n.a.'
## Warning: Expecting numeric in D35381 / R35381C4: got 'n.a.'
## Warning: Expecting numeric in D35382 / R35382C4: got 'n.a.'
## Warning: Expecting numeric in D35383 / R35383C4: got 'n.a.'
## Warning: Expecting numeric in D35384 / R35384C4: got 'n.a.'
## Warning: Expecting numeric in D35385 / R35385C4: got 'n.a.'
## Warning: Expecting numeric in D35386 / R35386C4: got 'n.a.'
## Warning: Expecting numeric in D35387 / R35387C4: got 'n.a.'
## Warning: Expecting numeric in D35388 / R35388C4: got 'n.a.'
## Warning: Expecting numeric in D35389 / R35389C4: got 'n.a.'
## Warning: Expecting numeric in D35390 / R35390C4: got 'n.a.'
## Warning: Expecting numeric in D35391 / R35391C4: got 'n.a.'
## Warning: Expecting numeric in D35392 / R35392C4: got 'n.a.'
## Warning: Expecting numeric in D35393 / R35393C4: got 'n.a.'
## Warning: Expecting numeric in D35394 / R35394C4: got 'n.a.'
## Warning: Expecting numeric in D35395 / R35395C4: got 'n.a.'
## Warning: Expecting numeric in D35396 / R35396C4: got 'n.a.'
## Warning: Expecting numeric in D35397 / R35397C4: got 'n.a.'
## Warning: Expecting numeric in D35398 / R35398C4: got 'n.a.'
## Warning: Expecting numeric in D35399 / R35399C4: got 'n.a.'
## Warning: Expecting numeric in D35400 / R35400C4: got 'n.a.'
## Warning: Expecting numeric in D35401 / R35401C4: got 'n.a.'
## Warning: Expecting numeric in D35402 / R35402C4: got 'n.a.'
## Warning: Expecting numeric in D35403 / R35403C4: got 'n.a.'
## Warning: Expecting numeric in D35404 / R35404C4: got 'n.a.'
## Warning: Expecting numeric in D35405 / R35405C4: got 'n.a.'
## Warning: Expecting numeric in D35406 / R35406C4: got 'n.a.'
## Warning: Expecting numeric in D35407 / R35407C4: got 'n.a.'
## Warning: Expecting numeric in D35408 / R35408C4: got 'n.a.'
## Warning: Expecting numeric in D35409 / R35409C4: got 'n.a.'
## Warning: Expecting numeric in D35410 / R35410C4: got 'n.a.'
## Warning: Expecting numeric in D35411 / R35411C4: got 'n.a.'
## Warning: Expecting numeric in D35412 / R35412C4: got 'n.a.'
## Warning: Expecting numeric in D35413 / R35413C4: got 'n.a.'
## Warning: Expecting numeric in D35414 / R35414C4: got 'n.a.'
## Warning: Expecting numeric in D35415 / R35415C4: got 'n.a.'
## Warning: Expecting numeric in D35416 / R35416C4: got 'n.a.'
## Warning: Expecting numeric in D35417 / R35417C4: got 'n.a.'
## Warning: Expecting numeric in D35418 / R35418C4: got 'n.a.'
## Warning: Expecting numeric in D35419 / R35419C4: got 'n.a.'
## Warning: Expecting numeric in D35420 / R35420C4: got 'n.a.'
## Warning: Expecting numeric in D35421 / R35421C4: got 'n.a.'
## Warning: Expecting numeric in D35422 / R35422C4: got 'n.a.'
## Warning: Expecting numeric in D35423 / R35423C4: got 'n.a.'
## Warning: Expecting numeric in D35424 / R35424C4: got 'n.a.'
## Warning: Expecting numeric in D35425 / R35425C4: got 'n.a.'
## Warning: Expecting numeric in D35426 / R35426C4: got 'n.a.'
## Warning: Expecting numeric in D35427 / R35427C4: got 'n.a.'
## Warning: Expecting numeric in D35428 / R35428C4: got 'n.a.'
## Warning: Expecting numeric in D35429 / R35429C4: got 'n.a.'
## Warning: Expecting numeric in D35430 / R35430C4: got 'n.a.'
## Warning: Expecting numeric in D35431 / R35431C4: got 'n.a.'
## Warning: Expecting numeric in D35432 / R35432C4: got 'n.a.'
## Warning: Expecting numeric in D35433 / R35433C4: got 'n.a.'
## Warning: Expecting numeric in D35434 / R35434C4: got 'n.a.'
## Warning: Expecting numeric in D35435 / R35435C4: got 'n.a.'
## Warning: Expecting numeric in D35436 / R35436C4: got 'n.a.'
## Warning: Expecting numeric in D35437 / R35437C4: got 'n.a.'
## Warning: Expecting numeric in D35438 / R35438C4: got 'n.a.'
## Warning: Expecting numeric in D35439 / R35439C4: got 'n.a.'
## Warning: Expecting numeric in D35440 / R35440C4: got 'n.a.'
## Warning: Expecting numeric in D35441 / R35441C4: got 'n.a.'
## Warning: Expecting numeric in D35442 / R35442C4: got 'n.a.'
## Warning: Expecting numeric in D35443 / R35443C4: got 'n.a.'
## Warning: Expecting numeric in D35444 / R35444C4: got 'n.a.'
## Warning: Expecting numeric in D35445 / R35445C4: got 'n.a.'
## Warning: Expecting numeric in D35446 / R35446C4: got 'n.a.'
## Warning: Expecting numeric in D35447 / R35447C4: got 'n.a.'
## Warning: Expecting numeric in D35448 / R35448C4: got 'n.a.'
## Warning: Expecting numeric in D35449 / R35449C4: got 'n.a.'
## Warning: Expecting numeric in D35450 / R35450C4: got 'n.a.'
## Warning: Expecting numeric in D35451 / R35451C4: got 'n.a.'
## Warning: Expecting numeric in D35452 / R35452C4: got 'n.a.'
## Warning: Expecting numeric in D35453 / R35453C4: got 'n.a.'
## Warning: Expecting numeric in D35454 / R35454C4: got 'n.a.'
## Warning: Expecting numeric in D35455 / R35455C4: got 'n.a.'
## Warning: Expecting numeric in D35456 / R35456C4: got 'n.a.'
## Warning: Expecting numeric in D35457 / R35457C4: got 'n.a.'
## Warning: Expecting numeric in D35458 / R35458C4: got 'n.a.'
## Warning: Expecting numeric in D35459 / R35459C4: got 'n.a.'
## Warning: Expecting numeric in D35460 / R35460C4: got 'n.a.'
## Warning: Expecting numeric in D35461 / R35461C4: got 'n.a.'
## Warning: Expecting numeric in D35462 / R35462C4: got 'n.a.'
## Warning: Expecting numeric in D35463 / R35463C4: got 'n.a.'
## Warning: Expecting numeric in D35464 / R35464C4: got 'n.a.'
## Warning: Expecting numeric in D35465 / R35465C4: got 'n.a.'
## Warning: Expecting numeric in D35466 / R35466C4: got 'n.a.'
## Warning: Expecting numeric in D35467 / R35467C4: got 'n.a.'
## Warning: Expecting numeric in D35468 / R35468C4: got 'n.a.'
## Warning: Expecting numeric in D35469 / R35469C4: got 'n.a.'
## Warning: Expecting numeric in D35470 / R35470C4: got 'n.a.'
## Warning: Expecting numeric in D35471 / R35471C4: got 'n.a.'
## Warning: Expecting numeric in D35472 / R35472C4: got 'n.a.'
## Warning: Expecting numeric in D35473 / R35473C4: got 'n.a.'
## Warning: Expecting numeric in D35474 / R35474C4: got 'n.a.'
## Warning: Expecting numeric in D35475 / R35475C4: got 'n.a.'
## Warning: Expecting numeric in D35476 / R35476C4: got 'n.a.'
## Warning: Expecting numeric in D35477 / R35477C4: got 'n.a.'
## Warning: Expecting numeric in D35478 / R35478C4: got 'n.a.'
## Warning: Expecting numeric in D35479 / R35479C4: got 'n.a.'
## Warning: Expecting numeric in D35480 / R35480C4: got 'n.a.'
## Warning: Expecting numeric in D35481 / R35481C4: got 'n.a.'
## Warning: Expecting numeric in D35482 / R35482C4: got 'n.a.'
## Warning: Expecting numeric in D35483 / R35483C4: got 'n.a.'
## Warning: Expecting numeric in D35484 / R35484C4: got 'n.a.'
## Warning: Expecting numeric in D35485 / R35485C4: got 'n.a.'
## Warning: Expecting numeric in D35486 / R35486C4: got 'n.a.'
## Warning: Expecting numeric in D35487 / R35487C4: got 'n.a.'
## Warning: Expecting numeric in D35488 / R35488C4: got 'n.a.'
## Warning: Expecting numeric in D35489 / R35489C4: got 'n.a.'
## Warning: Expecting numeric in D35490 / R35490C4: got 'n.a.'
## Warning: Expecting numeric in D35491 / R35491C4: got 'n.a.'
## Warning: Expecting numeric in D35492 / R35492C4: got 'n.a.'
## Warning: Expecting numeric in D35493 / R35493C4: got 'n.a.'
## Warning: Expecting numeric in D35494 / R35494C4: got 'n.a.'
## Warning: Expecting numeric in D35495 / R35495C4: got 'n.a.'
## Warning: Expecting numeric in D35496 / R35496C4: got 'n.a.'
## Warning: Expecting numeric in D35497 / R35497C4: got 'n.a.'
## Warning: Expecting numeric in D35498 / R35498C4: got 'n.a.'
## Warning: Expecting numeric in D35499 / R35499C4: got 'n.a.'
## Warning: Expecting numeric in D35500 / R35500C4: got 'n.a.'
## Warning: Expecting numeric in D35501 / R35501C4: got 'n.a.'
## Warning: Expecting numeric in D35502 / R35502C4: got 'n.a.'
## Warning: Expecting numeric in D35503 / R35503C4: got 'n.a.'
## Warning: Expecting numeric in D35504 / R35504C4: got 'n.a.'
## Warning: Expecting numeric in D35505 / R35505C4: got 'n.a.'
## Warning: Expecting numeric in D35506 / R35506C4: got 'n.a.'
## Warning: Expecting numeric in D35507 / R35507C4: got 'n.a.'
## Warning: Expecting numeric in D35508 / R35508C4: got 'n.a.'
## Warning: Expecting numeric in D35509 / R35509C4: got 'n.a.'
## Warning: Expecting numeric in D35510 / R35510C4: got 'n.a.'
## Warning: Expecting numeric in D35511 / R35511C4: got 'n.a.'
## Warning: Expecting numeric in D35512 / R35512C4: got 'n.a.'
## Warning: Expecting numeric in D35513 / R35513C4: got 'n.a.'
## Warning: Expecting numeric in D35514 / R35514C4: got 'n.a.'
## Warning: Expecting numeric in D35515 / R35515C4: got 'n.a.'
## Warning: Expecting numeric in D35516 / R35516C4: got 'n.a.'
## Warning: Expecting numeric in D35517 / R35517C4: got 'n.a.'
## Warning: Expecting numeric in D35518 / R35518C4: got 'n.a.'
## Warning: Expecting numeric in D35519 / R35519C4: got 'n.a.'
## Warning: Expecting numeric in D35520 / R35520C4: got 'n.a.'
## Warning: Expecting numeric in D35521 / R35521C4: got 'n.a.'
## Warning: Expecting numeric in D35522 / R35522C4: got 'n.a.'
## Warning: Expecting numeric in D35523 / R35523C4: got 'n.a.'
## Warning: Expecting numeric in D35524 / R35524C4: got 'n.a.'
## Warning: Expecting numeric in D35525 / R35525C4: got 'n.a.'
## Warning: Expecting numeric in D35526 / R35526C4: got 'n.a.'
## Warning: Expecting numeric in D35527 / R35527C4: got 'n.a.'
## Warning: Expecting numeric in D35528 / R35528C4: got 'n.a.'
## Warning: Expecting numeric in D35529 / R35529C4: got 'n.a.'
## Warning: Expecting numeric in D35530 / R35530C4: got 'n.a.'
## Warning: Expecting numeric in D35531 / R35531C4: got 'n.a.'
## Warning: Expecting numeric in D35532 / R35532C4: got 'n.a.'
## Warning: Expecting numeric in D35533 / R35533C4: got 'n.a.'
## Warning: Expecting numeric in D35534 / R35534C4: got 'n.a.'
## Warning: Expecting numeric in D35535 / R35535C4: got 'n.a.'
## Warning: Expecting numeric in D35536 / R35536C4: got 'n.a.'
## Warning: Expecting numeric in D35537 / R35537C4: got 'n.a.'
## Warning: Expecting numeric in D35538 / R35538C4: got 'n.a.'
## Warning: Expecting numeric in D35539 / R35539C4: got 'n.a.'
## Warning: Expecting numeric in D35540 / R35540C4: got 'n.a.'
## Warning: Expecting numeric in D35541 / R35541C4: got 'n.a.'
## Warning: Expecting numeric in D35542 / R35542C4: got 'n.a.'
## Warning: Expecting numeric in D35543 / R35543C4: got 'n.a.'
## Warning: Expecting numeric in D35544 / R35544C4: got 'n.a.'
## Warning: Expecting numeric in D35545 / R35545C4: got 'n.a.'
## Warning: Expecting numeric in D35546 / R35546C4: got 'n.a.'
## Warning: Expecting numeric in D35547 / R35547C4: got 'n.a.'
## Warning: Expecting numeric in D35548 / R35548C4: got 'n.a.'
## Warning: Expecting numeric in D35549 / R35549C4: got 'n.a.'
## Warning: Expecting numeric in D35550 / R35550C4: got 'n.a.'
## Warning: Expecting numeric in D35551 / R35551C4: got 'n.a.'
## Warning: Expecting numeric in D35552 / R35552C4: got 'n.a.'
## Warning: Expecting numeric in D35553 / R35553C4: got 'n.a.'
## Warning: Expecting numeric in D35554 / R35554C4: got 'n.a.'
## Warning: Expecting numeric in D35555 / R35555C4: got 'n.a.'
## Warning: Expecting numeric in D35556 / R35556C4: got 'n.a.'
## Warning: Expecting numeric in D35557 / R35557C4: got 'n.a.'
## Warning: Expecting numeric in D35558 / R35558C4: got 'n.a.'
## Warning: Expecting numeric in D35559 / R35559C4: got 'n.a.'
## Warning: Expecting numeric in D35560 / R35560C4: got 'n.a.'
## Warning: Expecting numeric in D35561 / R35561C4: got 'n.a.'
## Warning: Expecting numeric in D35562 / R35562C4: got 'n.a.'
## Warning: Expecting numeric in D35563 / R35563C4: got 'n.a.'
## Warning: Expecting numeric in D35564 / R35564C4: got 'n.a.'
## Warning: Expecting numeric in D35565 / R35565C4: got 'n.a.'
## Warning: Expecting numeric in D35566 / R35566C4: got 'n.a.'
## Warning: Expecting numeric in D35567 / R35567C4: got 'n.a.'
## Warning: Expecting numeric in D35568 / R35568C4: got 'n.a.'
## Warning: Expecting numeric in D35569 / R35569C4: got 'n.a.'
## Warning: Expecting numeric in D35570 / R35570C4: got 'n.a.'
## Warning: Expecting numeric in D35571 / R35571C4: got 'n.a.'
## Warning: Expecting numeric in D35572 / R35572C4: got 'n.a.'
## Warning: Expecting numeric in D35573 / R35573C4: got 'n.a.'
## Warning: Expecting numeric in D35574 / R35574C4: got 'n.a.'
## Warning: Expecting numeric in D35575 / R35575C4: got 'n.a.'
## Warning: Expecting numeric in D35576 / R35576C4: got 'n.a.'
## Warning: Expecting numeric in D35577 / R35577C4: got 'n.a.'
## Warning: Expecting numeric in D35578 / R35578C4: got 'n.a.'
## Warning: Expecting numeric in D35579 / R35579C4: got 'n.a.'
## Warning: Expecting numeric in D35580 / R35580C4: got 'n.a.'
## Warning: Expecting numeric in D35581 / R35581C4: got 'n.a.'
## Warning: Expecting numeric in D35582 / R35582C4: got 'n.a.'
## Warning: Expecting numeric in D35583 / R35583C4: got 'n.a.'
## Warning: Expecting numeric in D35584 / R35584C4: got 'n.a.'
## Warning: Expecting numeric in D35585 / R35585C4: got 'n.a.'
## Warning: Expecting numeric in D35586 / R35586C4: got 'n.a.'
## Warning: Expecting numeric in D35587 / R35587C4: got 'n.a.'
## Warning: Expecting numeric in D35588 / R35588C4: got 'n.a.'
## Warning: Expecting numeric in D35589 / R35589C4: got 'n.a.'
## Warning: Expecting numeric in D35590 / R35590C4: got 'n.a.'
## Warning: Expecting numeric in D35591 / R35591C4: got 'n.a.'
## Warning: Expecting numeric in D35592 / R35592C4: got 'n.a.'
## Warning: Expecting numeric in D35593 / R35593C4: got 'n.a.'
## Warning: Expecting numeric in D35594 / R35594C4: got 'n.a.'
## Warning: Expecting numeric in D35595 / R35595C4: got 'n.a.'
## Warning: Expecting numeric in D35596 / R35596C4: got 'n.a.'
## Warning: Expecting numeric in D35597 / R35597C4: got 'n.a.'
## Warning: Expecting numeric in D35598 / R35598C4: got 'n.a.'
## Warning: Expecting numeric in D35599 / R35599C4: got 'n.a.'
## Warning: Expecting numeric in D35600 / R35600C4: got 'n.a.'
## Warning: Expecting numeric in D35601 / R35601C4: got 'n.a.'
## Warning: Expecting numeric in D35602 / R35602C4: got 'n.a.'
## Warning: Expecting numeric in D35603 / R35603C4: got 'n.a.'
## Warning: Expecting numeric in D35604 / R35604C4: got 'n.a.'
## Warning: Expecting numeric in D35605 / R35605C4: got 'n.a.'
## Warning: Expecting numeric in D35606 / R35606C4: got 'n.a.'
## Warning: Expecting numeric in D35607 / R35607C4: got 'n.a.'
## Warning: Expecting numeric in D35608 / R35608C4: got 'n.a.'
## Warning: Expecting numeric in D35609 / R35609C4: got 'n.a.'
## Warning: Expecting numeric in D35610 / R35610C4: got 'n.a.'
## Warning: Expecting numeric in D35611 / R35611C4: got 'n.a.'
## Warning: Expecting numeric in D35612 / R35612C4: got 'n.a.'
## Warning: Expecting numeric in D35613 / R35613C4: got 'n.a.'
## Warning: Expecting numeric in D35614 / R35614C4: got 'n.a.'
## Warning: Expecting numeric in D35615 / R35615C4: got 'n.a.'
## Warning: Expecting numeric in D35616 / R35616C4: got 'n.a.'
## Warning: Expecting numeric in D35617 / R35617C4: got 'n.a.'
## Warning: Expecting numeric in D35618 / R35618C4: got 'n.a.'
## Warning: Expecting numeric in D35619 / R35619C4: got 'n.a.'
## Warning: Expecting numeric in D35620 / R35620C4: got 'n.a.'
## Warning: Expecting numeric in D35621 / R35621C4: got 'n.a.'
## Warning: Expecting numeric in D35622 / R35622C4: got 'n.a.'
## Warning: Expecting numeric in D35623 / R35623C4: got 'n.a.'
## Warning: Expecting numeric in D35624 / R35624C4: got 'n.a.'
## Warning: Expecting numeric in D35625 / R35625C4: got 'n.a.'
## Warning: Expecting numeric in D35626 / R35626C4: got 'n.a.'
## Warning: Expecting numeric in D35627 / R35627C4: got 'n.a.'
## Warning: Expecting numeric in D35628 / R35628C4: got 'n.a.'
## Warning: Expecting numeric in D35629 / R35629C4: got 'n.a.'
## Warning: Expecting numeric in D35630 / R35630C4: got 'n.a.'
## Warning: Expecting numeric in D35631 / R35631C4: got 'n.a.'
## Warning: Expecting numeric in D35632 / R35632C4: got 'n.a.'
## Warning: Expecting numeric in D35633 / R35633C4: got 'n.a.'
## Warning: Expecting numeric in D35634 / R35634C4: got 'n.a.'
## Warning: Expecting numeric in D35635 / R35635C4: got 'n.a.'
## Warning: Expecting numeric in D35636 / R35636C4: got 'n.a.'
## Warning: Expecting numeric in D35637 / R35637C4: got 'n.a.'
## Warning: Expecting numeric in D35638 / R35638C4: got 'n.a.'
## Warning: Expecting numeric in D35639 / R35639C4: got 'n.a.'
## Warning: Expecting numeric in D35640 / R35640C4: got 'n.a.'
## Warning: Expecting numeric in D35641 / R35641C4: got 'n.a.'
## Warning: Expecting numeric in D35642 / R35642C4: got 'n.a.'
## Warning: Expecting numeric in D35643 / R35643C4: got 'n.a.'
## Warning: Expecting numeric in D35644 / R35644C4: got 'n.a.'
## Warning: Expecting numeric in D35645 / R35645C4: got 'n.a.'
## Warning: Expecting numeric in D35646 / R35646C4: got 'n.a.'
## Warning: Expecting numeric in D35647 / R35647C4: got 'n.a.'
## Warning: Expecting numeric in D35648 / R35648C4: got 'n.a.'
## Warning: Expecting numeric in D35649 / R35649C4: got 'n.a.'
## Warning: Expecting numeric in D35650 / R35650C4: got 'n.a.'
## Warning: Expecting numeric in D35651 / R35651C4: got 'n.a.'
## Warning: Expecting numeric in D35652 / R35652C4: got 'n.a.'
## Warning: Expecting numeric in D35653 / R35653C4: got 'n.a.'
## Warning: Expecting numeric in D35654 / R35654C4: got 'n.a.'
## Warning: Expecting numeric in D35655 / R35655C4: got 'n.a.'
## Warning: Expecting numeric in D35656 / R35656C4: got 'n.a.'
## Warning: Expecting numeric in D35657 / R35657C4: got 'n.a.'
## Warning: Expecting numeric in D35658 / R35658C4: got 'n.a.'
## Warning: Expecting numeric in D35659 / R35659C4: got 'n.a.'
## Warning: Expecting numeric in D35660 / R35660C4: got 'n.a.'
## Warning: Expecting numeric in D35661 / R35661C4: got 'n.a.'
## Warning: Expecting numeric in D35662 / R35662C4: got 'n.a.'
## Warning: Expecting numeric in D35663 / R35663C4: got 'n.a.'
## Warning: Expecting numeric in D35664 / R35664C4: got 'n.a.'
## Warning: Expecting numeric in D35665 / R35665C4: got 'n.a.'
## Warning: Expecting numeric in D35666 / R35666C4: got 'n.a.'
## Warning: Expecting numeric in D35667 / R35667C4: got 'n.a.'
## Warning: Expecting numeric in D35668 / R35668C4: got 'n.a.'
## Warning: Expecting numeric in D35669 / R35669C4: got 'n.a.'
## Warning: Expecting numeric in D35670 / R35670C4: got 'n.a.'
## Warning: Expecting numeric in D35671 / R35671C4: got 'n.a.'
## Warning: Expecting numeric in D35672 / R35672C4: got 'n.a.'
## Warning: Expecting numeric in D35673 / R35673C4: got 'n.a.'
## Warning: Expecting numeric in D35674 / R35674C4: got 'n.a.'
## Warning: Expecting numeric in D35675 / R35675C4: got 'n.a.'
## Warning: Expecting numeric in D35676 / R35676C4: got 'n.a.'
## Warning: Expecting numeric in D35677 / R35677C4: got 'n.a.'
## Warning: Expecting numeric in D35678 / R35678C4: got 'n.a.'
## Warning: Expecting numeric in D35679 / R35679C4: got 'n.a.'
## Warning: Expecting numeric in D35680 / R35680C4: got 'n.a.'
## Warning: Expecting numeric in D35681 / R35681C4: got 'n.a.'
## Warning: Expecting numeric in D35682 / R35682C4: got 'n.a.'
## Warning: Expecting numeric in D35683 / R35683C4: got 'n.a.'
## Warning: Expecting numeric in D35684 / R35684C4: got 'n.a.'
## Warning: Expecting numeric in D35685 / R35685C4: got 'n.a.'
## Warning: Expecting numeric in D35686 / R35686C4: got 'n.a.'
## Warning: Expecting numeric in D35687 / R35687C4: got 'n.a.'
## Warning: Expecting numeric in D35688 / R35688C4: got 'n.a.'
## Warning: Expecting numeric in D35689 / R35689C4: got 'n.a.'
## Warning: Expecting numeric in D35690 / R35690C4: got 'n.a.'
## Warning: Expecting numeric in D35691 / R35691C4: got 'n.a.'
## Warning: Expecting numeric in D35692 / R35692C4: got 'n.a.'
## Warning: Expecting numeric in D35693 / R35693C4: got 'n.a.'
## Warning: Expecting numeric in D35694 / R35694C4: got 'n.a.'
## Warning: Expecting numeric in D35695 / R35695C4: got 'n.a.'
## Warning: Expecting numeric in D35696 / R35696C4: got 'n.a.'
## Warning: Expecting numeric in D35697 / R35697C4: got 'n.a.'
## Warning: Expecting numeric in D35698 / R35698C4: got 'n.a.'
## Warning: Expecting numeric in D35699 / R35699C4: got 'n.a.'
## Warning: Expecting numeric in D35700 / R35700C4: got 'n.a.'
## Warning: Expecting numeric in D35701 / R35701C4: got 'n.a.'
## Warning: Expecting numeric in D35702 / R35702C4: got 'n.a.'
## Warning: Expecting numeric in D35703 / R35703C4: got 'n.a.'
## Warning: Expecting numeric in D35704 / R35704C4: got 'n.a.'
## Warning: Expecting numeric in D35705 / R35705C4: got 'n.a.'
## Warning: Expecting numeric in D35706 / R35706C4: got 'n.a.'
## Warning: Expecting numeric in D35707 / R35707C4: got 'n.a.'
## Warning: Expecting numeric in D35708 / R35708C4: got 'n.a.'
## Warning: Expecting numeric in D35709 / R35709C4: got 'n.a.'
## Warning: Expecting numeric in D35710 / R35710C4: got 'n.a.'
## Warning: Expecting numeric in D35711 / R35711C4: got 'n.a.'
## Warning: Expecting numeric in D35712 / R35712C4: got 'n.a.'
## Warning: Expecting numeric in D35713 / R35713C4: got 'n.a.'
## Warning: Expecting numeric in D35714 / R35714C4: got 'n.a.'
## Warning: Expecting numeric in D35715 / R35715C4: got 'n.a.'
## Warning: Expecting numeric in D35716 / R35716C4: got 'n.a.'
## Warning: Expecting numeric in D35717 / R35717C4: got 'n.a.'
## Warning: Expecting numeric in D35718 / R35718C4: got 'n.a.'
## Warning: Expecting numeric in D35719 / R35719C4: got 'n.a.'
## Warning: Expecting numeric in D35720 / R35720C4: got 'n.a.'
## Warning: Expecting numeric in D35721 / R35721C4: got 'n.a.'
## Warning: Expecting numeric in D35722 / R35722C4: got 'n.a.'
## Warning: Expecting numeric in D35723 / R35723C4: got 'n.a.'
## Warning: Expecting numeric in D35724 / R35724C4: got 'n.a.'
## Warning: Expecting numeric in D35725 / R35725C4: got 'n.a.'
## Warning: Expecting numeric in D35726 / R35726C4: got 'n.a.'
## Warning: Expecting numeric in D35727 / R35727C4: got 'n.a.'
## Warning: Expecting numeric in D35728 / R35728C4: got 'n.a.'
## Warning: Expecting numeric in D35729 / R35729C4: got 'n.a.'
## Warning: Expecting numeric in D35730 / R35730C4: got 'n.a.'
## Warning: Expecting numeric in D35731 / R35731C4: got 'n.a.'
## Warning: Expecting numeric in D35732 / R35732C4: got 'n.a.'
## Warning: Expecting numeric in D35733 / R35733C4: got 'n.a.'
## Warning: Expecting numeric in D35734 / R35734C4: got 'n.a.'
## Warning: Expecting numeric in D35735 / R35735C4: got 'n.a.'
## Warning: Expecting numeric in D35736 / R35736C4: got 'n.a.'
## Warning: Expecting numeric in D35737 / R35737C4: got 'n.a.'
## Warning: Expecting numeric in D35738 / R35738C4: got 'n.a.'
## Warning: Expecting numeric in D35739 / R35739C4: got 'n.a.'
## Warning: Expecting numeric in D35740 / R35740C4: got 'n.a.'
## Warning: Expecting numeric in D35741 / R35741C4: got 'n.a.'
## Warning: Expecting numeric in D35742 / R35742C4: got 'n.a.'
## Warning: Expecting numeric in D35743 / R35743C4: got 'n.a.'
## Warning: Expecting numeric in D35744 / R35744C4: got 'n.a.'
## Warning: Expecting numeric in D35745 / R35745C4: got 'n.a.'
## Warning: Expecting numeric in D35746 / R35746C4: got 'n.a.'
## Warning: Expecting numeric in D35747 / R35747C4: got 'n.a.'
## Warning: Expecting numeric in D35748 / R35748C4: got 'n.a.'
## Warning: Expecting numeric in D35749 / R35749C4: got 'n.a.'
## Warning: Expecting numeric in D35750 / R35750C4: got 'n.a.'
## Warning: Expecting numeric in D35751 / R35751C4: got 'n.a.'
## Warning: Expecting numeric in D35752 / R35752C4: got 'n.a.'
## Warning: Expecting numeric in D35753 / R35753C4: got 'n.a.'
## Warning: Expecting numeric in D35754 / R35754C4: got 'n.a.'
## Warning: Expecting numeric in D35755 / R35755C4: got 'n.a.'
## Warning: Expecting numeric in D35756 / R35756C4: got 'n.a.'
## Warning: Expecting numeric in D35757 / R35757C4: got 'n.a.'
## Warning: Expecting numeric in D35758 / R35758C4: got 'n.a.'
## Warning: Expecting numeric in D35759 / R35759C4: got 'n.a.'
## Warning: Expecting numeric in D35760 / R35760C4: got 'n.a.'
## Warning: Expecting numeric in D35761 / R35761C4: got 'n.a.'
## Warning: Expecting numeric in D35762 / R35762C4: got 'n.a.'
## Warning: Expecting numeric in D35763 / R35763C4: got 'n.a.'
## Warning: Expecting numeric in D35764 / R35764C4: got 'n.a.'
## Warning: Expecting numeric in D35765 / R35765C4: got 'n.a.'
## Warning: Expecting numeric in D35766 / R35766C4: got 'n.a.'
## Warning: Expecting numeric in D35767 / R35767C4: got 'n.a.'
## Warning: Expecting numeric in D35768 / R35768C4: got 'n.a.'
## Warning: Expecting numeric in D35769 / R35769C4: got 'n.a.'
## Warning: Expecting numeric in D35770 / R35770C4: got 'n.a.'
## Warning: Expecting numeric in D35771 / R35771C4: got 'n.a.'
## Warning: Expecting numeric in D35772 / R35772C4: got 'n.a.'
## Warning: Expecting numeric in D35773 / R35773C4: got 'n.a.'
## Warning: Expecting numeric in D35774 / R35774C4: got 'n.a.'
## Warning: Expecting numeric in D35775 / R35775C4: got 'n.a.'
## Warning: Expecting numeric in D35776 / R35776C4: got 'n.a.'
## Warning: Expecting numeric in D35777 / R35777C4: got 'n.a.'
## Warning: Expecting numeric in D35778 / R35778C4: got 'n.a.'
## Warning: Expecting numeric in D35779 / R35779C4: got 'n.a.'
## Warning: Expecting numeric in D35780 / R35780C4: got 'n.a.'
## Warning: Expecting numeric in D35781 / R35781C4: got 'n.a.'
## Warning: Expecting numeric in D35782 / R35782C4: got 'n.a.'
## Warning: Expecting numeric in D35783 / R35783C4: got 'n.a.'
## Warning: Expecting numeric in D35784 / R35784C4: got 'n.a.'
## Warning: Expecting numeric in D35785 / R35785C4: got 'n.a.'
## Warning: Expecting numeric in D35786 / R35786C4: got 'n.a.'
## Warning: Expecting numeric in D35787 / R35787C4: got 'n.a.'
## Warning: Expecting numeric in D35788 / R35788C4: got 'n.a.'
## Warning: Expecting numeric in D35789 / R35789C4: got 'n.a.'
## Warning: Expecting numeric in D35790 / R35790C4: got 'n.a.'
## Warning: Expecting numeric in D35791 / R35791C4: got 'n.a.'
## Warning: Expecting numeric in D35792 / R35792C4: got 'n.a.'
## Warning: Expecting numeric in D35793 / R35793C4: got 'n.a.'
## Warning: Expecting numeric in D35794 / R35794C4: got 'n.a.'
## Warning: Expecting numeric in D35795 / R35795C4: got 'n.a.'
## Warning: Expecting numeric in D35796 / R35796C4: got 'n.a.'
## Warning: Expecting numeric in D35797 / R35797C4: got 'n.a.'
## Warning: Expecting numeric in D35798 / R35798C4: got 'n.a.'
## Warning: Expecting numeric in D35799 / R35799C4: got 'n.a.'
## Warning: Expecting numeric in D35800 / R35800C4: got 'n.a.'
## Warning: Expecting numeric in D35801 / R35801C4: got 'n.a.'
## Warning: Expecting numeric in D35802 / R35802C4: got 'n.a.'
## Warning: Expecting numeric in D35803 / R35803C4: got 'n.a.'
## Warning: Expecting numeric in D35804 / R35804C4: got 'n.a.'
## Warning: Expecting numeric in D35805 / R35805C4: got 'n.a.'
## Warning: Expecting numeric in D35806 / R35806C4: got 'n.a.'
## Warning: Expecting numeric in D35807 / R35807C4: got 'n.a.'
## Warning: Expecting numeric in D35808 / R35808C4: got 'n.a.'
## Warning: Expecting numeric in D35809 / R35809C4: got 'n.a.'
## Warning: Expecting numeric in D35810 / R35810C4: got 'n.a.'
## Warning: Expecting numeric in D35811 / R35811C4: got 'n.a.'
## Warning: Expecting numeric in D35812 / R35812C4: got 'n.a.'
## Warning: Expecting numeric in D35813 / R35813C4: got 'n.a.'
## Warning: Expecting numeric in D35814 / R35814C4: got 'n.a.'
## Warning: Expecting numeric in D35815 / R35815C4: got 'n.a.'
## Warning: Expecting numeric in D35816 / R35816C4: got 'n.a.'
## Warning: Expecting numeric in D35817 / R35817C4: got 'n.a.'
## Warning: Expecting numeric in D35818 / R35818C4: got 'n.a.'
## Warning: Expecting numeric in D35819 / R35819C4: got 'n.a.'
## Warning: Expecting numeric in D35820 / R35820C4: got 'n.a.'
## Warning: Expecting numeric in D35821 / R35821C4: got 'n.a.'
## Warning: Expecting numeric in D35822 / R35822C4: got 'n.a.'
## Warning: Expecting numeric in D35823 / R35823C4: got 'n.a.'
## Warning: Expecting numeric in D35824 / R35824C4: got 'n.a.'
## Warning: Expecting numeric in D35825 / R35825C4: got 'n.a.'
## Warning: Expecting numeric in D35826 / R35826C4: got 'n.a.'
## Warning: Expecting numeric in D35827 / R35827C4: got 'n.a.'
## Warning: Expecting numeric in D35828 / R35828C4: got 'n.a.'
## Warning: Expecting numeric in D35829 / R35829C4: got 'n.a.'
## Warning: Expecting numeric in D35830 / R35830C4: got 'n.a.'
## Warning: Expecting numeric in D35831 / R35831C4: got 'n.a.'
## Warning: Expecting numeric in D35832 / R35832C4: got 'n.a.'
## Warning: Expecting numeric in D35833 / R35833C4: got 'n.a.'
## Warning: Expecting numeric in D35834 / R35834C4: got 'n.a.'
## Warning: Expecting numeric in D35835 / R35835C4: got 'n.a.'
## Warning: Expecting numeric in D35836 / R35836C4: got 'n.a.'
## Warning: Expecting numeric in D35837 / R35837C4: got 'n.a.'
## Warning: Expecting numeric in D35838 / R35838C4: got 'n.a.'
## Warning: Expecting numeric in D35839 / R35839C4: got 'n.a.'
## Warning: Expecting numeric in D35840 / R35840C4: got 'n.a.'
## Warning: Expecting numeric in D35841 / R35841C4: got 'n.a.'
## Warning: Expecting numeric in D35842 / R35842C4: got 'n.a.'
## Warning: Expecting numeric in D35843 / R35843C4: got 'n.a.'
## Warning: Expecting numeric in D35844 / R35844C4: got 'n.a.'
## Warning: Expecting numeric in D35845 / R35845C4: got 'n.a.'
## Warning: Expecting numeric in D35846 / R35846C4: got 'n.a.'
## Warning: Expecting numeric in D35847 / R35847C4: got 'n.a.'
## Warning: Expecting numeric in D35848 / R35848C4: got 'n.a.'
## Warning: Expecting numeric in D35849 / R35849C4: got 'n.a.'
## Warning: Expecting numeric in D35850 / R35850C4: got 'n.a.'
## Warning: Expecting numeric in D35851 / R35851C4: got 'n.a.'
## Warning: Expecting numeric in D35852 / R35852C4: got 'n.a.'
## Warning: Expecting numeric in D35853 / R35853C4: got 'n.a.'
## Warning: Expecting numeric in D35854 / R35854C4: got 'n.a.'
## Warning: Expecting numeric in D35855 / R35855C4: got 'n.a.'
## Warning: Expecting numeric in D35856 / R35856C4: got 'n.a.'
## Warning: Expecting numeric in D35857 / R35857C4: got 'n.a.'
## Warning: Expecting numeric in D35858 / R35858C4: got 'n.a.'
## Warning: Expecting numeric in D35859 / R35859C4: got 'n.a.'
## Warning: Expecting numeric in D35860 / R35860C4: got 'n.a.'
## Warning: Expecting numeric in D35861 / R35861C4: got 'n.a.'
## Warning: Expecting numeric in D35862 / R35862C4: got 'n.a.'
## Warning: Expecting numeric in D35863 / R35863C4: got 'n.a.'
## Warning: Expecting numeric in D35864 / R35864C4: got 'n.a.'
## Warning: Expecting numeric in D35865 / R35865C4: got 'n.a.'
## Warning: Expecting numeric in D35866 / R35866C4: got 'n.a.'
## Warning: Expecting numeric in D35867 / R35867C4: got 'n.a.'
## Warning: Expecting numeric in D35868 / R35868C4: got 'n.a.'
## Warning: Expecting numeric in D35869 / R35869C4: got 'n.a.'
## Warning: Expecting numeric in D35870 / R35870C4: got 'n.a.'
## Warning: Expecting numeric in D35871 / R35871C4: got 'n.a.'
## Warning: Expecting numeric in D35872 / R35872C4: got 'n.a.'
## Warning: Expecting numeric in D35873 / R35873C4: got 'n.a.'
## Warning: Expecting numeric in D35874 / R35874C4: got 'n.a.'
## Warning: Expecting numeric in D35875 / R35875C4: got 'n.a.'
## Warning: Expecting numeric in D35876 / R35876C4: got 'n.a.'
## Warning: Expecting numeric in D35877 / R35877C4: got 'n.a.'
## Warning: Expecting numeric in D35878 / R35878C4: got 'n.a.'
## Warning: Expecting numeric in D35879 / R35879C4: got 'n.a.'
## Warning: Expecting numeric in D35880 / R35880C4: got 'n.a.'
## Warning: Expecting numeric in D35881 / R35881C4: got 'n.a.'
## Warning: Expecting numeric in D35882 / R35882C4: got 'n.a.'
## Warning: Expecting numeric in D35883 / R35883C4: got 'n.a.'
## Warning: Expecting numeric in D35884 / R35884C4: got 'n.a.'
## Warning: Expecting numeric in D35885 / R35885C4: got 'n.a.'
## Warning: Expecting numeric in D35886 / R35886C4: got 'n.a.'
## Warning: Expecting numeric in D35887 / R35887C4: got 'n.a.'
## Warning: Expecting numeric in D35888 / R35888C4: got 'n.a.'
## Warning: Expecting numeric in D35889 / R35889C4: got 'n.a.'
## Warning: Expecting numeric in D35890 / R35890C4: got 'n.a.'
## Warning: Expecting numeric in D35891 / R35891C4: got 'n.a.'
## Warning: Expecting numeric in D35892 / R35892C4: got 'n.a.'
## Warning: Expecting numeric in D35893 / R35893C4: got 'n.a.'
## Warning: Expecting numeric in D35894 / R35894C4: got 'n.a.'
## Warning: Expecting numeric in D35895 / R35895C4: got 'n.a.'
## Warning: Expecting numeric in D35896 / R35896C4: got 'n.a.'
## Warning: Expecting numeric in D35897 / R35897C4: got 'n.a.'
## Warning: Expecting numeric in D35898 / R35898C4: got 'n.a.'
## Warning: Expecting numeric in D35899 / R35899C4: got 'n.a.'
## Warning: Expecting numeric in D35900 / R35900C4: got 'n.a.'
## Warning: Expecting numeric in D35901 / R35901C4: got 'n.a.'
## Warning: Expecting numeric in D35902 / R35902C4: got 'n.a.'
## Warning: Expecting numeric in D35903 / R35903C4: got 'n.a.'
## Warning: Expecting numeric in D35904 / R35904C4: got 'n.a.'
## Warning: Expecting numeric in D35905 / R35905C4: got 'n.a.'
## Warning: Expecting numeric in D35906 / R35906C4: got 'n.a.'
## Warning: Expecting numeric in D35907 / R35907C4: got 'n.a.'
## Warning: Expecting numeric in D35908 / R35908C4: got 'n.a.'
## Warning: Expecting numeric in D35909 / R35909C4: got 'n.a.'
## Warning: Expecting numeric in D35910 / R35910C4: got 'n.a.'
## Warning: Expecting numeric in D35911 / R35911C4: got 'n.a.'
## Warning: Expecting numeric in D35912 / R35912C4: got 'n.a.'
## Warning: Expecting numeric in D35913 / R35913C4: got 'n.a.'
## Warning: Expecting numeric in D35914 / R35914C4: got 'n.a.'
## Warning: Expecting numeric in D35915 / R35915C4: got 'n.a.'
## Warning: Expecting numeric in D35916 / R35916C4: got 'n.a.'
## Warning: Expecting numeric in D35917 / R35917C4: got 'n.a.'
## Warning: Expecting numeric in D35918 / R35918C4: got 'n.a.'
## Warning: Expecting numeric in D35919 / R35919C4: got 'n.a.'
## Warning: Expecting numeric in D35920 / R35920C4: got 'n.a.'
## Warning: Expecting numeric in D35921 / R35921C4: got 'n.a.'
## Warning: Expecting numeric in D35922 / R35922C4: got 'n.a.'
## Warning: Expecting numeric in D35923 / R35923C4: got 'n.a.'
## Warning: Expecting numeric in D35924 / R35924C4: got 'n.a.'
## Warning: Expecting numeric in D35925 / R35925C4: got 'n.a.'
## Warning: Expecting numeric in D35926 / R35926C4: got 'n.a.'
## Warning: Expecting numeric in D35927 / R35927C4: got 'n.a.'
## Warning: Expecting numeric in D35928 / R35928C4: got 'n.a.'
## Warning: Expecting numeric in D35929 / R35929C4: got 'n.a.'
## Warning: Expecting numeric in D35930 / R35930C4: got 'n.a.'
## Warning: Expecting numeric in D35931 / R35931C4: got 'n.a.'
## Warning: Expecting numeric in D35932 / R35932C4: got 'n.a.'
## Warning: Expecting numeric in D35933 / R35933C4: got 'n.a.'
## Warning: Expecting numeric in D35934 / R35934C4: got 'n.a.'
## Warning: Expecting numeric in D35935 / R35935C4: got 'n.a.'
## Warning: Expecting numeric in D35936 / R35936C4: got 'n.a.'
## Warning: Expecting numeric in D35937 / R35937C4: got 'n.a.'
## Warning: Expecting numeric in D35938 / R35938C4: got 'n.a.'
## Warning: Expecting numeric in D35939 / R35939C4: got 'n.a.'
## Warning: Expecting numeric in D35940 / R35940C4: got 'n.a.'
## Warning: Expecting numeric in D35941 / R35941C4: got 'n.a.'
## Warning: Expecting numeric in D35942 / R35942C4: got 'n.a.'
## Warning: Expecting numeric in D35943 / R35943C4: got 'n.a.'
## Warning: Expecting numeric in D35944 / R35944C4: got 'n.a.'
## Warning: Expecting numeric in D35945 / R35945C4: got 'n.a.'
## Warning: Expecting numeric in D35946 / R35946C4: got 'n.a.'
## Warning: Expecting numeric in D35947 / R35947C4: got 'n.a.'
## Warning: Expecting numeric in D35948 / R35948C4: got 'n.a.'
## Warning: Expecting numeric in D35949 / R35949C4: got 'n.a.'
## Warning: Expecting numeric in D35950 / R35950C4: got 'n.a.'
## Warning: Expecting numeric in D35951 / R35951C4: got 'n.a.'
## Warning: Expecting numeric in D35952 / R35952C4: got 'n.a.'
## Warning: Expecting numeric in D35953 / R35953C4: got 'n.a.'
## Warning: Expecting numeric in D35954 / R35954C4: got 'n.a.'
## Warning: Expecting numeric in D35955 / R35955C4: got 'n.a.'
## Warning: Expecting numeric in D35956 / R35956C4: got 'n.a.'
## Warning: Expecting numeric in D35957 / R35957C4: got 'n.a.'
## Warning: Expecting numeric in D35958 / R35958C4: got 'n.a.'
## Warning: Expecting numeric in D35959 / R35959C4: got 'n.a.'
## Warning: Expecting numeric in D35960 / R35960C4: got 'n.a.'
## Warning: Expecting numeric in D35961 / R35961C4: got 'n.a.'
## Warning: Expecting numeric in D35962 / R35962C4: got 'n.a.'
## Warning: Expecting numeric in D35963 / R35963C4: got 'n.a.'
## Warning: Expecting numeric in D35964 / R35964C4: got 'n.a.'
## Warning: Expecting numeric in D35965 / R35965C4: got 'n.a.'
## Warning: Expecting numeric in D35966 / R35966C4: got 'n.a.'
## Warning: Expecting numeric in D35967 / R35967C4: got 'n.a.'
## Warning: Expecting numeric in D35968 / R35968C4: got 'n.a.'
## Warning: Expecting numeric in D35969 / R35969C4: got 'n.a.'
## Warning: Expecting numeric in D35970 / R35970C4: got 'n.a.'
## Warning: Expecting numeric in D35971 / R35971C4: got 'n.a.'
## Warning: Expecting numeric in D35972 / R35972C4: got 'n.a.'
## Warning: Expecting numeric in D35973 / R35973C4: got 'n.a.'
## Warning: Expecting numeric in D35974 / R35974C4: got 'n.a.'
## Warning: Expecting numeric in D35975 / R35975C4: got 'n.a.'
## Warning: Expecting numeric in D35976 / R35976C4: got 'n.a.'
## Warning: Expecting numeric in D35977 / R35977C4: got 'n.a.'
## Warning: Expecting numeric in D35978 / R35978C4: got 'n.a.'
## Warning: Expecting numeric in D35979 / R35979C4: got 'n.a.'
## Warning: Expecting numeric in D35980 / R35980C4: got 'n.a.'
## Warning: Expecting numeric in D35981 / R35981C4: got 'n.a.'
## Warning: Expecting numeric in D35982 / R35982C4: got 'n.a.'
## Warning: Expecting numeric in D35983 / R35983C4: got 'n.a.'
## Warning: Expecting numeric in D35984 / R35984C4: got 'n.a.'
## Warning: Expecting numeric in D35985 / R35985C4: got 'n.a.'
## Warning: Expecting numeric in D35986 / R35986C4: got 'n.a.'
## Warning: Expecting numeric in D35987 / R35987C4: got 'n.a.'
## Warning: Expecting numeric in D35988 / R35988C4: got 'n.a.'
## Warning: Expecting numeric in D35989 / R35989C4: got 'n.a.'
## Warning: Expecting numeric in D35990 / R35990C4: got 'n.a.'
## Warning: Expecting numeric in D35991 / R35991C4: got 'n.a.'
## Warning: Expecting numeric in D35992 / R35992C4: got 'n.a.'
## Warning: Expecting numeric in D35993 / R35993C4: got 'n.a.'
## Warning: Expecting numeric in D35994 / R35994C4: got 'n.a.'
## Warning: Expecting numeric in D35995 / R35995C4: got 'n.a.'
## Warning: Expecting numeric in D35996 / R35996C4: got 'n.a.'
## Warning: Expecting numeric in D35997 / R35997C4: got 'n.a.'
## Warning: Expecting numeric in D35998 / R35998C4: got 'n.a.'
## Warning: Expecting numeric in D35999 / R35999C4: got 'n.a.'
## Warning: Expecting numeric in D36000 / R36000C4: got 'n.a.'
## Warning: Expecting numeric in D36001 / R36001C4: got 'n.a.'
## Warning: Expecting numeric in D36002 / R36002C4: got 'n.a.'
## Warning: Expecting numeric in D36003 / R36003C4: got 'n.a.'
## Warning: Expecting numeric in D36004 / R36004C4: got 'n.a.'
## Warning: Expecting numeric in D36005 / R36005C4: got 'n.a.'
## Warning: Expecting numeric in D36006 / R36006C4: got 'n.a.'
## Warning: Expecting numeric in D36007 / R36007C4: got 'n.a.'
## Warning: Expecting numeric in D36008 / R36008C4: got 'n.a.'
## Warning: Expecting numeric in D36009 / R36009C4: got 'n.a.'
## Warning: Expecting numeric in D36010 / R36010C4: got 'n.a.'
## Warning: Expecting numeric in D36011 / R36011C4: got 'n.a.'
## Warning: Expecting numeric in D36012 / R36012C4: got 'n.a.'
## Warning: Expecting numeric in D36013 / R36013C4: got 'n.a.'
## Warning: Expecting numeric in D36014 / R36014C4: got 'n.a.'
## Warning: Expecting numeric in D36015 / R36015C4: got 'n.a.'
## Warning: Expecting numeric in D36016 / R36016C4: got 'n.a.'
## Warning: Expecting numeric in D36017 / R36017C4: got 'n.a.'
## Warning: Expecting numeric in D36018 / R36018C4: got 'n.a.'
## Warning: Expecting numeric in D36019 / R36019C4: got 'n.a.'
## Warning: Expecting numeric in D36020 / R36020C4: got 'n.a.'
## Warning: Expecting numeric in D36021 / R36021C4: got 'n.a.'
## Warning: Expecting numeric in D36022 / R36022C4: got 'n.a.'
## Warning: Expecting numeric in D36023 / R36023C4: got 'n.a.'
## Warning: Expecting numeric in D36024 / R36024C4: got 'n.a.'
## Warning: Expecting numeric in D36025 / R36025C4: got 'n.a.'
## Warning: Expecting numeric in D36026 / R36026C4: got 'n.a.'
## Warning: Expecting numeric in D36027 / R36027C4: got 'n.a.'
## Warning: Expecting numeric in D36028 / R36028C4: got 'n.a.'
## Warning: Expecting numeric in D36029 / R36029C4: got 'n.a.'
## Warning: Expecting numeric in D36030 / R36030C4: got 'n.a.'
## Warning: Expecting numeric in D36031 / R36031C4: got 'n.a.'
## Warning: Expecting numeric in D36032 / R36032C4: got 'n.a.'
## Warning: Expecting numeric in D36033 / R36033C4: got 'n.a.'
## Warning: Expecting numeric in D36034 / R36034C4: got 'n.a.'
## Warning: Expecting numeric in D36035 / R36035C4: got 'n.a.'
## Warning: Expecting numeric in D36036 / R36036C4: got 'n.a.'
## Warning: Expecting numeric in D36037 / R36037C4: got 'n.a.'
## Warning: Expecting numeric in D36038 / R36038C4: got 'n.a.'
## Warning: Expecting numeric in D36039 / R36039C4: got 'n.a.'
## Warning: Expecting numeric in D36040 / R36040C4: got 'n.a.'
## Warning: Expecting numeric in D36041 / R36041C4: got 'n.a.'
## Warning: Expecting numeric in D36042 / R36042C4: got 'n.a.'
## Warning: Expecting numeric in D36043 / R36043C4: got 'n.a.'
## Warning: Expecting numeric in D36044 / R36044C4: got 'n.a.'
## Warning: Expecting numeric in D36045 / R36045C4: got 'n.a.'
## Warning: Expecting numeric in D36046 / R36046C4: got 'n.a.'
## Warning: Expecting numeric in D36047 / R36047C4: got 'n.a.'
## Warning: Expecting numeric in D36048 / R36048C4: got 'n.a.'
## Warning: Expecting numeric in D36049 / R36049C4: got 'n.a.'
## Warning: Expecting numeric in D36050 / R36050C4: got 'n.a.'
## Warning: Expecting numeric in D36051 / R36051C4: got 'n.a.'
## Warning: Expecting numeric in D36052 / R36052C4: got 'n.a.'
## Warning: Expecting numeric in D36053 / R36053C4: got 'n.a.'
## Warning: Expecting numeric in D36054 / R36054C4: got 'n.a.'
## Warning: Expecting numeric in D36055 / R36055C4: got 'n.a.'
## Warning: Expecting numeric in D36056 / R36056C4: got 'n.a.'
## Warning: Expecting numeric in D36057 / R36057C4: got 'n.a.'
## Warning: Expecting numeric in D36058 / R36058C4: got 'n.a.'
## Warning: Expecting numeric in D36059 / R36059C4: got 'n.a.'
## Warning: Expecting numeric in D36060 / R36060C4: got 'n.a.'
## Warning: Expecting numeric in D36061 / R36061C4: got 'n.a.'
## Warning: Expecting numeric in D36062 / R36062C4: got 'n.a.'
## Warning: Expecting numeric in D36063 / R36063C4: got 'n.a.'
## Warning: Expecting numeric in D36064 / R36064C4: got 'n.a.'
## Warning: Expecting numeric in D36065 / R36065C4: got 'n.a.'
## Warning: Expecting numeric in D36066 / R36066C4: got 'n.a.'
## Warning: Expecting numeric in D36067 / R36067C4: got 'n.a.'
## Warning: Expecting numeric in D36068 / R36068C4: got 'n.a.'
## Warning: Expecting numeric in D36069 / R36069C4: got 'n.a.'
## Warning: Expecting numeric in D36070 / R36070C4: got 'n.a.'
## Warning: Expecting numeric in D36071 / R36071C4: got 'n.a.'
## Warning: Expecting numeric in D36072 / R36072C4: got 'n.a.'
## Warning: Expecting numeric in D36073 / R36073C4: got 'n.a.'
## Warning: Expecting numeric in D36074 / R36074C4: got 'n.a.'
## Warning: Expecting numeric in D36075 / R36075C4: got 'n.a.'
## Warning: Expecting numeric in D36076 / R36076C4: got 'n.a.'
## Warning: Expecting numeric in D36077 / R36077C4: got 'n.a.'
## Warning: Expecting numeric in D36078 / R36078C4: got 'n.a.'
## Warning: Expecting numeric in D36079 / R36079C4: got 'n.a.'
## Warning: Expecting numeric in D36080 / R36080C4: got 'n.a.'
## Warning: Expecting numeric in D36081 / R36081C4: got 'n.a.'
## Warning: Expecting numeric in D36082 / R36082C4: got 'n.a.'
## Warning: Expecting numeric in D36083 / R36083C4: got 'n.a.'
## Warning: Expecting numeric in D36084 / R36084C4: got 'n.a.'
## Warning: Expecting numeric in D36085 / R36085C4: got 'n.a.'
## Warning: Expecting numeric in D36086 / R36086C4: got 'n.a.'
## Warning: Expecting numeric in D36087 / R36087C4: got 'n.a.'
## Warning: Expecting numeric in D36088 / R36088C4: got 'n.a.'
## Warning: Expecting numeric in D36089 / R36089C4: got 'n.a.'
## Warning: Expecting numeric in D36090 / R36090C4: got 'n.a.'
## Warning: Expecting numeric in D36091 / R36091C4: got 'n.a.'
## Warning: Expecting numeric in D36092 / R36092C4: got 'n.a.'
## Warning: Expecting numeric in D36093 / R36093C4: got 'n.a.'
## Warning: Expecting numeric in D36094 / R36094C4: got 'n.a.'
## Warning: Expecting numeric in D36095 / R36095C4: got 'n.a.'
## Warning: Expecting numeric in D36096 / R36096C4: got 'n.a.'
## Warning: Expecting numeric in D36097 / R36097C4: got 'n.a.'
## Warning: Expecting numeric in D36098 / R36098C4: got 'n.a.'
## Warning: Expecting numeric in D36099 / R36099C4: got 'n.a.'
## Warning: Expecting numeric in D36100 / R36100C4: got 'n.a.'
## Warning: Expecting numeric in D36101 / R36101C4: got 'n.a.'
## Warning: Expecting numeric in D36102 / R36102C4: got 'n.a.'
## Warning: Expecting numeric in D36103 / R36103C4: got 'n.a.'
## Warning: Expecting numeric in D36104 / R36104C4: got 'n.a.'
## Warning: Expecting numeric in D36105 / R36105C4: got 'n.a.'
## Warning: Expecting numeric in D36106 / R36106C4: got 'n.a.'
## Warning: Expecting numeric in D36107 / R36107C4: got 'n.a.'
## Warning: Expecting numeric in D36108 / R36108C4: got 'n.a.'
## Warning: Expecting numeric in D36109 / R36109C4: got 'n.a.'
## Warning: Expecting numeric in D36110 / R36110C4: got 'n.a.'
## Warning: Expecting numeric in D36111 / R36111C4: got 'n.a.'
## Warning: Expecting numeric in D36112 / R36112C4: got 'n.a.'
## Warning: Expecting numeric in D36113 / R36113C4: got 'n.a.'
## Warning: Expecting numeric in D36114 / R36114C4: got 'n.a.'
## Warning: Expecting numeric in D36115 / R36115C4: got 'n.a.'
## Warning: Expecting numeric in D36116 / R36116C4: got 'n.a.'
## Warning: Expecting numeric in D36117 / R36117C4: got 'n.a.'
## Warning: Expecting numeric in D36118 / R36118C4: got 'n.a.'
## Warning: Expecting numeric in D36119 / R36119C4: got 'n.a.'
## Warning: Expecting numeric in D36120 / R36120C4: got 'n.a.'
## Warning: Expecting numeric in D36121 / R36121C4: got 'n.a.'
## Warning: Expecting numeric in D36122 / R36122C4: got 'n.a.'
## Warning: Expecting numeric in D36123 / R36123C4: got 'n.a.'
## Warning: Expecting numeric in D36124 / R36124C4: got 'n.a.'
## Warning: Expecting numeric in D36125 / R36125C4: got 'n.a.'
## Warning: Expecting numeric in D36126 / R36126C4: got 'n.a.'
## Warning: Expecting numeric in D36127 / R36127C4: got 'n.a.'
## Warning: Expecting numeric in D36128 / R36128C4: got 'n.a.'
## Warning: Expecting numeric in D36129 / R36129C4: got 'n.a.'
## Warning: Expecting numeric in D36130 / R36130C4: got 'n.a.'
## Warning: Expecting numeric in D36131 / R36131C4: got 'n.a.'
## Warning: Expecting numeric in D36132 / R36132C4: got 'n.a.'
## Warning: Expecting numeric in D36133 / R36133C4: got 'n.a.'
## Warning: Expecting numeric in D36134 / R36134C4: got 'n.a.'
## Warning: Expecting numeric in D36135 / R36135C4: got 'n.a.'
## Warning: Expecting numeric in D36136 / R36136C4: got 'n.a.'
## Warning: Expecting numeric in D36137 / R36137C4: got 'n.a.'
## Warning: Expecting numeric in D36138 / R36138C4: got 'n.a.'
## Warning: Expecting numeric in D36139 / R36139C4: got 'n.a.'
## Warning: Expecting numeric in D36140 / R36140C4: got 'n.a.'
## Warning: Expecting numeric in D36141 / R36141C4: got 'n.a.'
## Warning: Expecting numeric in D36142 / R36142C4: got 'n.a.'
## Warning: Expecting numeric in D36143 / R36143C4: got 'n.a.'
## Warning: Expecting numeric in D36144 / R36144C4: got 'n.a.'
## Warning: Expecting numeric in D36145 / R36145C4: got 'n.a.'
## Warning: Expecting numeric in D36146 / R36146C4: got 'n.a.'
## Warning: Expecting numeric in D36147 / R36147C4: got 'n.a.'
## Warning: Expecting numeric in D36148 / R36148C4: got 'n.a.'
## Warning: Expecting numeric in D36149 / R36149C4: got 'n.a.'
## Warning: Expecting numeric in D36150 / R36150C4: got 'n.a.'
## Warning: Expecting numeric in D36151 / R36151C4: got 'n.a.'
## Warning: Expecting numeric in D36152 / R36152C4: got 'n.a.'
## Warning: Expecting numeric in D36153 / R36153C4: got 'n.a.'
## Warning: Expecting numeric in D36154 / R36154C4: got 'n.a.'
## Warning: Expecting numeric in D36155 / R36155C4: got 'n.a.'
## Warning: Expecting numeric in D36156 / R36156C4: got 'n.a.'
## Warning: Expecting numeric in D36157 / R36157C4: got 'n.a.'
## Warning: Expecting numeric in D36158 / R36158C4: got 'n.a.'
## Warning: Expecting numeric in D36159 / R36159C4: got 'n.a.'
## Warning: Expecting numeric in D36160 / R36160C4: got 'n.a.'
## Warning: Expecting numeric in D36161 / R36161C4: got 'n.a.'
## Warning: Expecting numeric in D36162 / R36162C4: got 'n.a.'
## Warning: Expecting numeric in D36163 / R36163C4: got 'n.a.'
## Warning: Expecting numeric in D36164 / R36164C4: got 'n.a.'
## Warning: Expecting numeric in D36165 / R36165C4: got 'n.a.'
## Warning: Expecting numeric in D36166 / R36166C4: got 'n.a.'
## Warning: Expecting numeric in D36167 / R36167C4: got 'n.a.'
## Warning: Expecting numeric in D36168 / R36168C4: got 'n.a.'
## Warning: Expecting numeric in D36169 / R36169C4: got 'n.a.'
## Warning: Expecting numeric in D36170 / R36170C4: got 'n.a.'
## Warning: Expecting numeric in D36171 / R36171C4: got 'n.a.'
## Warning: Expecting numeric in D36172 / R36172C4: got 'n.a.'
## Warning: Expecting numeric in D36173 / R36173C4: got 'n.a.'
## Warning: Expecting numeric in D36174 / R36174C4: got 'n.a.'
## Warning: Expecting numeric in D36175 / R36175C4: got 'n.a.'
## Warning: Expecting numeric in D36176 / R36176C4: got 'n.a.'
## Warning: Expecting numeric in D36177 / R36177C4: got 'n.a.'
## Warning: Expecting numeric in D36178 / R36178C4: got 'n.a.'
## Warning: Expecting numeric in D36179 / R36179C4: got 'n.a.'
## Warning: Expecting numeric in D36180 / R36180C4: got 'n.a.'
## Warning: Expecting numeric in D36181 / R36181C4: got 'n.a.'
## Warning: Expecting numeric in D36182 / R36182C4: got 'n.a.'
## Warning: Expecting numeric in D36183 / R36183C4: got 'n.a.'
## Warning: Expecting numeric in D36184 / R36184C4: got 'n.a.'
## Warning: Expecting numeric in D36185 / R36185C4: got 'n.a.'
## Warning: Expecting numeric in D36186 / R36186C4: got 'n.a.'
## Warning: Expecting numeric in D36187 / R36187C4: got 'n.a.'
## Warning: Expecting numeric in D36188 / R36188C4: got 'n.a.'
## Warning: Expecting numeric in D36189 / R36189C4: got 'n.a.'
## Warning: Expecting numeric in D36190 / R36190C4: got 'n.a.'
## Warning: Expecting numeric in D36191 / R36191C4: got 'n.a.'
## Warning: Expecting numeric in D36192 / R36192C4: got 'n.a.'
## Warning: Expecting numeric in D36193 / R36193C4: got 'n.a.'
## Warning: Expecting numeric in D36194 / R36194C4: got 'n.a.'
## Warning: Expecting numeric in D36195 / R36195C4: got 'n.a.'
## Warning: Expecting numeric in D36196 / R36196C4: got 'n.a.'
## Warning: Expecting numeric in D36197 / R36197C4: got 'n.a.'
## Warning: Expecting numeric in D36198 / R36198C4: got 'n.a.'
## Warning: Expecting numeric in D36199 / R36199C4: got 'n.a.'
## Warning: Expecting numeric in D36200 / R36200C4: got 'n.a.'
## Warning: Expecting numeric in D36201 / R36201C4: got 'n.a.'
## Warning: Expecting numeric in D36202 / R36202C4: got 'n.a.'
## Warning: Expecting numeric in D36203 / R36203C4: got 'n.a.'
## Warning: Expecting numeric in D36204 / R36204C4: got 'n.a.'
## Warning: Expecting numeric in D36205 / R36205C4: got 'n.a.'
## Warning: Expecting numeric in D36206 / R36206C4: got 'n.a.'
## Warning: Expecting numeric in D36207 / R36207C4: got 'n.a.'
## Warning: Expecting numeric in D36208 / R36208C4: got 'n.a.'
## Warning: Expecting numeric in D36209 / R36209C4: got 'n.a.'
## Warning: Expecting numeric in D36210 / R36210C4: got 'n.a.'
## Warning: Expecting numeric in D36211 / R36211C4: got 'n.a.'
## Warning: Expecting numeric in D36212 / R36212C4: got 'n.a.'
## Warning: Expecting numeric in D36213 / R36213C4: got 'n.a.'
## Warning: Expecting numeric in D36214 / R36214C4: got 'n.a.'
## Warning: Expecting numeric in D36215 / R36215C4: got 'n.a.'
## Warning: Expecting numeric in D36216 / R36216C4: got 'n.a.'
## Warning: Expecting numeric in D36217 / R36217C4: got 'n.a.'
## Warning: Expecting numeric in D36218 / R36218C4: got 'n.a.'
## Warning: Expecting numeric in D36219 / R36219C4: got 'n.a.'
## Warning: Expecting numeric in D36220 / R36220C4: got 'n.a.'
## Warning: Expecting numeric in D36221 / R36221C4: got 'n.a.'
## Warning: Expecting numeric in D36222 / R36222C4: got 'n.a.'
## Warning: Expecting numeric in D36223 / R36223C4: got 'n.a.'
## Warning: Expecting numeric in D36224 / R36224C4: got 'n.a.'
## Warning: Expecting numeric in D36225 / R36225C4: got 'n.a.'
## Warning: Expecting numeric in D36226 / R36226C4: got 'n.a.'
## Warning: Expecting numeric in D36227 / R36227C4: got 'n.a.'
## Warning: Expecting numeric in D36228 / R36228C4: got 'n.a.'
## Warning: Expecting numeric in D36229 / R36229C4: got 'n.a.'
## Warning: Expecting numeric in D36230 / R36230C4: got 'n.a.'
## Warning: Expecting numeric in D36231 / R36231C4: got 'n.a.'
## Warning: Expecting numeric in D36232 / R36232C4: got 'n.a.'
## Warning: Expecting numeric in D36233 / R36233C4: got 'n.a.'
## Warning: Expecting numeric in D36234 / R36234C4: got 'n.a.'
## Warning: Expecting numeric in D36235 / R36235C4: got 'n.a.'
## Warning: Expecting numeric in D36236 / R36236C4: got 'n.a.'
## Warning: Expecting numeric in D36237 / R36237C4: got 'n.a.'
## Warning: Expecting numeric in D36238 / R36238C4: got 'n.a.'
## Warning: Expecting numeric in D36239 / R36239C4: got 'n.a.'
## Warning: Expecting numeric in D36240 / R36240C4: got 'n.a.'
## Warning: Expecting numeric in D36241 / R36241C4: got 'n.a.'
## Warning: Expecting numeric in D36242 / R36242C4: got 'n.a.'
## Warning: Expecting numeric in D36243 / R36243C4: got 'n.a.'
## Warning: Expecting numeric in D36244 / R36244C4: got 'n.a.'
## Warning: Expecting numeric in D36245 / R36245C4: got 'n.a.'
## Warning: Expecting numeric in D36246 / R36246C4: got 'n.a.'
## Warning: Expecting numeric in D36247 / R36247C4: got 'n.a.'
## Warning: Expecting numeric in D36248 / R36248C4: got 'n.a.'
## Warning: Expecting numeric in D36249 / R36249C4: got 'n.a.'
## Warning: Expecting numeric in D36250 / R36250C4: got 'n.a.'
## Warning: Expecting numeric in D36251 / R36251C4: got 'n.a.'
## Warning: Expecting numeric in D36252 / R36252C4: got 'n.a.'
## Warning: Expecting numeric in D36253 / R36253C4: got 'n.a.'
## Warning: Expecting numeric in D36254 / R36254C4: got 'n.a.'
## Warning: Expecting numeric in D36255 / R36255C4: got 'n.a.'
## Warning: Expecting numeric in D36256 / R36256C4: got 'n.a.'
## Warning: Expecting numeric in D36257 / R36257C4: got 'n.a.'
## Warning: Expecting numeric in D36258 / R36258C4: got 'n.a.'
## Warning: Expecting numeric in D36259 / R36259C4: got 'n.a.'
## Warning: Expecting numeric in D36260 / R36260C4: got 'n.a.'
## Warning: Expecting numeric in D36261 / R36261C4: got 'n.a.'
## Warning: Expecting numeric in D36262 / R36262C4: got 'n.a.'
## Warning: Expecting numeric in D36263 / R36263C4: got 'n.a.'
## Warning: Expecting numeric in D36264 / R36264C4: got 'n.a.'
## Warning: Expecting numeric in D36265 / R36265C4: got 'n.a.'
## Warning: Expecting numeric in D36266 / R36266C4: got 'n.a.'
## Warning: Expecting numeric in D36267 / R36267C4: got 'n.a.'
## Warning: Expecting numeric in D36268 / R36268C4: got 'n.a.'
## Warning: Expecting numeric in D36269 / R36269C4: got 'n.a.'
## Warning: Expecting numeric in D36270 / R36270C4: got 'n.a.'
## Warning: Expecting numeric in D36271 / R36271C4: got 'n.a.'
## Warning: Expecting numeric in D36272 / R36272C4: got 'n.a.'
## Warning: Expecting numeric in D36273 / R36273C4: got 'n.a.'
## Warning: Expecting numeric in D36274 / R36274C4: got 'n.a.'
## Warning: Expecting numeric in D36275 / R36275C4: got 'n.a.'
## Warning: Expecting numeric in D36276 / R36276C4: got 'n.a.'
## Warning: Expecting numeric in D36277 / R36277C4: got 'n.a.'
## Warning: Expecting numeric in D36278 / R36278C4: got 'n.a.'
## Warning: Expecting numeric in D36279 / R36279C4: got 'n.a.'
## Warning: Expecting numeric in D36280 / R36280C4: got 'n.a.'
## Warning: Expecting numeric in D36281 / R36281C4: got 'n.a.'
## Warning: Expecting numeric in D36282 / R36282C4: got 'n.a.'
## Warning: Expecting numeric in D36283 / R36283C4: got 'n.a.'
## Warning: Expecting numeric in D36284 / R36284C4: got 'n.a.'
## Warning: Expecting numeric in D36285 / R36285C4: got 'n.a.'
## Warning: Expecting numeric in D36286 / R36286C4: got 'n.a.'
## Warning: Expecting numeric in D36287 / R36287C4: got 'n.a.'
## Warning: Expecting numeric in D36288 / R36288C4: got 'n.a.'
## Warning: Expecting numeric in D36289 / R36289C4: got 'n.a.'
## Warning: Expecting numeric in D36290 / R36290C4: got 'n.a.'
## Warning: Expecting numeric in D36291 / R36291C4: got 'n.a.'
## Warning: Expecting numeric in D36292 / R36292C4: got 'n.a.'
## Warning: Expecting numeric in D36293 / R36293C4: got 'n.a.'
## Warning: Expecting numeric in D36294 / R36294C4: got 'n.a.'
## Warning: Expecting numeric in D36295 / R36295C4: got 'n.a.'
## Warning: Expecting numeric in D36296 / R36296C4: got 'n.a.'
## Warning: Expecting numeric in D36297 / R36297C4: got 'n.a.'
## Warning: Expecting numeric in D36298 / R36298C4: got 'n.a.'
## Warning: Expecting numeric in D36299 / R36299C4: got 'n.a.'
## Warning: Expecting numeric in D36300 / R36300C4: got 'n.a.'
## Warning: Expecting numeric in D36301 / R36301C4: got 'n.a.'
## Warning: Expecting numeric in D36302 / R36302C4: got 'n.a.'
## Warning: Expecting numeric in D36303 / R36303C4: got 'n.a.'
## Warning: Expecting numeric in D36304 / R36304C4: got 'n.a.'
## Warning: Expecting numeric in D36305 / R36305C4: got 'n.a.'
## Warning: Expecting numeric in D36306 / R36306C4: got 'n.a.'
## Warning: Expecting numeric in D36307 / R36307C4: got 'n.a.'
## Warning: Expecting numeric in D36308 / R36308C4: got 'n.a.'
## Warning: Expecting numeric in D36309 / R36309C4: got 'n.a.'
## Warning: Expecting numeric in D36310 / R36310C4: got 'n.a.'
## Warning: Expecting numeric in D36311 / R36311C4: got 'n.a.'
## Warning: Expecting numeric in D36312 / R36312C4: got 'n.a.'
## Warning: Expecting numeric in D36313 / R36313C4: got 'n.a.'
## Warning: Expecting numeric in D36314 / R36314C4: got 'n.a.'
## Warning: Expecting numeric in D36315 / R36315C4: got 'n.a.'
## Warning: Expecting numeric in D36316 / R36316C4: got 'n.a.'
## Warning: Expecting numeric in D36317 / R36317C4: got 'n.a.'
## Warning: Expecting numeric in D36318 / R36318C4: got 'n.a.'
## Warning: Expecting numeric in D36319 / R36319C4: got 'n.a.'
## Warning: Expecting numeric in D36320 / R36320C4: got 'n.a.'
## Warning: Expecting numeric in D36321 / R36321C4: got 'n.a.'
## Warning: Expecting numeric in D36322 / R36322C4: got 'n.a.'
## Warning: Expecting numeric in D36323 / R36323C4: got 'n.a.'
## Warning: Expecting numeric in D36324 / R36324C4: got 'n.a.'
## Warning: Expecting numeric in D36325 / R36325C4: got 'n.a.'
## Warning: Expecting numeric in D36326 / R36326C4: got 'n.a.'
## Warning: Expecting numeric in D36327 / R36327C4: got 'n.a.'
## Warning: Expecting numeric in D36328 / R36328C4: got 'n.a.'
## Warning: Expecting numeric in D36329 / R36329C4: got 'n.a.'
## Warning: Expecting numeric in D36330 / R36330C4: got 'n.a.'
## Warning: Expecting numeric in D36331 / R36331C4: got 'n.a.'
## Warning: Expecting numeric in D36332 / R36332C4: got 'n.a.'
## Warning: Expecting numeric in D36333 / R36333C4: got 'n.a.'
## Warning: Expecting numeric in D36334 / R36334C4: got 'n.a.'
## Warning: Expecting numeric in D36335 / R36335C4: got 'n.a.'
## Warning: Expecting numeric in D36336 / R36336C4: got 'n.a.'
## Warning: Expecting numeric in D36337 / R36337C4: got 'n.a.'
## Warning: Expecting numeric in D36338 / R36338C4: got 'n.a.'
## Warning: Expecting numeric in D36339 / R36339C4: got 'n.a.'
## Warning: Expecting numeric in D36340 / R36340C4: got 'n.a.'
## Warning: Expecting numeric in D36341 / R36341C4: got 'n.a.'
## Warning: Expecting numeric in D36342 / R36342C4: got 'n.a.'
## Warning: Expecting numeric in D36343 / R36343C4: got 'n.a.'
## Warning: Expecting numeric in D36344 / R36344C4: got 'n.a.'
## Warning: Expecting numeric in D36345 / R36345C4: got 'n.a.'
## Warning: Expecting numeric in D36346 / R36346C4: got 'n.a.'
## Warning: Expecting numeric in D36347 / R36347C4: got 'n.a.'
## Warning: Expecting numeric in D36348 / R36348C4: got 'n.a.'
## Warning: Expecting numeric in D36349 / R36349C4: got 'n.a.'
## Warning: Expecting numeric in D36350 / R36350C4: got 'n.a.'
## Warning: Expecting numeric in D36351 / R36351C4: got 'n.a.'
## Warning: Expecting numeric in D36352 / R36352C4: got 'n.a.'
## Warning: Expecting numeric in D36353 / R36353C4: got 'n.a.'
## Warning: Expecting numeric in D36354 / R36354C4: got 'n.a.'
## Warning: Expecting numeric in D36355 / R36355C4: got 'n.a.'
## Warning: Expecting numeric in D36356 / R36356C4: got 'n.a.'
## Warning: Expecting numeric in D36357 / R36357C4: got 'n.a.'
## Warning: Expecting numeric in D36358 / R36358C4: got 'n.a.'
## Warning: Expecting numeric in D36359 / R36359C4: got 'n.a.'
## Warning: Expecting numeric in D36360 / R36360C4: got 'n.a.'
## Warning: Expecting numeric in D36361 / R36361C4: got 'n.a.'
## Warning: Expecting numeric in D36362 / R36362C4: got 'n.a.'
## Warning: Expecting numeric in D36363 / R36363C4: got 'n.a.'
## Warning: Expecting numeric in D36364 / R36364C4: got 'n.a.'
## Warning: Expecting numeric in D36365 / R36365C4: got 'n.a.'
## Warning: Expecting numeric in D36366 / R36366C4: got 'n.a.'
## Warning: Expecting numeric in D36367 / R36367C4: got 'n.a.'
## Warning: Expecting numeric in D36368 / R36368C4: got 'n.a.'
## Warning: Expecting numeric in D36369 / R36369C4: got 'n.a.'
## Warning: Expecting numeric in D36370 / R36370C4: got 'n.a.'
## Warning: Expecting numeric in D36371 / R36371C4: got 'n.a.'
## Warning: Expecting numeric in D36372 / R36372C4: got 'n.a.'
## Warning: Expecting numeric in D36373 / R36373C4: got 'n.a.'
## Warning: Expecting numeric in D36374 / R36374C4: got 'n.a.'
## Warning: Expecting numeric in D36375 / R36375C4: got 'n.a.'
## Warning: Expecting numeric in D36376 / R36376C4: got 'n.a.'
## Warning: Expecting numeric in D36377 / R36377C4: got 'n.a.'
## Warning: Expecting numeric in D36378 / R36378C4: got 'n.a.'
## Warning: Expecting numeric in D36379 / R36379C4: got 'n.a.'
## Warning: Expecting numeric in D36380 / R36380C4: got 'n.a.'
## Warning: Expecting numeric in D36381 / R36381C4: got 'n.a.'
## Warning: Expecting numeric in D36382 / R36382C4: got 'n.a.'
## Warning: Expecting numeric in D36383 / R36383C4: got 'n.a.'
## Warning: Expecting numeric in D36384 / R36384C4: got 'n.a.'
## Warning: Expecting numeric in D36385 / R36385C4: got 'n.a.'
## Warning: Expecting numeric in D36386 / R36386C4: got 'n.a.'
## Warning: Expecting numeric in D36387 / R36387C4: got 'n.a.'
## Warning: Expecting numeric in D36388 / R36388C4: got 'n.a.'
## Warning: Expecting numeric in D36389 / R36389C4: got 'n.a.'
## Warning: Expecting numeric in D36390 / R36390C4: got 'n.a.'
## Warning: Expecting numeric in D36391 / R36391C4: got 'n.a.'
## Warning: Expecting numeric in D36392 / R36392C4: got 'n.a.'
## Warning: Expecting numeric in D36393 / R36393C4: got 'n.a.'
## Warning: Expecting numeric in D36394 / R36394C4: got 'n.a.'
## Warning: Expecting numeric in D36395 / R36395C4: got 'n.a.'
## Warning: Expecting numeric in D36396 / R36396C4: got 'n.a.'
## Warning: Expecting numeric in D36397 / R36397C4: got 'n.a.'
## Warning: Expecting numeric in D36398 / R36398C4: got 'n.a.'
## Warning: Expecting numeric in D36399 / R36399C4: got 'n.a.'
## Warning: Expecting numeric in D36400 / R36400C4: got 'n.a.'
## Warning: Expecting numeric in D36401 / R36401C4: got 'n.a.'
## Warning: Expecting numeric in D36402 / R36402C4: got 'n.a.'
## Warning: Expecting numeric in D36403 / R36403C4: got 'n.a.'
## Warning: Expecting numeric in D36404 / R36404C4: got 'n.a.'
## Warning: Expecting numeric in D36405 / R36405C4: got 'n.a.'
## Warning: Expecting numeric in D36406 / R36406C4: got 'n.a.'
## Warning: Expecting numeric in D36407 / R36407C4: got 'n.a.'
## Warning: Expecting numeric in D36408 / R36408C4: got 'n.a.'
## Warning: Expecting numeric in D36409 / R36409C4: got 'n.a.'
## Warning: Expecting numeric in D36410 / R36410C4: got 'n.a.'
## Warning: Expecting numeric in D36411 / R36411C4: got 'n.a.'
## Warning: Expecting numeric in D36412 / R36412C4: got 'n.a.'
## Warning: Expecting numeric in D36413 / R36413C4: got 'n.a.'
## Warning: Expecting numeric in D36414 / R36414C4: got 'n.a.'
## Warning: Expecting numeric in D36415 / R36415C4: got 'n.a.'
## Warning: Expecting numeric in D36416 / R36416C4: got 'n.a.'
## Warning: Expecting numeric in D36417 / R36417C4: got 'n.a.'
## Warning: Expecting numeric in D36418 / R36418C4: got 'n.a.'
## Warning: Expecting numeric in D36419 / R36419C4: got 'n.a.'
## Warning: Expecting numeric in D36420 / R36420C4: got 'n.a.'
## Warning: Expecting numeric in D36421 / R36421C4: got 'n.a.'
## Warning: Expecting numeric in D36422 / R36422C4: got 'n.a.'
## Warning: Expecting numeric in D36423 / R36423C4: got 'n.a.'
## Warning: Expecting numeric in D36424 / R36424C4: got 'n.a.'
## Warning: Expecting numeric in D36425 / R36425C4: got 'n.a.'
## Warning: Expecting numeric in D36426 / R36426C4: got 'n.a.'
## Warning: Expecting numeric in D36427 / R36427C4: got 'n.a.'
## Warning: Expecting numeric in D36428 / R36428C4: got 'n.a.'
## Warning: Expecting numeric in D36429 / R36429C4: got 'n.a.'
## Warning: Expecting numeric in D36430 / R36430C4: got 'n.a.'
## Warning: Expecting numeric in D36431 / R36431C4: got 'n.a.'
## Warning: Expecting numeric in D36432 / R36432C4: got 'n.a.'
## Warning: Expecting numeric in D36433 / R36433C4: got 'n.a.'
## Warning: Expecting numeric in D36434 / R36434C4: got 'n.a.'
## Warning: Expecting numeric in D36435 / R36435C4: got 'n.a.'
## Warning: Expecting numeric in D36436 / R36436C4: got 'n.a.'
## Warning: Expecting numeric in D36437 / R36437C4: got 'n.a.'
## Warning: Expecting numeric in D36438 / R36438C4: got 'n.a.'
## Warning: Expecting numeric in D36439 / R36439C4: got 'n.a.'
## Warning: Expecting numeric in D36440 / R36440C4: got 'n.a.'
## Warning: Expecting numeric in D36441 / R36441C4: got 'n.a.'
## Warning: Expecting numeric in D36442 / R36442C4: got 'n.a.'
## Warning: Expecting numeric in D36443 / R36443C4: got 'n.a.'
## Warning: Expecting numeric in D36444 / R36444C4: got 'n.a.'
## Warning: Expecting numeric in D36445 / R36445C4: got 'n.a.'
## Warning: Expecting numeric in D36446 / R36446C4: got 'n.a.'
## Warning: Expecting numeric in D36447 / R36447C4: got 'n.a.'
## Warning: Expecting numeric in D36448 / R36448C4: got 'n.a.'
## Warning: Expecting numeric in D36449 / R36449C4: got 'n.a.'
## Warning: Expecting numeric in D36450 / R36450C4: got 'n.a.'
## Warning: Expecting numeric in D36451 / R36451C4: got 'n.a.'
## Warning: Expecting numeric in D36452 / R36452C4: got 'n.a.'
## Warning: Expecting numeric in D36453 / R36453C4: got 'n.a.'
## Warning: Expecting numeric in D36454 / R36454C4: got 'n.a.'
## Warning: Expecting numeric in D36455 / R36455C4: got 'n.a.'
## Warning: Expecting numeric in D36456 / R36456C4: got 'n.a.'
## Warning: Expecting numeric in D36457 / R36457C4: got 'n.a.'
## Warning: Expecting numeric in D36458 / R36458C4: got 'n.a.'
## Warning: Expecting numeric in D36459 / R36459C4: got 'n.a.'
## Warning: Expecting numeric in D36460 / R36460C4: got 'n.a.'
## Warning: Expecting numeric in D36461 / R36461C4: got 'n.a.'
## Warning: Expecting numeric in D36462 / R36462C4: got 'n.a.'
## Warning: Expecting numeric in D36463 / R36463C4: got 'n.a.'
## Warning: Expecting numeric in D36464 / R36464C4: got 'n.a.'
## Warning: Expecting numeric in D36465 / R36465C4: got 'n.a.'
## Warning: Expecting numeric in D36466 / R36466C4: got 'n.a.'
## Warning: Expecting numeric in D36467 / R36467C4: got 'n.a.'
## Warning: Expecting numeric in D36468 / R36468C4: got 'n.a.'
## Warning: Expecting numeric in D36469 / R36469C4: got 'n.a.'
## Warning: Expecting numeric in D36470 / R36470C4: got 'n.a.'
## Warning: Expecting numeric in D36471 / R36471C4: got 'n.a.'
## Warning: Expecting numeric in D36472 / R36472C4: got 'n.a.'
## Warning: Expecting numeric in D36473 / R36473C4: got 'n.a.'
## Warning: Expecting numeric in D36474 / R36474C4: got 'n.a.'
## Warning: Expecting numeric in D36475 / R36475C4: got 'n.a.'
## Warning: Expecting numeric in D36476 / R36476C4: got 'n.a.'
## Warning: Expecting numeric in D36477 / R36477C4: got 'n.a.'
## Warning: Expecting numeric in D36478 / R36478C4: got 'n.a.'
## Warning: Expecting numeric in D36479 / R36479C4: got 'n.a.'
## Warning: Expecting numeric in D36480 / R36480C4: got 'n.a.'
## Warning: Expecting numeric in D36481 / R36481C4: got 'n.a.'
## Warning: Expecting numeric in D36482 / R36482C4: got 'n.a.'
## Warning: Expecting numeric in D36483 / R36483C4: got 'n.a.'
## Warning: Expecting numeric in D36484 / R36484C4: got 'n.a.'
## Warning: Expecting numeric in D36485 / R36485C4: got 'n.a.'
## Warning: Expecting numeric in D36486 / R36486C4: got 'n.a.'
## Warning: Expecting numeric in D36487 / R36487C4: got 'n.a.'
## Warning: Expecting numeric in D36488 / R36488C4: got 'n.a.'
## Warning: Expecting numeric in D36489 / R36489C4: got 'n.a.'
## Warning: Expecting numeric in D36490 / R36490C4: got 'n.a.'
## Warning: Expecting numeric in D36491 / R36491C4: got 'n.a.'
## Warning: Expecting numeric in D36492 / R36492C4: got 'n.a.'
## Warning: Expecting numeric in D36493 / R36493C4: got 'n.a.'
## Warning: Expecting numeric in D36494 / R36494C4: got 'n.a.'
## Warning: Expecting numeric in D36495 / R36495C4: got 'n.a.'
## Warning: Expecting numeric in D36496 / R36496C4: got 'n.a.'
## Warning: Expecting numeric in D36497 / R36497C4: got 'n.a.'
## Warning: Expecting numeric in D36498 / R36498C4: got 'n.a.'
## Warning: Expecting numeric in D36499 / R36499C4: got 'n.a.'
## Warning: Expecting numeric in D36500 / R36500C4: got 'n.a.'
## Warning: Expecting numeric in D36501 / R36501C4: got 'n.a.'
## Warning: Expecting numeric in D36502 / R36502C4: got 'n.a.'
## Warning: Expecting numeric in D36503 / R36503C4: got 'n.a.'
## Warning: Expecting numeric in D36504 / R36504C4: got 'n.a.'
## Warning: Expecting numeric in D36505 / R36505C4: got 'n.a.'
## Warning: Expecting numeric in D36506 / R36506C4: got 'n.a.'
## Warning: Expecting numeric in D36507 / R36507C4: got 'n.a.'
## Warning: Expecting numeric in D36508 / R36508C4: got 'n.a.'
## Warning: Expecting numeric in D36509 / R36509C4: got 'n.a.'
## Warning: Expecting numeric in D36510 / R36510C4: got 'n.a.'
## Warning: Expecting numeric in D36511 / R36511C4: got 'n.a.'
## Warning: Expecting numeric in D36512 / R36512C4: got 'n.a.'
## Warning: Expecting numeric in D36513 / R36513C4: got 'n.a.'
## Warning: Expecting numeric in D36514 / R36514C4: got 'n.a.'
## Warning: Expecting numeric in D36515 / R36515C4: got 'n.a.'
## Warning: Expecting numeric in D36516 / R36516C4: got 'n.a.'
## Warning: Expecting numeric in D36517 / R36517C4: got 'n.a.'
## Warning: Expecting numeric in D36518 / R36518C4: got 'n.a.'
## Warning: Expecting numeric in D36519 / R36519C4: got 'n.a.'
## Warning: Expecting numeric in D36520 / R36520C4: got 'n.a.'
## Warning: Expecting numeric in D36521 / R36521C4: got 'n.a.'
## Warning: Expecting numeric in D36522 / R36522C4: got 'n.a.'
## Warning: Expecting numeric in D36523 / R36523C4: got 'n.a.'
## Warning: Expecting numeric in D36524 / R36524C4: got 'n.a.'
## Warning: Expecting numeric in D36525 / R36525C4: got 'n.a.'
## Warning: Expecting numeric in D36526 / R36526C4: got 'n.a.'
## Warning: Expecting numeric in D36527 / R36527C4: got 'n.a.'
## Warning: Expecting numeric in D36528 / R36528C4: got 'n.a.'
## Warning: Expecting numeric in D36529 / R36529C4: got 'n.a.'
## Warning: Expecting numeric in D36530 / R36530C4: got 'n.a.'
## Warning: Expecting numeric in D36531 / R36531C4: got 'n.a.'
## Warning: Expecting numeric in D36532 / R36532C4: got 'n.a.'
## Warning: Expecting numeric in D36533 / R36533C4: got 'n.a.'
## Warning: Expecting numeric in D36534 / R36534C4: got 'n.a.'
## Warning: Expecting numeric in D36535 / R36535C4: got 'n.a.'
## Warning: Expecting numeric in D36536 / R36536C4: got 'n.a.'
## Warning: Expecting numeric in D36537 / R36537C4: got 'n.a.'
## Warning: Expecting numeric in D36538 / R36538C4: got 'n.a.'
## Warning: Expecting numeric in D36539 / R36539C4: got 'n.a.'
## Warning: Expecting numeric in D36540 / R36540C4: got 'n.a.'
## Warning: Expecting numeric in D36541 / R36541C4: got 'n.a.'
## Warning: Expecting numeric in D36542 / R36542C4: got 'n.a.'
## Warning: Expecting numeric in D36543 / R36543C4: got 'n.a.'
## Warning: Expecting numeric in D36544 / R36544C4: got 'n.a.'
## Warning: Expecting numeric in D36545 / R36545C4: got 'n.a.'
## Warning: Expecting numeric in D36546 / R36546C4: got 'n.a.'
## Warning: Expecting numeric in D36547 / R36547C4: got 'n.a.'
## Warning: Expecting numeric in D36548 / R36548C4: got 'n.a.'
## Warning: Expecting numeric in D36549 / R36549C4: got 'n.a.'
## Warning: Expecting numeric in D36550 / R36550C4: got 'n.a.'
## Warning: Expecting numeric in D36551 / R36551C4: got 'n.a.'
## Warning: Expecting numeric in D36552 / R36552C4: got 'n.a.'
## Warning: Expecting numeric in D36553 / R36553C4: got 'n.a.'
## Warning: Expecting numeric in D36554 / R36554C4: got 'n.a.'
## Warning: Expecting numeric in D36555 / R36555C4: got 'n.a.'
## Warning: Expecting numeric in D36556 / R36556C4: got 'n.a.'
## Warning: Expecting numeric in D36557 / R36557C4: got 'n.a.'
## Warning: Expecting numeric in D36558 / R36558C4: got 'n.a.'
## Warning: Expecting numeric in D36559 / R36559C4: got 'n.a.'
## Warning: Expecting numeric in D36560 / R36560C4: got 'n.a.'
## Warning: Expecting numeric in D36561 / R36561C4: got 'n.a.'
## Warning: Expecting numeric in D36562 / R36562C4: got 'n.a.'
## Warning: Expecting numeric in D36563 / R36563C4: got 'n.a.'
## Warning: Expecting numeric in D36564 / R36564C4: got 'n.a.'
## Warning: Expecting numeric in D36565 / R36565C4: got 'n.a.'
## Warning: Expecting numeric in D36566 / R36566C4: got 'n.a.'
## Warning: Expecting numeric in D36567 / R36567C4: got 'n.a.'
## Warning: Expecting numeric in D36568 / R36568C4: got 'n.a.'
## Warning: Expecting numeric in D36569 / R36569C4: got 'n.a.'
## Warning: Expecting numeric in D36570 / R36570C4: got 'n.a.'
## Warning: Expecting numeric in D36571 / R36571C4: got 'n.a.'
## Warning: Expecting numeric in D36572 / R36572C4: got 'n.a.'
## Warning: Expecting numeric in D36573 / R36573C4: got 'n.a.'
## Warning: Expecting numeric in D36574 / R36574C4: got 'n.a.'
## Warning: Expecting numeric in D36575 / R36575C4: got 'n.a.'
## Warning: Expecting numeric in D36576 / R36576C4: got 'n.a.'
## Warning: Expecting numeric in D36577 / R36577C4: got 'n.a.'
## Warning: Expecting numeric in D36578 / R36578C4: got 'n.a.'
## Warning: Expecting numeric in D36579 / R36579C4: got 'n.a.'
## Warning: Expecting numeric in D36580 / R36580C4: got 'n.a.'
## Warning: Expecting numeric in D36581 / R36581C4: got 'n.a.'
## Warning: Expecting numeric in D36582 / R36582C4: got 'n.a.'
## Warning: Expecting numeric in D36583 / R36583C4: got 'n.a.'
## Warning: Expecting numeric in D36584 / R36584C4: got 'n.a.'
## Warning: Expecting numeric in D36585 / R36585C4: got 'n.a.'
## Warning: Expecting numeric in D36586 / R36586C4: got 'n.a.'
## Warning: Expecting numeric in D36587 / R36587C4: got 'n.a.'
## Warning: Expecting numeric in D36588 / R36588C4: got 'n.a.'
## Warning: Expecting numeric in D36589 / R36589C4: got 'n.a.'
## Warning: Expecting numeric in D36590 / R36590C4: got 'n.a.'
## Warning: Expecting numeric in D36591 / R36591C4: got 'n.a.'
## Warning: Expecting numeric in D36592 / R36592C4: got 'n.a.'
## Warning: Expecting numeric in D36593 / R36593C4: got 'n.a.'
## Warning: Expecting numeric in D36594 / R36594C4: got 'n.a.'
## Warning: Expecting numeric in D36595 / R36595C4: got 'n.a.'
## Warning: Expecting numeric in D36596 / R36596C4: got 'n.a.'
## Warning: Expecting numeric in D36597 / R36597C4: got 'n.a.'
## Warning: Expecting numeric in D36598 / R36598C4: got 'n.a.'
## Warning: Expecting numeric in D36599 / R36599C4: got 'n.a.'
## Warning: Expecting numeric in D36600 / R36600C4: got 'n.a.'
## Warning: Expecting numeric in D36601 / R36601C4: got 'n.a.'
## Warning: Expecting numeric in D36602 / R36602C4: got 'n.a.'
## Warning: Expecting numeric in D36603 / R36603C4: got 'n.a.'
## Warning: Expecting numeric in D36604 / R36604C4: got 'n.a.'
## Warning: Expecting numeric in D36605 / R36605C4: got 'n.a.'
## Warning: Expecting numeric in D36606 / R36606C4: got 'n.a.'
## Warning: Expecting numeric in D36607 / R36607C4: got 'n.a.'
## Warning: Expecting numeric in D36608 / R36608C4: got 'n.a.'
## Warning: Expecting numeric in D36609 / R36609C4: got 'n.a.'
## Warning: Expecting numeric in D36610 / R36610C4: got 'n.a.'
## Warning: Expecting numeric in D36611 / R36611C4: got 'n.a.'
## Warning: Expecting numeric in D36612 / R36612C4: got 'n.a.'
## Warning: Expecting numeric in D36613 / R36613C4: got 'n.a.'
## Warning: Expecting numeric in D36614 / R36614C4: got 'n.a.'
## Warning: Expecting numeric in D36615 / R36615C4: got 'n.a.'
## Warning: Expecting numeric in D36616 / R36616C4: got 'n.a.'
## Warning: Expecting numeric in D36617 / R36617C4: got 'n.a.'
## Warning: Expecting numeric in D36618 / R36618C4: got 'n.a.'
## Warning: Expecting numeric in D36619 / R36619C4: got 'n.a.'
## Warning: Expecting numeric in D36620 / R36620C4: got 'n.a.'
## Warning: Expecting numeric in D36621 / R36621C4: got 'n.a.'
## Warning: Expecting numeric in D36622 / R36622C4: got 'n.a.'
## Warning: Expecting numeric in D36623 / R36623C4: got 'n.a.'
## Warning: Expecting numeric in D36624 / R36624C4: got 'n.a.'
## Warning: Expecting numeric in D36625 / R36625C4: got 'n.a.'
## Warning: Expecting numeric in D36626 / R36626C4: got 'n.a.'
## Warning: Expecting numeric in D36627 / R36627C4: got 'n.a.'
## Warning: Expecting numeric in D36628 / R36628C4: got 'n.a.'
## Warning: Expecting numeric in D36629 / R36629C4: got 'n.a.'
## Warning: Expecting numeric in D36630 / R36630C4: got 'n.a.'
## Warning: Expecting numeric in D36631 / R36631C4: got 'n.a.'
## Warning: Expecting numeric in D36632 / R36632C4: got 'n.a.'
## Warning: Expecting numeric in D36633 / R36633C4: got 'n.a.'
## Warning: Expecting numeric in D36634 / R36634C4: got 'n.a.'
## Warning: Expecting numeric in D36635 / R36635C4: got 'n.a.'
## Warning: Expecting numeric in D36636 / R36636C4: got 'n.a.'
## Warning: Expecting numeric in D36637 / R36637C4: got 'n.a.'
## Warning: Expecting numeric in D36638 / R36638C4: got 'n.a.'
## Warning: Expecting numeric in D36639 / R36639C4: got 'n.a.'
## Warning: Expecting numeric in D36640 / R36640C4: got 'n.a.'
## Warning: Expecting numeric in D36641 / R36641C4: got 'n.a.'
## Warning: Expecting numeric in D36642 / R36642C4: got 'n.a.'
## Warning: Expecting numeric in D36643 / R36643C4: got 'n.a.'
## Warning: Expecting numeric in D36644 / R36644C4: got 'n.a.'
## Warning: Expecting numeric in D36645 / R36645C4: got 'n.a.'
## Warning: Expecting numeric in D36646 / R36646C4: got 'n.a.'
## Warning: Expecting numeric in D36647 / R36647C4: got 'n.a.'
## Warning: Expecting numeric in D36648 / R36648C4: got 'n.a.'
## Warning: Expecting numeric in D36649 / R36649C4: got 'n.a.'
## Warning: Expecting numeric in D36650 / R36650C4: got 'n.a.'
## Warning: Expecting numeric in D36651 / R36651C4: got 'n.a.'
## Warning: Expecting numeric in D36652 / R36652C4: got 'n.a.'
## Warning: Expecting numeric in D36653 / R36653C4: got 'n.a.'
## Warning: Expecting numeric in D36654 / R36654C4: got 'n.a.'
## Warning: Expecting numeric in D36655 / R36655C4: got 'n.a.'
## Warning: Expecting numeric in D36656 / R36656C4: got 'n.a.'
## Warning: Expecting numeric in D36657 / R36657C4: got 'n.a.'
## Warning: Expecting numeric in D36658 / R36658C4: got 'n.a.'
## Warning: Expecting numeric in D36659 / R36659C4: got 'n.a.'
## Warning: Expecting numeric in D36660 / R36660C4: got 'n.a.'
## Warning: Expecting numeric in D36661 / R36661C4: got 'n.a.'
## Warning: Expecting numeric in D36662 / R36662C4: got 'n.a.'
## Warning: Expecting numeric in D36663 / R36663C4: got 'n.a.'
## Warning: Expecting numeric in D36664 / R36664C4: got 'n.a.'
## Warning: Expecting numeric in D36665 / R36665C4: got 'n.a.'
## Warning: Expecting numeric in D36666 / R36666C4: got 'n.a.'
## Warning: Expecting numeric in D36667 / R36667C4: got 'n.a.'
## Warning: Expecting numeric in D36668 / R36668C4: got 'n.a.'
## Warning: Expecting numeric in D36669 / R36669C4: got 'n.a.'
## Warning: Expecting numeric in D36670 / R36670C4: got 'n.a.'
## Warning: Expecting numeric in D36671 / R36671C4: got 'n.a.'
## Warning: Expecting numeric in D36672 / R36672C4: got 'n.a.'
## Warning: Expecting numeric in D36673 / R36673C4: got 'n.a.'
## Warning: Expecting numeric in D36674 / R36674C4: got 'n.a.'
## Warning: Expecting numeric in D36675 / R36675C4: got 'n.a.'
## Warning: Expecting numeric in D36676 / R36676C4: got 'n.a.'
## Warning: Expecting numeric in D36677 / R36677C4: got 'n.a.'
## Warning: Expecting numeric in D36678 / R36678C4: got 'n.a.'
## Warning: Expecting numeric in D36679 / R36679C4: got 'n.a.'
## Warning: Expecting numeric in D36680 / R36680C4: got 'n.a.'
## Warning: Expecting numeric in D36681 / R36681C4: got 'n.a.'
## Warning: Expecting numeric in D36682 / R36682C4: got 'n.a.'
## Warning: Expecting numeric in D36683 / R36683C4: got 'n.a.'
## Warning: Expecting numeric in D36684 / R36684C4: got 'n.a.'
## Warning: Expecting numeric in D36685 / R36685C4: got 'n.a.'
## Warning: Expecting numeric in D36686 / R36686C4: got 'n.a.'
## Warning: Expecting numeric in D36687 / R36687C4: got 'n.a.'
## Warning: Expecting numeric in D36688 / R36688C4: got 'n.a.'
## Warning: Expecting numeric in D36689 / R36689C4: got 'n.a.'
## Warning: Expecting numeric in D36690 / R36690C4: got 'n.a.'
## Warning: Expecting numeric in D36691 / R36691C4: got 'n.a.'
## Warning: Expecting numeric in D36692 / R36692C4: got 'n.a.'
## Warning: Expecting numeric in D36693 / R36693C4: got 'n.a.'
## Warning: Expecting numeric in D36694 / R36694C4: got 'n.a.'
## Warning: Expecting numeric in D36695 / R36695C4: got 'n.a.'
## Warning: Expecting numeric in D36696 / R36696C4: got 'n.a.'
## Warning: Expecting numeric in D36697 / R36697C4: got 'n.a.'
## Warning: Expecting numeric in D36698 / R36698C4: got 'n.a.'
## Warning: Expecting numeric in D36699 / R36699C4: got 'n.a.'
## Warning: Expecting numeric in D36700 / R36700C4: got 'n.a.'
## Warning: Expecting numeric in D36701 / R36701C4: got 'n.a.'
## Warning: Expecting numeric in D36702 / R36702C4: got 'n.a.'
## Warning: Expecting numeric in D36703 / R36703C4: got 'n.a.'
## Warning: Expecting numeric in D36704 / R36704C4: got 'n.a.'
## Warning: Expecting numeric in D36705 / R36705C4: got 'n.a.'
## Warning: Expecting numeric in D36706 / R36706C4: got 'n.a.'
## Warning: Expecting numeric in D36707 / R36707C4: got 'n.a.'
## Warning: Expecting numeric in D36708 / R36708C4: got 'n.a.'
## Warning: Expecting numeric in D36709 / R36709C4: got 'n.a.'
## Warning: Expecting numeric in D36710 / R36710C4: got 'n.a.'
## Warning: Expecting numeric in D36711 / R36711C4: got 'n.a.'
## Warning: Expecting numeric in D36712 / R36712C4: got 'n.a.'
## Warning: Expecting numeric in D36713 / R36713C4: got 'n.a.'
## Warning: Expecting numeric in D36714 / R36714C4: got 'n.a.'
## Warning: Expecting numeric in D36715 / R36715C4: got 'n.a.'
## Warning: Expecting numeric in D36716 / R36716C4: got 'n.a.'
## Warning: Expecting numeric in D36717 / R36717C4: got 'n.a.'
## Warning: Expecting numeric in D36718 / R36718C4: got 'n.a.'
## Warning: Expecting numeric in D36719 / R36719C4: got 'n.a.'
## Warning: Expecting numeric in D36720 / R36720C4: got 'n.a.'
## Warning: Expecting numeric in D36721 / R36721C4: got 'n.a.'
## Warning: Expecting numeric in D36722 / R36722C4: got 'n.a.'
## Warning: Expecting numeric in D36723 / R36723C4: got 'n.a.'
## Warning: Expecting numeric in D36724 / R36724C4: got 'n.a.'
## Warning: Expecting numeric in D36725 / R36725C4: got 'n.a.'
## Warning: Expecting numeric in D36726 / R36726C4: got 'n.a.'
## Warning: Expecting numeric in D36727 / R36727C4: got 'n.a.'
## Warning: Expecting numeric in D36728 / R36728C4: got 'n.a.'
## Warning: Expecting numeric in D36729 / R36729C4: got 'n.a.'
## Warning: Expecting numeric in D36730 / R36730C4: got 'n.a.'
## Warning: Expecting numeric in D36731 / R36731C4: got 'n.a.'
## Warning: Expecting numeric in D36732 / R36732C4: got 'n.a.'
## Warning: Expecting numeric in D36733 / R36733C4: got 'n.a.'
## Warning: Expecting numeric in D36734 / R36734C4: got 'n.a.'
## Warning: Expecting numeric in D36735 / R36735C4: got 'n.a.'
## Warning: Expecting numeric in D36736 / R36736C4: got 'n.a.'
## Warning: Expecting numeric in D36737 / R36737C4: got 'n.a.'
## Warning: Expecting numeric in D36738 / R36738C4: got 'n.a.'
## Warning: Expecting numeric in D36739 / R36739C4: got 'n.a.'
## Warning: Expecting numeric in D36740 / R36740C4: got 'n.a.'
## Warning: Expecting numeric in D36741 / R36741C4: got 'n.a.'
## Warning: Expecting numeric in D36742 / R36742C4: got 'n.a.'
## Warning: Expecting numeric in D36743 / R36743C4: got 'n.a.'
## Warning: Expecting numeric in D36744 / R36744C4: got 'n.a.'
## Warning: Expecting numeric in D36745 / R36745C4: got 'n.a.'
## Warning: Expecting numeric in D36746 / R36746C4: got 'n.a.'
## Warning: Expecting numeric in D36747 / R36747C4: got 'n.a.'
## Warning: Expecting numeric in D36748 / R36748C4: got 'n.a.'
## Warning: Expecting numeric in D36749 / R36749C4: got 'n.a.'
## Warning: Expecting numeric in D36750 / R36750C4: got 'n.a.'
## Warning: Expecting numeric in D36751 / R36751C4: got 'n.a.'
## Warning: Expecting numeric in D36752 / R36752C4: got 'n.a.'
## Warning: Expecting numeric in D36753 / R36753C4: got 'n.a.'
## Warning: Expecting numeric in D36754 / R36754C4: got 'n.a.'
## Warning: Expecting numeric in D36755 / R36755C4: got 'n.a.'
## Warning: Expecting numeric in D36756 / R36756C4: got 'n.a.'
## Warning: Expecting numeric in D36757 / R36757C4: got 'n.a.'
## Warning: Expecting numeric in D36758 / R36758C4: got 'n.a.'
## Warning: Expecting numeric in D36759 / R36759C4: got 'n.a.'
## Warning: Expecting numeric in D36760 / R36760C4: got 'n.a.'
## Warning: Expecting numeric in D36761 / R36761C4: got 'n.a.'
## Warning: Expecting numeric in D36762 / R36762C4: got 'n.a.'
## Warning: Expecting numeric in D36763 / R36763C4: got 'n.a.'
## Warning: Expecting numeric in D36764 / R36764C4: got 'n.a.'
## Warning: Expecting numeric in D36765 / R36765C4: got 'n.a.'
## Warning: Expecting numeric in D36766 / R36766C4: got 'n.a.'
## Warning: Expecting numeric in D36767 / R36767C4: got 'n.a.'
## Warning: Expecting numeric in D36768 / R36768C4: got 'n.a.'
## Warning: Expecting numeric in D36769 / R36769C4: got 'n.a.'
## Warning: Expecting numeric in D36770 / R36770C4: got 'n.a.'
## Warning: Expecting numeric in D36771 / R36771C4: got 'n.a.'
## Warning: Expecting numeric in D36772 / R36772C4: got 'n.a.'
## Warning: Expecting numeric in D36773 / R36773C4: got 'n.a.'
## Warning: Expecting numeric in D36774 / R36774C4: got 'n.a.'
## Warning: Expecting numeric in D36775 / R36775C4: got 'n.a.'
## Warning: Expecting numeric in D36776 / R36776C4: got 'n.a.'
## Warning: Expecting numeric in D36777 / R36777C4: got 'n.a.'
## Warning: Expecting numeric in D36778 / R36778C4: got 'n.a.'
## Warning: Expecting numeric in D36779 / R36779C4: got 'n.a.'
## Warning: Expecting numeric in D36780 / R36780C4: got 'n.a.'
## Warning: Expecting numeric in D36781 / R36781C4: got 'n.a.'
## Warning: Expecting numeric in D36782 / R36782C4: got 'n.a.'
## Warning: Expecting numeric in D36783 / R36783C4: got 'n.a.'
## Warning: Expecting numeric in D36784 / R36784C4: got 'n.a.'
## Warning: Expecting numeric in D36785 / R36785C4: got 'n.a.'
## Warning: Expecting numeric in D36786 / R36786C4: got 'n.a.'
## Warning: Expecting numeric in D36787 / R36787C4: got 'n.a.'
## Warning: Expecting numeric in D36788 / R36788C4: got 'n.a.'
## Warning: Expecting numeric in D36789 / R36789C4: got 'n.a.'
## Warning: Expecting numeric in D36790 / R36790C4: got 'n.a.'
## Warning: Expecting numeric in D36791 / R36791C4: got 'n.a.'
## Warning: Expecting numeric in D36792 / R36792C4: got 'n.a.'
## Warning: Expecting numeric in D36793 / R36793C4: got 'n.a.'
## Warning: Expecting numeric in D36794 / R36794C4: got 'n.a.'
## Warning: Expecting numeric in D36795 / R36795C4: got 'n.a.'
## Warning: Expecting numeric in D36796 / R36796C4: got 'n.a.'
## Warning: Expecting numeric in D36797 / R36797C4: got 'n.a.'
## Warning: Expecting numeric in D36798 / R36798C4: got 'n.a.'
## Warning: Expecting numeric in D36799 / R36799C4: got 'n.a.'
## Warning: Expecting numeric in D36800 / R36800C4: got 'n.a.'
## Warning: Expecting numeric in D36801 / R36801C4: got 'n.a.'
## Warning: Expecting numeric in D36802 / R36802C4: got 'n.a.'
## Warning: Expecting numeric in D36803 / R36803C4: got 'n.a.'
## Warning: Expecting numeric in D36804 / R36804C4: got 'n.a.'
## Warning: Expecting numeric in D36805 / R36805C4: got 'n.a.'
## Warning: Expecting numeric in D36806 / R36806C4: got 'n.a.'
## Warning: Expecting numeric in D36807 / R36807C4: got 'n.a.'
## Warning: Expecting numeric in D36808 / R36808C4: got 'n.a.'
## Warning: Expecting numeric in D36809 / R36809C4: got 'n.a.'
## Warning: Expecting numeric in D36810 / R36810C4: got 'n.a.'
## Warning: Expecting numeric in D36811 / R36811C4: got 'n.a.'
## Warning: Expecting numeric in D36812 / R36812C4: got 'n.a.'
## Warning: Expecting numeric in D36813 / R36813C4: got 'n.a.'
## Warning: Expecting numeric in D36814 / R36814C4: got 'n.a.'
## Warning: Expecting numeric in D36815 / R36815C4: got 'n.a.'
## Warning: Expecting numeric in D36816 / R36816C4: got 'n.a.'
## Warning: Expecting numeric in D36817 / R36817C4: got 'n.a.'
## Warning: Expecting numeric in D36818 / R36818C4: got 'n.a.'
## Warning: Expecting numeric in D36819 / R36819C4: got 'n.a.'
## Warning: Expecting numeric in D36820 / R36820C4: got 'n.a.'
## Warning: Expecting numeric in D36821 / R36821C4: got 'n.a.'
## Warning: Expecting numeric in D36822 / R36822C4: got 'n.a.'
## Warning: Expecting numeric in D36823 / R36823C4: got 'n.a.'
## Warning: Expecting numeric in D36824 / R36824C4: got 'n.a.'
## Warning: Expecting numeric in D36825 / R36825C4: got 'n.a.'
## Warning: Expecting numeric in D36826 / R36826C4: got 'n.a.'
## Warning: Expecting numeric in D36827 / R36827C4: got 'n.a.'
## Warning: Expecting numeric in D36828 / R36828C4: got 'n.a.'
## Warning: Expecting numeric in D36829 / R36829C4: got 'n.a.'
## Warning: Expecting numeric in D36830 / R36830C4: got 'n.a.'
## Warning: Expecting numeric in D36831 / R36831C4: got 'n.a.'
## Warning: Expecting numeric in D36832 / R36832C4: got 'n.a.'
## Warning: Expecting numeric in D36833 / R36833C4: got 'n.a.'
## Warning: Expecting numeric in D36834 / R36834C4: got 'n.a.'
## Warning: Expecting numeric in D36835 / R36835C4: got 'n.a.'
## Warning: Expecting numeric in D36836 / R36836C4: got 'n.a.'
## Warning: Expecting numeric in D36837 / R36837C4: got 'n.a.'
## Warning: Expecting numeric in D36838 / R36838C4: got 'n.a.'
## Warning: Expecting numeric in D36839 / R36839C4: got 'n.a.'
## Warning: Expecting numeric in D36840 / R36840C4: got 'n.a.'
## Warning: Expecting numeric in D36841 / R36841C4: got 'n.a.'
## Warning: Expecting numeric in D36842 / R36842C4: got 'n.a.'
## Warning: Expecting numeric in D36843 / R36843C4: got 'n.a.'
## Warning: Expecting numeric in D36844 / R36844C4: got 'n.a.'
## Warning: Expecting numeric in D36845 / R36845C4: got 'n.a.'
## Warning: Expecting numeric in D36846 / R36846C4: got 'n.a.'
## Warning: Expecting numeric in D36847 / R36847C4: got 'n.a.'
## Warning: Expecting numeric in D36848 / R36848C4: got 'n.a.'
## Warning: Expecting numeric in D36849 / R36849C4: got 'n.a.'
## Warning: Expecting numeric in D36850 / R36850C4: got 'n.a.'
## Warning: Expecting numeric in D36851 / R36851C4: got 'n.a.'
## Warning: Expecting numeric in D36852 / R36852C4: got 'n.a.'
## Warning: Expecting numeric in D36853 / R36853C4: got 'n.a.'
## Warning: Expecting numeric in D36854 / R36854C4: got 'n.a.'
## Warning: Expecting numeric in D36855 / R36855C4: got 'n.a.'
## Warning: Expecting numeric in D36856 / R36856C4: got 'n.a.'
## Warning: Expecting numeric in D36857 / R36857C4: got 'n.a.'
## Warning: Expecting numeric in D36858 / R36858C4: got 'n.a.'
## Warning: Expecting numeric in D36859 / R36859C4: got 'n.a.'
## Warning: Expecting numeric in D36860 / R36860C4: got 'n.a.'
## Warning: Expecting numeric in D36861 / R36861C4: got 'n.a.'
## Warning: Expecting numeric in D36862 / R36862C4: got 'n.a.'
## Warning: Expecting numeric in D36863 / R36863C4: got 'n.a.'
## Warning: Expecting numeric in D36864 / R36864C4: got 'n.a.'
## Warning: Expecting numeric in D36865 / R36865C4: got 'n.a.'
## Warning: Expecting numeric in D36866 / R36866C4: got 'n.a.'
## Warning: Expecting numeric in D36867 / R36867C4: got 'n.a.'
## Warning: Expecting numeric in D36868 / R36868C4: got 'n.a.'
## Warning: Expecting numeric in D36869 / R36869C4: got 'n.a.'
## Warning: Expecting numeric in D36870 / R36870C4: got 'n.a.'
## Warning: Expecting numeric in D36871 / R36871C4: got 'n.a.'
## Warning: Expecting numeric in D36872 / R36872C4: got 'n.a.'
## Warning: Expecting numeric in D36873 / R36873C4: got 'n.a.'
## Warning: Expecting numeric in D36874 / R36874C4: got 'n.a.'
## Warning: Expecting numeric in D36875 / R36875C4: got 'n.a.'
## Warning: Expecting numeric in D36876 / R36876C4: got 'n.a.'
## Warning: Expecting numeric in D36877 / R36877C4: got 'n.a.'
## Warning: Expecting numeric in D36878 / R36878C4: got 'n.a.'
## Warning: Expecting numeric in D36879 / R36879C4: got 'n.a.'
## Warning: Expecting numeric in D36880 / R36880C4: got 'n.a.'
## Warning: Expecting numeric in D36881 / R36881C4: got 'n.a.'
## Warning: Expecting numeric in D36882 / R36882C4: got 'n.a.'
## Warning: Expecting numeric in D36883 / R36883C4: got 'n.a.'
## Warning: Expecting numeric in D36884 / R36884C4: got 'n.a.'
## Warning: Expecting numeric in D36885 / R36885C4: got 'n.a.'
## Warning: Expecting numeric in D36886 / R36886C4: got 'n.a.'
## Warning: Expecting numeric in D36887 / R36887C4: got 'n.a.'
## Warning: Expecting numeric in D36888 / R36888C4: got 'n.a.'
## Warning: Expecting numeric in D36889 / R36889C4: got 'n.a.'
## Warning: Expecting numeric in D36890 / R36890C4: got 'n.a.'
## Warning: Expecting numeric in D36891 / R36891C4: got 'n.a.'
## Warning: Expecting numeric in D36892 / R36892C4: got 'n.a.'
## Warning: Expecting numeric in D36893 / R36893C4: got 'n.a.'
## Warning: Expecting numeric in D36894 / R36894C4: got 'n.a.'
## Warning: Expecting numeric in D36895 / R36895C4: got 'n.a.'
## Warning: Expecting numeric in D36896 / R36896C4: got 'n.a.'
## Warning: Expecting numeric in D36897 / R36897C4: got 'n.a.'
## Warning: Expecting numeric in D36898 / R36898C4: got 'n.a.'
## Warning: Expecting numeric in D36899 / R36899C4: got 'n.a.'
## Warning: Expecting numeric in D36900 / R36900C4: got 'n.a.'
## Warning: Expecting numeric in D36901 / R36901C4: got 'n.a.'
## Warning: Expecting numeric in D36902 / R36902C4: got 'n.a.'
## Warning: Expecting numeric in D36903 / R36903C4: got 'n.a.'
## Warning: Expecting numeric in D36904 / R36904C4: got 'n.a.'
## Warning: Expecting numeric in D36905 / R36905C4: got 'n.a.'
## Warning: Expecting numeric in D36906 / R36906C4: got 'n.a.'
## Warning: Expecting numeric in D36907 / R36907C4: got 'n.a.'
## Warning: Expecting numeric in D36908 / R36908C4: got 'n.a.'
## Warning: Expecting numeric in D36909 / R36909C4: got 'n.a.'
## Warning: Expecting numeric in D36910 / R36910C4: got 'n.a.'
## Warning: Expecting numeric in D36911 / R36911C4: got 'n.a.'
## Warning: Expecting numeric in D36912 / R36912C4: got 'n.a.'
## Warning: Expecting numeric in D36913 / R36913C4: got 'n.a.'
## Warning: Expecting numeric in D36914 / R36914C4: got 'n.a.'
## Warning: Expecting numeric in D36915 / R36915C4: got 'n.a.'
## Warning: Expecting numeric in D36916 / R36916C4: got 'n.a.'
## Warning: Expecting numeric in D36917 / R36917C4: got 'n.a.'
## Warning: Expecting numeric in D36918 / R36918C4: got 'n.a.'
## Warning: Expecting numeric in D36919 / R36919C4: got 'n.a.'
## Warning: Expecting numeric in D36920 / R36920C4: got 'n.a.'
## Warning: Expecting numeric in D36921 / R36921C4: got 'n.a.'
## Warning: Expecting numeric in D36922 / R36922C4: got 'n.a.'
## Warning: Expecting numeric in D36923 / R36923C4: got 'n.a.'
## Warning: Expecting numeric in D36924 / R36924C4: got 'n.a.'
## Warning: Expecting numeric in D36925 / R36925C4: got 'n.a.'
## Warning: Expecting numeric in D36926 / R36926C4: got 'n.a.'
## Warning: Expecting numeric in D36927 / R36927C4: got 'n.a.'
## Warning: Expecting numeric in D36928 / R36928C4: got 'n.a.'
## Warning: Expecting numeric in D36929 / R36929C4: got 'n.a.'
## Warning: Expecting numeric in D36930 / R36930C4: got 'n.a.'
## Warning: Expecting numeric in D36931 / R36931C4: got 'n.a.'
## Warning: Expecting numeric in D36932 / R36932C4: got 'n.a.'
## Warning: Expecting numeric in D36933 / R36933C4: got 'n.a.'
## Warning: Expecting numeric in D36934 / R36934C4: got 'n.a.'
## Warning: Expecting numeric in D36935 / R36935C4: got 'n.a.'
## Warning: Expecting numeric in D36936 / R36936C4: got 'n.a.'
## Warning: Expecting numeric in D36937 / R36937C4: got 'n.a.'
## Warning: Expecting numeric in D36938 / R36938C4: got 'n.a.'
## Warning: Expecting numeric in D36939 / R36939C4: got 'n.a.'
## Warning: Expecting numeric in D36940 / R36940C4: got 'n.a.'
## Warning: Expecting numeric in D36941 / R36941C4: got 'n.a.'
## Warning: Expecting numeric in D36942 / R36942C4: got 'n.a.'
## Warning: Expecting numeric in D36943 / R36943C4: got 'n.a.'
## Warning: Expecting numeric in D36944 / R36944C4: got 'n.a.'
## Warning: Expecting numeric in D36945 / R36945C4: got 'n.a.'
## Warning: Expecting numeric in D36946 / R36946C4: got 'n.a.'
## Warning: Expecting numeric in D36947 / R36947C4: got 'n.a.'
## Warning: Expecting numeric in D36948 / R36948C4: got 'n.a.'
## Warning: Expecting numeric in D36949 / R36949C4: got 'n.a.'
## Warning: Expecting numeric in D36950 / R36950C4: got 'n.a.'
## Warning: Expecting numeric in D36951 / R36951C4: got 'n.a.'
## Warning: Expecting numeric in D36952 / R36952C4: got 'n.a.'
## Warning: Expecting numeric in D36953 / R36953C4: got 'n.a.'
## Warning: Expecting numeric in D36954 / R36954C4: got 'n.a.'
## Warning: Expecting numeric in D36955 / R36955C4: got 'n.a.'
## Warning: Expecting numeric in D36956 / R36956C4: got 'n.a.'
## Warning: Expecting numeric in D36957 / R36957C4: got 'n.a.'
## Warning: Expecting numeric in D36958 / R36958C4: got 'n.a.'
## Warning: Expecting numeric in D36959 / R36959C4: got 'n.a.'
## Warning: Expecting numeric in D36960 / R36960C4: got 'n.a.'
## Warning: Expecting numeric in D36961 / R36961C4: got 'n.a.'
## Warning: Expecting numeric in D36962 / R36962C4: got 'n.a.'
## Warning: Expecting numeric in D36963 / R36963C4: got 'n.a.'
## Warning: Expecting numeric in D36964 / R36964C4: got 'n.a.'
## Warning: Expecting numeric in D36965 / R36965C4: got 'n.a.'
## Warning: Expecting numeric in D36966 / R36966C4: got 'n.a.'
## Warning: Expecting numeric in D36967 / R36967C4: got 'n.a.'
## Warning: Expecting numeric in D36968 / R36968C4: got 'n.a.'
## Warning: Expecting numeric in D36969 / R36969C4: got 'n.a.'
## Warning: Expecting numeric in D36970 / R36970C4: got 'n.a.'
## Warning: Expecting numeric in D36971 / R36971C4: got 'n.a.'
## Warning: Expecting numeric in D36972 / R36972C4: got 'n.a.'
## Warning: Expecting numeric in D36973 / R36973C4: got 'n.a.'
## Warning: Expecting numeric in D36974 / R36974C4: got 'n.a.'
## Warning: Expecting numeric in D36975 / R36975C4: got 'n.a.'
## Warning: Expecting numeric in D36976 / R36976C4: got 'n.a.'
## Warning: Expecting numeric in D36977 / R36977C4: got 'n.a.'
## Warning: Expecting numeric in D36978 / R36978C4: got 'n.a.'
## Warning: Expecting numeric in D36979 / R36979C4: got 'n.a.'
## Warning: Expecting numeric in D36980 / R36980C4: got 'n.a.'
## Warning: Expecting numeric in D36981 / R36981C4: got 'n.a.'
## Warning: Expecting numeric in D36982 / R36982C4: got 'n.a.'
## Warning: Expecting numeric in D36983 / R36983C4: got 'n.a.'
## Warning: Expecting numeric in D36984 / R36984C4: got 'n.a.'
## Warning: Expecting numeric in D36985 / R36985C4: got 'n.a.'
## Warning: Expecting numeric in D36986 / R36986C4: got 'n.a.'
## Warning: Expecting numeric in D36987 / R36987C4: got 'n.a.'
## Warning: Expecting numeric in D36988 / R36988C4: got 'n.a.'
## Warning: Expecting numeric in D36989 / R36989C4: got 'n.a.'
## Warning: Expecting numeric in D36990 / R36990C4: got 'n.a.'
## Warning: Expecting numeric in D36991 / R36991C4: got 'n.a.'
## Warning: Expecting numeric in D36992 / R36992C4: got 'n.a.'
## Warning: Expecting numeric in D36993 / R36993C4: got 'n.a.'
## Warning: Expecting numeric in D36994 / R36994C4: got 'n.a.'
## Warning: Expecting numeric in D36995 / R36995C4: got 'n.a.'
## Warning: Expecting numeric in D36996 / R36996C4: got 'n.a.'
## Warning: Expecting numeric in D36997 / R36997C4: got 'n.a.'
## Warning: Expecting numeric in D36998 / R36998C4: got 'n.a.'
## Warning: Expecting numeric in D36999 / R36999C4: got 'n.a.'
## Warning: Expecting numeric in D37000 / R37000C4: got 'n.a.'
## Warning: Expecting numeric in D37001 / R37001C4: got 'n.a.'
## Warning: Expecting numeric in D37002 / R37002C4: got 'n.a.'
## Warning: Expecting numeric in D37003 / R37003C4: got 'n.a.'
## Warning: Expecting numeric in D37004 / R37004C4: got 'n.a.'
## Warning: Expecting numeric in D37005 / R37005C4: got 'n.a.'
## Warning: Expecting numeric in D37006 / R37006C4: got 'n.a.'
## Warning: Expecting numeric in D37007 / R37007C4: got 'n.a.'
## Warning: Expecting numeric in D37008 / R37008C4: got 'n.a.'
## Warning: Expecting numeric in D37009 / R37009C4: got 'n.a.'
## Warning: Expecting numeric in D37010 / R37010C4: got 'n.a.'
## Warning: Expecting numeric in D37011 / R37011C4: got 'n.a.'
## Warning: Expecting numeric in D37012 / R37012C4: got 'n.a.'
## Warning: Expecting numeric in D37013 / R37013C4: got 'n.a.'
## Warning: Expecting numeric in D37014 / R37014C4: got 'n.a.'
## Warning: Expecting numeric in D37015 / R37015C4: got 'n.a.'
## Warning: Expecting numeric in D37016 / R37016C4: got 'n.a.'
## Warning: Expecting numeric in D37017 / R37017C4: got 'n.a.'
## Warning: Expecting numeric in D37018 / R37018C4: got 'n.a.'
## Warning: Expecting numeric in D37019 / R37019C4: got 'n.a.'
## Warning: Expecting numeric in D37020 / R37020C4: got 'n.a.'
## Warning: Expecting numeric in D37021 / R37021C4: got 'n.a.'
## Warning: Expecting numeric in D37022 / R37022C4: got 'n.a.'
## Warning: Expecting numeric in D37023 / R37023C4: got 'n.a.'
## Warning: Expecting numeric in D37024 / R37024C4: got 'n.a.'
## Warning: Expecting numeric in D37025 / R37025C4: got 'n.a.'
## Warning: Expecting numeric in D37026 / R37026C4: got 'n.a.'
## Warning: Expecting numeric in D37027 / R37027C4: got 'n.a.'
## Warning: Expecting numeric in D37028 / R37028C4: got 'n.a.'
## Warning: Expecting numeric in D37029 / R37029C4: got 'n.a.'
## Warning: Expecting numeric in D37030 / R37030C4: got 'n.a.'
## Warning: Expecting numeric in D37031 / R37031C4: got 'n.a.'
## Warning: Expecting numeric in D37032 / R37032C4: got 'n.a.'
## Warning: Expecting numeric in D37033 / R37033C4: got 'n.a.'
## Warning: Expecting numeric in D37034 / R37034C4: got 'n.a.'
## Warning: Expecting numeric in D37035 / R37035C4: got 'n.a.'
## Warning: Expecting numeric in D37036 / R37036C4: got 'n.a.'
## Warning: Expecting numeric in D37037 / R37037C4: got 'n.a.'
## Warning: Expecting numeric in D37038 / R37038C4: got 'n.a.'
## Warning: Expecting numeric in D37039 / R37039C4: got 'n.a.'
## Warning: Expecting numeric in D37040 / R37040C4: got 'n.a.'
## Warning: Expecting numeric in D37041 / R37041C4: got 'n.a.'
## Warning: Expecting numeric in D37042 / R37042C4: got 'n.a.'
## Warning: Expecting numeric in D37043 / R37043C4: got 'n.a.'
## Warning: Expecting numeric in D37044 / R37044C4: got 'n.a.'
## Warning: Expecting numeric in D37045 / R37045C4: got 'n.a.'
## Warning: Expecting numeric in D37046 / R37046C4: got 'n.a.'
## Warning: Expecting numeric in D37047 / R37047C4: got 'n.a.'
## Warning: Expecting numeric in D37048 / R37048C4: got 'n.a.'
## Warning: Expecting numeric in D37049 / R37049C4: got 'n.a.'
## Warning: Expecting numeric in D37050 / R37050C4: got 'n.a.'
## Warning: Expecting numeric in D37051 / R37051C4: got 'n.a.'
## Warning: Expecting numeric in D37052 / R37052C4: got 'n.a.'
## Warning: Expecting numeric in D37053 / R37053C4: got 'n.a.'
## Warning: Expecting numeric in D37054 / R37054C4: got 'n.a.'
## Warning: Expecting numeric in D37055 / R37055C4: got 'n.a.'
## Warning: Expecting numeric in D37056 / R37056C4: got 'n.a.'
## Warning: Expecting numeric in D37057 / R37057C4: got 'n.a.'
## Warning: Expecting numeric in D37058 / R37058C4: got 'n.a.'
## Warning: Expecting numeric in D37059 / R37059C4: got 'n.a.'
## Warning: Expecting numeric in D37060 / R37060C4: got 'n.a.'
## Warning: Expecting numeric in D37061 / R37061C4: got 'n.a.'
## Warning: Expecting numeric in D37062 / R37062C4: got 'n.a.'
## Warning: Expecting numeric in D37063 / R37063C4: got 'n.a.'
## Warning: Expecting numeric in D37064 / R37064C4: got 'n.a.'
## Warning: Expecting numeric in D37065 / R37065C4: got 'n.a.'
## Warning: Expecting numeric in D37066 / R37066C4: got 'n.a.'
## Warning: Expecting numeric in D37067 / R37067C4: got 'n.a.'
## Warning: Expecting numeric in D37068 / R37068C4: got 'n.a.'
## Warning: Expecting numeric in D37069 / R37069C4: got 'n.a.'
## Warning: Expecting numeric in D37070 / R37070C4: got 'n.a.'
## Warning: Expecting numeric in D37071 / R37071C4: got 'n.a.'
## Warning: Expecting numeric in D37072 / R37072C4: got 'n.a.'
## Warning: Expecting numeric in D37073 / R37073C4: got 'n.a.'
## Warning: Expecting numeric in D37074 / R37074C4: got 'n.a.'
## Warning: Expecting numeric in D37075 / R37075C4: got 'n.a.'
## Warning: Expecting numeric in D37076 / R37076C4: got 'n.a.'
## Warning: Expecting numeric in D37077 / R37077C4: got 'n.a.'
## Warning: Expecting numeric in D37078 / R37078C4: got 'n.a.'
## Warning: Expecting numeric in D37079 / R37079C4: got 'n.a.'
## Warning: Expecting numeric in D37080 / R37080C4: got 'n.a.'
## Warning: Expecting numeric in D37081 / R37081C4: got 'n.a.'
## Warning: Expecting numeric in D37082 / R37082C4: got 'n.a.'
## Warning: Expecting numeric in D37083 / R37083C4: got 'n.a.'
## Warning: Expecting numeric in D37084 / R37084C4: got 'n.a.'
## Warning: Expecting numeric in D37085 / R37085C4: got 'n.a.'
## Warning: Expecting numeric in D37086 / R37086C4: got 'n.a.'
## Warning: Expecting numeric in D37087 / R37087C4: got 'n.a.'
## Warning: Expecting numeric in D37088 / R37088C4: got 'n.a.'
## Warning: Expecting numeric in D37089 / R37089C4: got 'n.a.'
## Warning: Expecting numeric in D37090 / R37090C4: got 'n.a.'
## Warning: Expecting numeric in D37091 / R37091C4: got 'n.a.'
## Warning: Expecting numeric in D37092 / R37092C4: got 'n.a.'
## Warning: Expecting numeric in D37093 / R37093C4: got 'n.a.'
## Warning: Expecting numeric in D37094 / R37094C4: got 'n.a.'
## Warning: Expecting numeric in D37095 / R37095C4: got 'n.a.'
## Warning: Expecting numeric in D37096 / R37096C4: got 'n.a.'
## Warning: Expecting numeric in D37097 / R37097C4: got 'n.a.'
## Warning: Expecting numeric in D37098 / R37098C4: got 'n.a.'
## Warning: Expecting numeric in D37099 / R37099C4: got 'n.a.'
## Warning: Expecting numeric in D37100 / R37100C4: got 'n.a.'
## Warning: Expecting numeric in D37101 / R37101C4: got 'n.a.'
## Warning: Expecting numeric in D37102 / R37102C4: got 'n.a.'
## Warning: Expecting numeric in D37103 / R37103C4: got 'n.a.'
## Warning: Expecting numeric in D37104 / R37104C4: got 'n.a.'
## Warning: Expecting numeric in D37105 / R37105C4: got 'n.a.'
## Warning: Expecting numeric in D37106 / R37106C4: got 'n.a.'
## Warning: Expecting numeric in D37107 / R37107C4: got 'n.a.'
## Warning: Expecting numeric in D37108 / R37108C4: got 'n.a.'
## Warning: Expecting numeric in D37109 / R37109C4: got 'n.a.'
## Warning: Expecting numeric in D37110 / R37110C4: got 'n.a.'
## Warning: Expecting numeric in D37111 / R37111C4: got 'n.a.'
## Warning: Expecting numeric in D37112 / R37112C4: got 'n.a.'
## Warning: Expecting numeric in D37113 / R37113C4: got 'n.a.'
## Warning: Expecting numeric in D37114 / R37114C4: got 'n.a.'
## Warning: Expecting numeric in D37115 / R37115C4: got 'n.a.'
## Warning: Expecting numeric in D37116 / R37116C4: got 'n.a.'
## Warning: Expecting numeric in D37117 / R37117C4: got 'n.a.'
## Warning: Expecting numeric in D37118 / R37118C4: got 'n.a.'
## Warning: Expecting numeric in D37119 / R37119C4: got 'n.a.'
## Warning: Expecting numeric in D37120 / R37120C4: got 'n.a.'
## Warning: Expecting numeric in D37121 / R37121C4: got 'n.a.'
## Warning: Expecting numeric in D37122 / R37122C4: got 'n.a.'
## Warning: Expecting numeric in D37123 / R37123C4: got 'n.a.'
## Warning: Expecting numeric in D37124 / R37124C4: got 'n.a.'
## Warning: Expecting numeric in D37125 / R37125C4: got 'n.a.'
## Warning: Expecting numeric in D37126 / R37126C4: got 'n.a.'
## Warning: Expecting numeric in D37127 / R37127C4: got 'n.a.'
## Warning: Expecting numeric in D37128 / R37128C4: got 'n.a.'
## Warning: Expecting numeric in D37129 / R37129C4: got 'n.a.'
## Warning: Expecting numeric in D37130 / R37130C4: got 'n.a.'
## Warning: Expecting numeric in D37131 / R37131C4: got 'n.a.'
## Warning: Expecting numeric in D37132 / R37132C4: got 'n.a.'
## Warning: Expecting numeric in D37133 / R37133C4: got 'n.a.'
## Warning: Expecting numeric in D37134 / R37134C4: got 'n.a.'
## Warning: Expecting numeric in D37135 / R37135C4: got 'n.a.'
## Warning: Expecting numeric in D37136 / R37136C4: got 'n.a.'
## Warning: Expecting numeric in D37137 / R37137C4: got 'n.a.'
## Warning: Expecting numeric in D37138 / R37138C4: got 'n.a.'
## Warning: Expecting numeric in D37139 / R37139C4: got 'n.a.'
## Warning: Expecting numeric in D37140 / R37140C4: got 'n.a.'
## Warning: Expecting numeric in D37141 / R37141C4: got 'n.a.'
## Warning: Expecting numeric in D37142 / R37142C4: got 'n.a.'
## Warning: Expecting numeric in D37143 / R37143C4: got 'n.a.'
## Warning: Expecting numeric in D37144 / R37144C4: got 'n.a.'
## Warning: Expecting numeric in D37145 / R37145C4: got 'n.a.'
## Warning: Expecting numeric in D37146 / R37146C4: got 'n.a.'
## Warning: Expecting numeric in D37147 / R37147C4: got 'n.a.'
## Warning: Expecting numeric in D37148 / R37148C4: got 'n.a.'
## Warning: Expecting numeric in D37149 / R37149C4: got 'n.a.'
## Warning: Expecting numeric in D37150 / R37150C4: got 'n.a.'
## Warning: Expecting numeric in D37151 / R37151C4: got 'n.a.'
## Warning: Expecting numeric in D37152 / R37152C4: got 'n.a.'
## Warning: Expecting numeric in D37153 / R37153C4: got 'n.a.'
## Warning: Expecting numeric in D37154 / R37154C4: got 'n.a.'
## Warning: Expecting numeric in D37155 / R37155C4: got 'n.a.'
## Warning: Expecting numeric in D37156 / R37156C4: got 'n.a.'
## Warning: Expecting numeric in D37157 / R37157C4: got 'n.a.'
## Warning: Expecting numeric in D37158 / R37158C4: got 'n.a.'
## Warning: Expecting numeric in D37159 / R37159C4: got 'n.a.'
## Warning: Expecting numeric in D37160 / R37160C4: got 'n.a.'
## Warning: Expecting numeric in D37161 / R37161C4: got 'n.a.'
## Warning: Expecting numeric in D37162 / R37162C4: got 'n.a.'
## Warning: Expecting numeric in D37163 / R37163C4: got 'n.a.'
## Warning: Expecting numeric in D37164 / R37164C4: got 'n.a.'
## Warning: Expecting numeric in D37165 / R37165C4: got 'n.a.'
## Warning: Expecting numeric in D37166 / R37166C4: got 'n.a.'
## Warning: Expecting numeric in D37167 / R37167C4: got 'n.a.'
## Warning: Expecting numeric in D37168 / R37168C4: got 'n.a.'
## Warning: Expecting numeric in D37169 / R37169C4: got 'n.a.'
## Warning: Expecting numeric in D37170 / R37170C4: got 'n.a.'
## Warning: Expecting numeric in D37171 / R37171C4: got 'n.a.'
## Warning: Expecting numeric in D37172 / R37172C4: got 'n.a.'
## Warning: Expecting numeric in D37173 / R37173C4: got 'n.a.'
## Warning: Expecting numeric in D37174 / R37174C4: got 'n.a.'
## Warning: Expecting numeric in D37175 / R37175C4: got 'n.a.'
## Warning: Expecting numeric in D37176 / R37176C4: got 'n.a.'
## Warning: Expecting numeric in D37177 / R37177C4: got 'n.a.'
## Warning: Expecting numeric in D37178 / R37178C4: got 'n.a.'
## Warning: Expecting numeric in D37179 / R37179C4: got 'n.a.'
## Warning: Expecting numeric in D37180 / R37180C4: got 'n.a.'
## Warning: Expecting numeric in D37181 / R37181C4: got 'n.a.'
## Warning: Expecting numeric in D37182 / R37182C4: got 'n.a.'
## Warning: Expecting numeric in D37183 / R37183C4: got 'n.a.'
## Warning: Expecting numeric in D37184 / R37184C4: got 'n.a.'
## Warning: Expecting numeric in D37185 / R37185C4: got 'n.a.'
## Warning: Expecting numeric in D37186 / R37186C4: got 'n.a.'
## Warning: Expecting numeric in D37187 / R37187C4: got 'n.a.'
## Warning: Expecting numeric in D37188 / R37188C4: got 'n.a.'
## Warning: Expecting numeric in D37189 / R37189C4: got 'n.a.'
## Warning: Expecting numeric in D37190 / R37190C4: got 'n.a.'
## Warning: Expecting numeric in D37191 / R37191C4: got 'n.a.'
## Warning: Expecting numeric in D37192 / R37192C4: got 'n.a.'
## Warning: Expecting numeric in D37193 / R37193C4: got 'n.a.'
## Warning: Expecting numeric in D37194 / R37194C4: got 'n.a.'
## Warning: Expecting numeric in D37195 / R37195C4: got 'n.a.'
## Warning: Expecting numeric in D37196 / R37196C4: got 'n.a.'
## Warning: Expecting numeric in D37197 / R37197C4: got 'n.a.'
## Warning: Expecting numeric in D37198 / R37198C4: got 'n.a.'
## Warning: Expecting numeric in D37199 / R37199C4: got 'n.a.'
## Warning: Expecting numeric in D37200 / R37200C4: got 'n.a.'
## Warning: Expecting numeric in D37201 / R37201C4: got 'n.a.'
## Warning: Expecting numeric in D37202 / R37202C4: got 'n.a.'
## Warning: Expecting numeric in D37203 / R37203C4: got 'n.a.'
## Warning: Expecting numeric in D37204 / R37204C4: got 'n.a.'
## Warning: Expecting numeric in D37205 / R37205C4: got 'n.a.'
## Warning: Expecting numeric in D37206 / R37206C4: got 'n.a.'
## Warning: Expecting numeric in D37207 / R37207C4: got 'n.a.'
## Warning: Expecting numeric in D37208 / R37208C4: got 'n.a.'
## Warning: Expecting numeric in D37209 / R37209C4: got 'n.a.'
## Warning: Expecting numeric in D37210 / R37210C4: got 'n.a.'
## Warning: Expecting numeric in D37211 / R37211C4: got 'n.a.'
## Warning: Expecting numeric in D37212 / R37212C4: got 'n.a.'
## Warning: Expecting numeric in D37213 / R37213C4: got 'n.a.'
## Warning: Expecting numeric in D37214 / R37214C4: got 'n.a.'
## Warning: Expecting numeric in D37215 / R37215C4: got 'n.a.'
## Warning: Expecting numeric in D37216 / R37216C4: got 'n.a.'
## Warning: Expecting numeric in D37217 / R37217C4: got 'n.a.'
## Warning: Expecting numeric in D37218 / R37218C4: got 'n.a.'
## Warning: Expecting numeric in D37219 / R37219C4: got 'n.a.'
## Warning: Expecting numeric in D37220 / R37220C4: got 'n.a.'
## Warning: Expecting numeric in D37221 / R37221C4: got 'n.a.'
## Warning: Expecting numeric in D37222 / R37222C4: got 'n.a.'
## Warning: Expecting numeric in D37223 / R37223C4: got 'n.a.'
## Warning: Expecting numeric in D37224 / R37224C4: got 'n.a.'
## Warning: Expecting numeric in D37225 / R37225C4: got 'n.a.'
## Warning: Expecting numeric in D37226 / R37226C4: got 'n.a.'
## Warning: Expecting numeric in D37227 / R37227C4: got 'n.a.'
## Warning: Expecting numeric in D37228 / R37228C4: got 'n.a.'
## Warning: Expecting numeric in D37229 / R37229C4: got 'n.a.'
## Warning: Expecting numeric in D37230 / R37230C4: got 'n.a.'
## Warning: Expecting numeric in D37231 / R37231C4: got 'n.a.'
## Warning: Expecting numeric in D37232 / R37232C4: got 'n.a.'
## Warning: Expecting numeric in D37233 / R37233C4: got 'n.a.'
## Warning: Expecting numeric in D37234 / R37234C4: got 'n.a.'
## Warning: Expecting numeric in D37235 / R37235C4: got 'n.a.'
## Warning: Expecting numeric in D37236 / R37236C4: got 'n.a.'
## Warning: Expecting numeric in D37237 / R37237C4: got 'n.a.'
## Warning: Expecting numeric in D37238 / R37238C4: got 'n.a.'
## Warning: Expecting numeric in D37239 / R37239C4: got 'n.a.'
## Warning: Expecting numeric in D37240 / R37240C4: got 'n.a.'
## Warning: Expecting numeric in D37241 / R37241C4: got 'n.a.'
## Warning: Expecting numeric in D37242 / R37242C4: got 'n.a.'
## Warning: Expecting numeric in D37243 / R37243C4: got 'n.a.'
## Warning: Expecting numeric in D37244 / R37244C4: got 'n.a.'
## Warning: Expecting numeric in D37245 / R37245C4: got 'n.a.'
## Warning: Expecting numeric in D37246 / R37246C4: got 'n.a.'
## Warning: Expecting numeric in D37247 / R37247C4: got 'n.a.'
## Warning: Expecting numeric in D37248 / R37248C4: got 'n.a.'
## Warning: Expecting numeric in D37249 / R37249C4: got 'n.a.'
## Warning: Expecting numeric in D37250 / R37250C4: got 'n.a.'
## Warning: Expecting numeric in D37251 / R37251C4: got 'n.a.'
## Warning: Expecting numeric in D37252 / R37252C4: got 'n.a.'
## Warning: Expecting numeric in D37253 / R37253C4: got 'n.a.'
## Warning: Expecting numeric in D37254 / R37254C4: got 'n.a.'
## Warning: Expecting numeric in D37255 / R37255C4: got 'n.a.'
## Warning: Expecting numeric in D37256 / R37256C4: got 'n.a.'
## Warning: Expecting numeric in D37257 / R37257C4: got 'n.a.'
## Warning: Expecting numeric in D37258 / R37258C4: got 'n.a.'
## Warning: Expecting numeric in D37259 / R37259C4: got 'n.a.'
## Warning: Expecting numeric in D37260 / R37260C4: got 'n.a.'
## Warning: Expecting numeric in D37261 / R37261C4: got 'n.a.'
## Warning: Expecting numeric in D37262 / R37262C4: got 'n.a.'
## Warning: Expecting numeric in D37263 / R37263C4: got 'n.a.'
## Warning: Expecting numeric in D37264 / R37264C4: got 'n.a.'
## Warning: Expecting numeric in D37265 / R37265C4: got 'n.a.'
## Warning: Expecting numeric in D37266 / R37266C4: got 'n.a.'
## Warning: Expecting numeric in D37267 / R37267C4: got 'n.a.'
## Warning: Expecting numeric in D37268 / R37268C4: got 'n.a.'
## Warning: Expecting numeric in D37269 / R37269C4: got 'n.a.'
## Warning: Expecting numeric in D37270 / R37270C4: got 'n.a.'
## Warning: Expecting numeric in D37271 / R37271C4: got 'n.a.'
## Warning: Expecting numeric in D37272 / R37272C4: got 'n.a.'
## Warning: Expecting numeric in D37273 / R37273C4: got 'n.a.'
## Warning: Expecting numeric in D37274 / R37274C4: got 'n.a.'
## Warning: Expecting numeric in D37275 / R37275C4: got 'n.a.'
## Warning: Expecting numeric in D37276 / R37276C4: got 'n.a.'
## Warning: Expecting numeric in D37277 / R37277C4: got 'n.a.'
## Warning: Expecting numeric in D37278 / R37278C4: got 'n.a.'
## Warning: Expecting numeric in D37279 / R37279C4: got 'n.a.'
## Warning: Expecting numeric in D37280 / R37280C4: got 'n.a.'
## Warning: Expecting numeric in D37281 / R37281C4: got 'n.a.'
## Warning: Expecting numeric in D37282 / R37282C4: got 'n.a.'
## Warning: Expecting numeric in D37283 / R37283C4: got 'n.a.'
## Warning: Expecting numeric in D37284 / R37284C4: got 'n.a.'
## Warning: Expecting numeric in D37285 / R37285C4: got 'n.a.'
## Warning: Expecting numeric in D37286 / R37286C4: got 'n.a.'
## Warning: Expecting numeric in D37287 / R37287C4: got 'n.a.'
## Warning: Expecting numeric in D37288 / R37288C4: got 'n.a.'
## Warning: Expecting numeric in D37289 / R37289C4: got 'n.a.'
## Warning: Expecting numeric in D37290 / R37290C4: got 'n.a.'
## Warning: Expecting numeric in D37291 / R37291C4: got 'n.a.'
## Warning: Expecting numeric in D37292 / R37292C4: got 'n.a.'
## Warning: Expecting numeric in D37293 / R37293C4: got 'n.a.'
## Warning: Expecting numeric in D37294 / R37294C4: got 'n.a.'
## Warning: Expecting numeric in D37295 / R37295C4: got 'n.a.'
## Warning: Expecting numeric in D37296 / R37296C4: got 'n.a.'
## Warning: Expecting numeric in D37297 / R37297C4: got 'n.a.'
## Warning: Expecting numeric in D37298 / R37298C4: got 'n.a.'
## Warning: Expecting numeric in D37299 / R37299C4: got 'n.a.'
## Warning: Expecting numeric in D37300 / R37300C4: got 'n.a.'
## Warning: Expecting numeric in D37301 / R37301C4: got 'n.a.'
## Warning: Expecting numeric in D37302 / R37302C4: got 'n.a.'
## Warning: Expecting numeric in D37303 / R37303C4: got 'n.a.'
## Warning: Expecting numeric in D37304 / R37304C4: got 'n.a.'
## Warning: Expecting numeric in D37305 / R37305C4: got 'n.a.'
## Warning: Expecting numeric in D37306 / R37306C4: got 'n.a.'
## Warning: Expecting numeric in D37307 / R37307C4: got 'n.a.'
## Warning: Expecting numeric in D37308 / R37308C4: got 'n.a.'
## Warning: Expecting numeric in D37309 / R37309C4: got 'n.a.'
## Warning: Expecting numeric in D37310 / R37310C4: got 'n.a.'
## Warning: Expecting numeric in D37311 / R37311C4: got 'n.a.'
## Warning: Expecting numeric in D37312 / R37312C4: got 'n.a.'
## Warning: Expecting numeric in D37313 / R37313C4: got 'n.a.'
## Warning: Expecting numeric in D37314 / R37314C4: got 'n.a.'
## Warning: Expecting numeric in D37315 / R37315C4: got 'n.a.'
## Warning: Expecting numeric in D37316 / R37316C4: got 'n.a.'
## Warning: Expecting numeric in D37317 / R37317C4: got 'n.a.'
## Warning: Expecting numeric in D37318 / R37318C4: got 'n.a.'
## Warning: Expecting numeric in D37319 / R37319C4: got 'n.a.'
## Warning: Expecting numeric in D37320 / R37320C4: got 'n.a.'
## Warning: Expecting numeric in D37321 / R37321C4: got 'n.a.'
## Warning: Expecting numeric in D37322 / R37322C4: got 'n.a.'
## Warning: Expecting numeric in D37323 / R37323C4: got 'n.a.'
## Warning: Expecting numeric in D37324 / R37324C4: got 'n.a.'
## Warning: Expecting numeric in D37325 / R37325C4: got 'n.a.'
## Warning: Expecting numeric in D37326 / R37326C4: got 'n.a.'
## Warning: Expecting numeric in D37327 / R37327C4: got 'n.a.'
## Warning: Expecting numeric in D37328 / R37328C4: got 'n.a.'
## Warning: Expecting numeric in D37329 / R37329C4: got 'n.a.'
## Warning: Expecting numeric in D37330 / R37330C4: got 'n.a.'
## Warning: Expecting numeric in D37331 / R37331C4: got 'n.a.'
## Warning: Expecting numeric in D37332 / R37332C4: got 'n.a.'
## Warning: Expecting numeric in D37333 / R37333C4: got 'n.a.'
## Warning: Expecting numeric in D37334 / R37334C4: got 'n.a.'
## Warning: Expecting numeric in D37335 / R37335C4: got 'n.a.'
## Warning: Expecting numeric in D37336 / R37336C4: got 'n.a.'
## Warning: Expecting numeric in D37337 / R37337C4: got 'n.a.'
## Warning: Expecting numeric in D37338 / R37338C4: got 'n.a.'
## Warning: Expecting numeric in D37339 / R37339C4: got 'n.a.'
## Warning: Expecting numeric in D37340 / R37340C4: got 'n.a.'
## Warning: Expecting numeric in D37341 / R37341C4: got 'n.a.'
## Warning: Expecting numeric in D37342 / R37342C4: got 'n.a.'
## Warning: Expecting numeric in D37343 / R37343C4: got 'n.a.'
## Warning: Expecting numeric in D37344 / R37344C4: got 'n.a.'
## Warning: Expecting numeric in D37345 / R37345C4: got 'n.a.'
## Warning: Expecting numeric in D37346 / R37346C4: got 'n.a.'
## Warning: Expecting numeric in D37347 / R37347C4: got 'n.a.'
## Warning: Expecting numeric in D37348 / R37348C4: got 'n.a.'
## Warning: Expecting numeric in D37349 / R37349C4: got 'n.a.'
## Warning: Expecting numeric in D37350 / R37350C4: got 'n.a.'
## Warning: Expecting numeric in D37351 / R37351C4: got 'n.a.'
## Warning: Expecting numeric in D37352 / R37352C4: got 'n.a.'
## Warning: Expecting numeric in D37353 / R37353C4: got 'n.a.'
## Warning: Expecting numeric in D37354 / R37354C4: got 'n.a.'
## Warning: Expecting numeric in D37355 / R37355C4: got 'n.a.'
## Warning: Expecting numeric in D37356 / R37356C4: got 'n.a.'
## Warning: Expecting numeric in D37357 / R37357C4: got 'n.a.'
## Warning: Expecting numeric in D37358 / R37358C4: got 'n.a.'
## Warning: Expecting numeric in D37359 / R37359C4: got 'n.a.'
## Warning: Expecting numeric in D37360 / R37360C4: got 'n.a.'
## Warning: Expecting numeric in D37361 / R37361C4: got 'n.a.'
## Warning: Expecting numeric in D37362 / R37362C4: got 'n.a.'
## Warning: Expecting numeric in D37363 / R37363C4: got 'n.a.'
## Warning: Expecting numeric in D37364 / R37364C4: got 'n.a.'
## Warning: Expecting numeric in D37365 / R37365C4: got 'n.a.'
## Warning: Expecting numeric in D37366 / R37366C4: got 'n.a.'
## Warning: Expecting numeric in D37367 / R37367C4: got 'n.a.'
## Warning: Expecting numeric in D37368 / R37368C4: got 'n.a.'
## Warning: Expecting numeric in D37369 / R37369C4: got 'n.a.'
## Warning: Expecting numeric in D37370 / R37370C4: got 'n.a.'
## Warning: Expecting numeric in D37371 / R37371C4: got 'n.a.'
## Warning: Expecting numeric in D37372 / R37372C4: got 'n.a.'
## Warning: Expecting numeric in D37373 / R37373C4: got 'n.a.'
## Warning: Expecting numeric in D37374 / R37374C4: got 'n.a.'
## Warning: Expecting numeric in D37375 / R37375C4: got 'n.a.'
## Warning: Expecting numeric in D37376 / R37376C4: got 'n.a.'
## Warning: Expecting numeric in D37377 / R37377C4: got 'n.a.'
## Warning: Expecting numeric in D37378 / R37378C4: got 'n.a.'
## Warning: Expecting numeric in D37379 / R37379C4: got 'n.a.'
## Warning: Expecting numeric in D37380 / R37380C4: got 'n.a.'
## Warning: Expecting numeric in D37381 / R37381C4: got 'n.a.'
## Warning: Expecting numeric in D37382 / R37382C4: got 'n.a.'
## Warning: Expecting numeric in D37383 / R37383C4: got 'n.a.'
## Warning: Expecting numeric in D37384 / R37384C4: got 'n.a.'
## Warning: Expecting numeric in D37385 / R37385C4: got 'n.a.'
## Warning: Expecting numeric in D37386 / R37386C4: got 'n.a.'
## Warning: Expecting numeric in D37387 / R37387C4: got 'n.a.'
## Warning: Expecting numeric in D37388 / R37388C4: got 'n.a.'
## Warning: Expecting numeric in D37389 / R37389C4: got 'n.a.'
## Warning: Expecting numeric in D37390 / R37390C4: got 'n.a.'
## Warning: Expecting numeric in D37391 / R37391C4: got 'n.a.'
## Warning: Expecting numeric in D37392 / R37392C4: got 'n.a.'
## Warning: Expecting numeric in D37393 / R37393C4: got 'n.a.'
## Warning: Expecting numeric in D37394 / R37394C4: got 'n.a.'
## Warning: Expecting numeric in D37395 / R37395C4: got 'n.a.'
## Warning: Expecting numeric in D37396 / R37396C4: got 'n.a.'
## Warning: Expecting numeric in D37397 / R37397C4: got 'n.a.'
## Warning: Expecting numeric in D37398 / R37398C4: got 'n.a.'
## Warning: Expecting numeric in D37399 / R37399C4: got 'n.a.'
## Warning: Expecting numeric in D37400 / R37400C4: got 'n.a.'
## Warning: Expecting numeric in D37401 / R37401C4: got 'n.a.'
## Warning: Expecting numeric in D37402 / R37402C4: got 'n.a.'
## Warning: Expecting numeric in D37403 / R37403C4: got 'n.a.'
## Warning: Expecting numeric in D37404 / R37404C4: got 'n.a.'
## Warning: Expecting numeric in D37405 / R37405C4: got 'n.a.'
## Warning: Expecting numeric in D37406 / R37406C4: got 'n.a.'
## Warning: Expecting numeric in D37407 / R37407C4: got 'n.a.'
## Warning: Expecting numeric in D37408 / R37408C4: got 'n.a.'
## Warning: Expecting numeric in D37409 / R37409C4: got 'n.a.'
## Warning: Expecting numeric in D37410 / R37410C4: got 'n.a.'
## Warning: Expecting numeric in D37411 / R37411C4: got 'n.a.'
## Warning: Expecting numeric in D37412 / R37412C4: got 'n.a.'
## Warning: Expecting numeric in D37413 / R37413C4: got 'n.a.'
## Warning: Expecting numeric in D37414 / R37414C4: got 'n.a.'
## Warning: Expecting numeric in D37415 / R37415C4: got 'n.a.'
## Warning: Expecting numeric in D37416 / R37416C4: got 'n.a.'
## Warning: Expecting numeric in D37417 / R37417C4: got 'n.a.'
## Warning: Expecting numeric in D37418 / R37418C4: got 'n.a.'
## Warning: Expecting numeric in D37419 / R37419C4: got 'n.a.'
## Warning: Expecting numeric in D37420 / R37420C4: got 'n.a.'
## Warning: Expecting numeric in D37421 / R37421C4: got 'n.a.'
## Warning: Expecting numeric in D37422 / R37422C4: got 'n.a.'
## Warning: Expecting numeric in D37423 / R37423C4: got 'n.a.'
## Warning: Expecting numeric in D37424 / R37424C4: got 'n.a.'
## Warning: Expecting numeric in D37425 / R37425C4: got 'n.a.'
## Warning: Expecting numeric in D37426 / R37426C4: got 'n.a.'
## Warning: Expecting numeric in D37427 / R37427C4: got 'n.a.'
## Warning: Expecting numeric in D37428 / R37428C4: got 'n.a.'
## Warning: Expecting numeric in D37429 / R37429C4: got 'n.a.'
## Warning: Expecting numeric in D37430 / R37430C4: got 'n.a.'
## Warning: Expecting numeric in D37431 / R37431C4: got 'n.a.'
## Warning: Expecting numeric in D37432 / R37432C4: got 'n.a.'
## Warning: Expecting numeric in D37433 / R37433C4: got 'n.a.'
## Warning: Expecting numeric in D37434 / R37434C4: got 'n.a.'
## Warning: Expecting numeric in D37435 / R37435C4: got 'n.a.'
## Warning: Expecting numeric in D37436 / R37436C4: got 'n.a.'
## Warning: Expecting numeric in D37437 / R37437C4: got 'n.a.'
## Warning: Expecting numeric in D37438 / R37438C4: got 'n.a.'
## Warning: Expecting numeric in D37439 / R37439C4: got 'n.a.'
## Warning: Expecting numeric in D37440 / R37440C4: got 'n.a.'
## Warning: Expecting numeric in D37441 / R37441C4: got 'n.a.'
## Warning: Expecting numeric in D37442 / R37442C4: got 'n.a.'
## Warning: Expecting numeric in D37443 / R37443C4: got 'n.a.'
## Warning: Expecting numeric in D37444 / R37444C4: got 'n.a.'
## Warning: Expecting numeric in D37445 / R37445C4: got 'n.a.'
## Warning: Expecting numeric in D37446 / R37446C4: got 'n.a.'
## Warning: Expecting numeric in D37447 / R37447C4: got 'n.a.'
## Warning: Expecting numeric in D37448 / R37448C4: got 'n.a.'
## Warning: Expecting numeric in D37449 / R37449C4: got 'n.a.'
## Warning: Expecting numeric in D37450 / R37450C4: got 'n.a.'
## Warning: Expecting numeric in D37451 / R37451C4: got 'n.a.'
## Warning: Expecting numeric in D37452 / R37452C4: got 'n.a.'
## Warning: Expecting numeric in D37453 / R37453C4: got 'n.a.'
## Warning: Expecting numeric in D37454 / R37454C4: got 'n.a.'
## Warning: Expecting numeric in D37455 / R37455C4: got 'n.a.'
## Warning: Expecting numeric in D37456 / R37456C4: got 'n.a.'
## Warning: Expecting numeric in D37457 / R37457C4: got 'n.a.'
## Warning: Expecting numeric in D37458 / R37458C4: got 'n.a.'
## Warning: Expecting numeric in D37459 / R37459C4: got 'n.a.'
## Warning: Expecting numeric in D37460 / R37460C4: got 'n.a.'
## Warning: Expecting numeric in D37461 / R37461C4: got 'n.a.'
## Warning: Expecting numeric in D37462 / R37462C4: got 'n.a.'
## Warning: Expecting numeric in D37463 / R37463C4: got 'n.a.'
## Warning: Expecting numeric in D37464 / R37464C4: got 'n.a.'
## Warning: Expecting numeric in D37465 / R37465C4: got 'n.a.'
## Warning: Expecting numeric in D37466 / R37466C4: got 'n.a.'
## Warning: Expecting numeric in D37467 / R37467C4: got 'n.a.'
## Warning: Expecting numeric in D37468 / R37468C4: got 'n.a.'
## Warning: Expecting numeric in D37469 / R37469C4: got 'n.a.'
## Warning: Expecting numeric in D37470 / R37470C4: got 'n.a.'
## Warning: Expecting numeric in D37471 / R37471C4: got 'n.a.'
## Warning: Expecting numeric in D37472 / R37472C4: got 'n.a.'
## Warning: Expecting numeric in D37473 / R37473C4: got 'n.a.'
## Warning: Expecting numeric in D37474 / R37474C4: got 'n.a.'
## Warning: Expecting numeric in D37475 / R37475C4: got 'n.a.'
## Warning: Expecting numeric in D37476 / R37476C4: got 'n.a.'
## Warning: Expecting numeric in D37477 / R37477C4: got 'n.a.'
## Warning: Expecting numeric in D37478 / R37478C4: got 'n.a.'
## Warning: Expecting numeric in D37479 / R37479C4: got 'n.a.'
## Warning: Expecting numeric in D37480 / R37480C4: got 'n.a.'
## Warning: Expecting numeric in D37481 / R37481C4: got 'n.a.'
## Warning: Expecting numeric in D37482 / R37482C4: got 'n.a.'
## Warning: Expecting numeric in D37483 / R37483C4: got 'n.a.'
## Warning: Expecting numeric in D37484 / R37484C4: got 'n.a.'
## Warning: Expecting numeric in D37485 / R37485C4: got 'n.a.'
## Warning: Expecting numeric in D37486 / R37486C4: got 'n.a.'
## Warning: Expecting numeric in D37487 / R37487C4: got 'n.a.'
## Warning: Expecting numeric in D37488 / R37488C4: got 'n.a.'
## Warning: Expecting numeric in D37489 / R37489C4: got 'n.a.'
## Warning: Expecting numeric in D37490 / R37490C4: got 'n.a.'
## Warning: Expecting numeric in D37491 / R37491C4: got 'n.a.'
## Warning: Expecting numeric in D37492 / R37492C4: got 'n.a.'
## Warning: Expecting numeric in D37493 / R37493C4: got 'n.a.'
## Warning: Expecting numeric in D37494 / R37494C4: got 'n.a.'
## Warning: Expecting numeric in D37495 / R37495C4: got 'n.a.'
## Warning: Expecting numeric in D37496 / R37496C4: got 'n.a.'
## Warning: Expecting numeric in D37497 / R37497C4: got 'n.a.'
## Warning: Expecting numeric in D37498 / R37498C4: got 'n.a.'
## Warning: Expecting numeric in D37499 / R37499C4: got 'n.a.'
## Warning: Expecting numeric in D37500 / R37500C4: got 'n.a.'
## Warning: Expecting numeric in D37501 / R37501C4: got 'n.a.'
## Warning: Expecting numeric in D37502 / R37502C4: got 'n.a.'
## Warning: Expecting numeric in D37503 / R37503C4: got 'n.a.'
## Warning: Expecting numeric in D37504 / R37504C4: got 'n.a.'
## Warning: Expecting numeric in D37505 / R37505C4: got 'n.a.'
## Warning: Expecting numeric in D37506 / R37506C4: got 'n.a.'
## Warning: Expecting numeric in D37507 / R37507C4: got 'n.a.'
## Warning: Expecting numeric in D37508 / R37508C4: got 'n.a.'
## Warning: Expecting numeric in D37509 / R37509C4: got 'n.a.'
## Warning: Expecting numeric in D37510 / R37510C4: got 'n.a.'
## Warning: Expecting numeric in D37511 / R37511C4: got 'n.a.'
## Warning: Expecting numeric in D37512 / R37512C4: got 'n.a.'
## Warning: Expecting numeric in D37513 / R37513C4: got 'n.a.'
## Warning: Expecting numeric in D37514 / R37514C4: got 'n.a.'
## Warning: Expecting numeric in D37515 / R37515C4: got 'n.a.'
## Warning: Expecting numeric in D37516 / R37516C4: got 'n.a.'
## Warning: Expecting numeric in D37517 / R37517C4: got 'n.a.'
## Warning: Expecting numeric in D37518 / R37518C4: got 'n.a.'
## Warning: Expecting numeric in D37519 / R37519C4: got 'n.a.'
## Warning: Expecting numeric in D37520 / R37520C4: got 'n.a.'
## Warning: Expecting numeric in D37521 / R37521C4: got 'n.a.'
## Warning: Expecting numeric in D37522 / R37522C4: got 'n.a.'
## Warning: Expecting numeric in D37523 / R37523C4: got 'n.a.'
## Warning: Expecting numeric in D37524 / R37524C4: got 'n.a.'
## Warning: Expecting numeric in D37525 / R37525C4: got 'n.a.'
## Warning: Expecting numeric in D37526 / R37526C4: got 'n.a.'
## Warning: Expecting numeric in D37527 / R37527C4: got 'n.a.'
## Warning: Expecting numeric in D37528 / R37528C4: got 'n.a.'
## Warning: Expecting numeric in D37529 / R37529C4: got 'n.a.'
## Warning: Expecting numeric in D37530 / R37530C4: got 'n.a.'
## Warning: Expecting numeric in D37531 / R37531C4: got 'n.a.'
## Warning: Expecting numeric in D37532 / R37532C4: got 'n.a.'
## Warning: Expecting numeric in D37533 / R37533C4: got 'n.a.'
## Warning: Expecting numeric in D37534 / R37534C4: got 'n.a.'
## Warning: Expecting numeric in D37535 / R37535C4: got 'n.a.'
## Warning: Expecting numeric in D37536 / R37536C4: got 'n.a.'
## Warning: Expecting numeric in D37537 / R37537C4: got 'n.a.'
## Warning: Expecting numeric in D37538 / R37538C4: got 'n.a.'
## Warning: Expecting numeric in D37539 / R37539C4: got 'n.a.'
## Warning: Expecting numeric in D37540 / R37540C4: got 'n.a.'
## Warning: Expecting numeric in D37541 / R37541C4: got 'n.a.'
## Warning: Expecting numeric in D37542 / R37542C4: got 'n.a.'
## Warning: Expecting numeric in D37543 / R37543C4: got 'n.a.'
## Warning: Expecting numeric in D37544 / R37544C4: got 'n.a.'
## Warning: Expecting numeric in D37545 / R37545C4: got 'n.a.'
## Warning: Expecting numeric in D37546 / R37546C4: got 'n.a.'
## Warning: Expecting numeric in D37547 / R37547C4: got 'n.a.'
## Warning: Expecting numeric in D37548 / R37548C4: got 'n.a.'
## Warning: Expecting numeric in D37549 / R37549C4: got 'n.a.'
## Warning: Expecting numeric in D37550 / R37550C4: got 'n.a.'
## Warning: Expecting numeric in D37551 / R37551C4: got 'n.a.'
## Warning: Expecting numeric in D37552 / R37552C4: got 'n.a.'
## Warning: Expecting numeric in D37553 / R37553C4: got 'n.a.'
## Warning: Expecting numeric in D37554 / R37554C4: got 'n.a.'
## Warning: Expecting numeric in D37555 / R37555C4: got 'n.a.'
## Warning: Expecting numeric in D37556 / R37556C4: got 'n.a.'
## Warning: Expecting numeric in D37557 / R37557C4: got 'n.a.'
## Warning: Expecting numeric in D37558 / R37558C4: got 'n.a.'
## Warning: Expecting numeric in D37559 / R37559C4: got 'n.a.'
## Warning: Expecting numeric in D37560 / R37560C4: got 'n.a.'
## Warning: Expecting numeric in D37561 / R37561C4: got 'n.a.'
## Warning: Expecting numeric in D37562 / R37562C4: got 'n.a.'
## Warning: Expecting numeric in D37563 / R37563C4: got 'n.a.'
## Warning: Expecting numeric in D37564 / R37564C4: got 'n.a.'
## Warning: Expecting numeric in D37565 / R37565C4: got 'n.a.'
## Warning: Expecting numeric in D37566 / R37566C4: got 'n.a.'
## Warning: Expecting numeric in D37567 / R37567C4: got 'n.a.'
## Warning: Expecting numeric in D37568 / R37568C4: got 'n.a.'
## Warning: Expecting numeric in D37569 / R37569C4: got 'n.a.'
## Warning: Expecting numeric in D37570 / R37570C4: got 'n.a.'
## Warning: Expecting numeric in D37571 / R37571C4: got 'n.a.'
## Warning: Expecting numeric in D37572 / R37572C4: got 'n.a.'
## Warning: Expecting numeric in D37573 / R37573C4: got 'n.a.'
## Warning: Expecting numeric in D37574 / R37574C4: got 'n.a.'
## Warning: Expecting numeric in D37575 / R37575C4: got 'n.a.'
## Warning: Expecting numeric in D37576 / R37576C4: got 'n.a.'
## Warning: Expecting numeric in D37577 / R37577C4: got 'n.a.'
## Warning: Expecting numeric in D37578 / R37578C4: got 'n.a.'
## Warning: Expecting numeric in D37579 / R37579C4: got 'n.a.'
## Warning: Expecting numeric in D37580 / R37580C4: got 'n.a.'
## Warning: Expecting numeric in D37581 / R37581C4: got 'n.a.'
## Warning: Expecting numeric in D37582 / R37582C4: got 'n.a.'
## Warning: Expecting numeric in D37583 / R37583C4: got 'n.a.'
## Warning: Expecting numeric in D37584 / R37584C4: got 'n.a.'
## Warning: Expecting numeric in D37585 / R37585C4: got 'n.a.'
## Warning: Expecting numeric in D37586 / R37586C4: got 'n.a.'
## Warning: Expecting numeric in D37587 / R37587C4: got 'n.a.'
## Warning: Expecting numeric in D37588 / R37588C4: got 'n.a.'
## Warning: Expecting numeric in D37589 / R37589C4: got 'n.a.'
## Warning: Expecting numeric in D37590 / R37590C4: got 'n.a.'
## Warning: Expecting numeric in D37591 / R37591C4: got 'n.a.'
## Warning: Expecting numeric in D37592 / R37592C4: got 'n.a.'
## Warning: Expecting numeric in D37593 / R37593C4: got 'n.a.'
## Warning: Expecting numeric in D37594 / R37594C4: got 'n.a.'
## Warning: Expecting numeric in D37595 / R37595C4: got 'n.a.'
## Warning: Expecting numeric in D37596 / R37596C4: got 'n.a.'
## Warning: Expecting numeric in D37597 / R37597C4: got 'n.a.'
## Warning: Expecting numeric in D37598 / R37598C4: got 'n.a.'
## Warning: Expecting numeric in D37599 / R37599C4: got 'n.a.'
## Warning: Expecting numeric in D37600 / R37600C4: got 'n.a.'
## Warning: Expecting numeric in D37601 / R37601C4: got 'n.a.'
## Warning: Expecting numeric in D37602 / R37602C4: got 'n.a.'
## Warning: Expecting numeric in D37603 / R37603C4: got 'n.a.'
## Warning: Expecting numeric in D37604 / R37604C4: got 'n.a.'
## Warning: Expecting numeric in D37605 / R37605C4: got 'n.a.'
## Warning: Expecting numeric in D37606 / R37606C4: got 'n.a.'
## Warning: Expecting numeric in D37607 / R37607C4: got 'n.a.'
## Warning: Expecting numeric in D37608 / R37608C4: got 'n.a.'
## Warning: Expecting numeric in D37609 / R37609C4: got 'n.a.'
## Warning: Expecting numeric in D37610 / R37610C4: got 'n.a.'
## Warning: Expecting numeric in D37611 / R37611C4: got 'n.a.'
## Warning: Expecting numeric in D37612 / R37612C4: got 'n.a.'
## Warning: Expecting numeric in D37613 / R37613C4: got 'n.a.'
## Warning: Expecting numeric in D37614 / R37614C4: got 'n.a.'
## Warning: Expecting numeric in D37615 / R37615C4: got 'n.a.'
## Warning: Expecting numeric in D37616 / R37616C4: got 'n.a.'
## Warning: Expecting numeric in D37617 / R37617C4: got 'n.a.'
## Warning: Expecting numeric in D37618 / R37618C4: got 'n.a.'
## Warning: Expecting numeric in D37619 / R37619C4: got 'n.a.'
## Warning: Expecting numeric in D37620 / R37620C4: got 'n.a.'
## Warning: Expecting numeric in D37621 / R37621C4: got 'n.a.'
## Warning: Expecting numeric in D37622 / R37622C4: got 'n.a.'
## Warning: Expecting numeric in D37623 / R37623C4: got 'n.a.'
## Warning: Expecting numeric in D37624 / R37624C4: got 'n.a.'
## Warning: Expecting numeric in D37625 / R37625C4: got 'n.a.'
## Warning: Expecting numeric in D37626 / R37626C4: got 'n.a.'
## Warning: Expecting numeric in D37627 / R37627C4: got 'n.a.'
## Warning: Expecting numeric in D37628 / R37628C4: got 'n.a.'
## Warning: Expecting numeric in D37629 / R37629C4: got 'n.a.'
## Warning: Expecting numeric in D37630 / R37630C4: got 'n.a.'
## Warning: Expecting numeric in D37631 / R37631C4: got 'n.a.'
## Warning: Expecting numeric in D37632 / R37632C4: got 'n.a.'
## Warning: Expecting numeric in D37633 / R37633C4: got 'n.a.'
## Warning: Expecting numeric in D37634 / R37634C4: got 'n.a.'
## Warning: Expecting numeric in D37635 / R37635C4: got 'n.a.'
## Warning: Expecting numeric in D37636 / R37636C4: got 'n.a.'
## Warning: Expecting numeric in D37637 / R37637C4: got 'n.a.'
## Warning: Expecting numeric in D37638 / R37638C4: got 'n.a.'
## Warning: Expecting numeric in D37639 / R37639C4: got 'n.a.'
## Warning: Expecting numeric in D37640 / R37640C4: got 'n.a.'
## Warning: Expecting numeric in D37641 / R37641C4: got 'n.a.'
## Warning: Expecting numeric in D37642 / R37642C4: got 'n.a.'
## Warning: Expecting numeric in D37643 / R37643C4: got 'n.a.'
## Warning: Expecting numeric in D37644 / R37644C4: got 'n.a.'
## Warning: Expecting numeric in D37645 / R37645C4: got 'n.a.'
## Warning: Expecting numeric in D37646 / R37646C4: got 'n.a.'
## Warning: Expecting numeric in D37647 / R37647C4: got 'n.a.'
## Warning: Expecting numeric in D37648 / R37648C4: got 'n.a.'
## Warning: Expecting numeric in D37649 / R37649C4: got 'n.a.'
## Warning: Expecting numeric in D37650 / R37650C4: got 'n.a.'
## Warning: Expecting numeric in D37651 / R37651C4: got 'n.a.'
## Warning: Expecting numeric in D37652 / R37652C4: got 'n.a.'
## Warning: Expecting numeric in D37653 / R37653C4: got 'n.a.'
## Warning: Expecting numeric in D37654 / R37654C4: got 'n.a.'
## Warning: Expecting numeric in D37655 / R37655C4: got 'n.a.'
## Warning: Expecting numeric in D37656 / R37656C4: got 'n.a.'
## Warning: Expecting numeric in D37657 / R37657C4: got 'n.a.'
## Warning: Expecting numeric in D37658 / R37658C4: got 'n.a.'
## Warning: Expecting numeric in D37659 / R37659C4: got 'n.a.'
## Warning: Expecting numeric in D37660 / R37660C4: got 'n.a.'
## Warning: Expecting numeric in D37661 / R37661C4: got 'n.a.'
## Warning: Expecting numeric in D37662 / R37662C4: got 'n.a.'
## Warning: Expecting numeric in D37663 / R37663C4: got 'n.a.'
## Warning: Expecting numeric in D37664 / R37664C4: got 'n.a.'
## Warning: Expecting numeric in D37665 / R37665C4: got 'n.a.'
## Warning: Expecting numeric in D37666 / R37666C4: got 'n.a.'
## Warning: Expecting numeric in D37667 / R37667C4: got 'n.a.'
## Warning: Expecting numeric in D37668 / R37668C4: got 'n.a.'
## Warning: Expecting numeric in D37669 / R37669C4: got 'n.a.'
## Warning: Expecting numeric in D37670 / R37670C4: got 'n.a.'
## Warning: Expecting numeric in D37671 / R37671C4: got 'n.a.'
## Warning: Expecting numeric in D37672 / R37672C4: got 'n.a.'
## Warning: Expecting numeric in D37673 / R37673C4: got 'n.a.'
## Warning: Expecting numeric in D37674 / R37674C4: got 'n.a.'
## Warning: Expecting numeric in D37675 / R37675C4: got 'n.a.'
## Warning: Expecting numeric in D37676 / R37676C4: got 'n.a.'
## Warning: Expecting numeric in D37677 / R37677C4: got 'n.a.'
## Warning: Expecting numeric in D37678 / R37678C4: got 'n.a.'
## Warning: Expecting numeric in D37679 / R37679C4: got 'n.a.'
## Warning: Expecting numeric in D37680 / R37680C4: got 'n.a.'
## Warning: Expecting numeric in D37681 / R37681C4: got 'n.a.'
## Warning: Expecting numeric in D37682 / R37682C4: got 'n.a.'
## Warning: Expecting numeric in D37683 / R37683C4: got 'n.a.'
## Warning: Expecting numeric in D37684 / R37684C4: got 'n.a.'
## Warning: Expecting numeric in D37685 / R37685C4: got 'n.a.'
## Warning: Expecting numeric in D37686 / R37686C4: got 'n.a.'
## Warning: Expecting numeric in D37687 / R37687C4: got 'n.a.'
## Warning: Expecting numeric in D37688 / R37688C4: got 'n.a.'
## Warning: Expecting numeric in D37689 / R37689C4: got 'n.a.'
## Warning: Expecting numeric in D37690 / R37690C4: got 'n.a.'
## Warning: Expecting numeric in D37691 / R37691C4: got 'n.a.'
## Warning: Expecting numeric in D37692 / R37692C4: got 'n.a.'
## Warning: Expecting numeric in D37693 / R37693C4: got 'n.a.'
## Warning: Expecting numeric in D37694 / R37694C4: got 'n.a.'
## Warning: Expecting numeric in D37695 / R37695C4: got 'n.a.'
## Warning: Expecting numeric in D37696 / R37696C4: got 'n.a.'
## Warning: Expecting numeric in D37697 / R37697C4: got 'n.a.'
## Warning: Expecting numeric in D37698 / R37698C4: got 'n.a.'
## Warning: Expecting numeric in D37699 / R37699C4: got 'n.a.'
## Warning: Expecting numeric in D37700 / R37700C4: got 'n.a.'
## Warning: Expecting numeric in D37701 / R37701C4: got 'n.a.'
## Warning: Expecting numeric in D37702 / R37702C4: got 'n.a.'
## Warning: Expecting numeric in D37703 / R37703C4: got 'n.a.'
## Warning: Expecting numeric in D37704 / R37704C4: got 'n.a.'
## Warning: Expecting numeric in D37705 / R37705C4: got 'n.a.'
## Warning: Expecting numeric in D37706 / R37706C4: got 'n.a.'
## Warning: Expecting numeric in D37707 / R37707C4: got 'n.a.'
## Warning: Expecting numeric in D37708 / R37708C4: got 'n.a.'
## Warning: Expecting numeric in D37709 / R37709C4: got 'n.a.'
## Warning: Expecting numeric in D37710 / R37710C4: got 'n.a.'
## Warning: Expecting numeric in D37711 / R37711C4: got 'n.a.'
## Warning: Expecting numeric in D37712 / R37712C4: got 'n.a.'
## Warning: Expecting numeric in D37713 / R37713C4: got 'n.a.'
## Warning: Expecting numeric in D37714 / R37714C4: got 'n.a.'
## Warning: Expecting numeric in D37715 / R37715C4: got 'n.a.'
## Warning: Expecting numeric in D37716 / R37716C4: got 'n.a.'
## Warning: Expecting numeric in D37717 / R37717C4: got 'n.a.'
## Warning: Expecting numeric in D37718 / R37718C4: got 'n.a.'
## Warning: Expecting numeric in D37719 / R37719C4: got 'n.a.'
## Warning: Expecting numeric in D37720 / R37720C4: got 'n.a.'
## Warning: Expecting numeric in D37721 / R37721C4: got 'n.a.'
## Warning: Expecting numeric in D37722 / R37722C4: got 'n.a.'
## Warning: Expecting numeric in D37723 / R37723C4: got 'n.a.'
## Warning: Expecting numeric in D37724 / R37724C4: got 'n.a.'
## Warning: Expecting numeric in D37725 / R37725C4: got 'n.a.'
## Warning: Expecting numeric in D37726 / R37726C4: got 'n.a.'
## Warning: Expecting numeric in D37727 / R37727C4: got 'n.a.'
## Warning: Expecting numeric in D37728 / R37728C4: got 'n.a.'
## Warning: Expecting numeric in D37729 / R37729C4: got 'n.a.'
## Warning: Expecting numeric in D37730 / R37730C4: got 'n.a.'
## Warning: Expecting numeric in D37731 / R37731C4: got 'n.a.'
## Warning: Expecting numeric in D37732 / R37732C4: got 'n.a.'
## Warning: Expecting numeric in D37733 / R37733C4: got 'n.a.'
## Warning: Expecting numeric in D37734 / R37734C4: got 'n.a.'
## Warning: Expecting numeric in D37735 / R37735C4: got 'n.a.'
## Warning: Expecting numeric in D37736 / R37736C4: got 'n.a.'
## Warning: Expecting numeric in D37737 / R37737C4: got 'n.a.'
## Warning: Expecting numeric in D37738 / R37738C4: got 'n.a.'
## Warning: Expecting numeric in D37739 / R37739C4: got 'n.a.'
## Warning: Expecting numeric in D37740 / R37740C4: got 'n.a.'
## Warning: Expecting numeric in D37741 / R37741C4: got 'n.a.'
## Warning: Expecting numeric in D37742 / R37742C4: got 'n.a.'
## Warning: Expecting numeric in D37743 / R37743C4: got 'n.a.'
## Warning: Expecting numeric in D37744 / R37744C4: got 'n.a.'
## Warning: Expecting numeric in D37745 / R37745C4: got 'n.a.'
## Warning: Expecting numeric in D37746 / R37746C4: got 'n.a.'
## Warning: Expecting numeric in D37747 / R37747C4: got 'n.a.'
## Warning: Expecting numeric in D37748 / R37748C4: got 'n.a.'
## Warning: Expecting numeric in D37749 / R37749C4: got 'n.a.'
## Warning: Expecting numeric in D37750 / R37750C4: got 'n.a.'
## Warning: Expecting numeric in D37751 / R37751C4: got 'n.a.'
## Warning: Expecting numeric in D37752 / R37752C4: got 'n.a.'
## Warning: Expecting numeric in D37753 / R37753C4: got 'n.a.'
## Warning: Expecting numeric in D37754 / R37754C4: got 'n.a.'
## Warning: Expecting numeric in D37755 / R37755C4: got 'n.a.'
## Warning: Expecting numeric in D37756 / R37756C4: got 'n.a.'
## Warning: Expecting numeric in D37757 / R37757C4: got 'n.a.'
## Warning: Expecting numeric in D37758 / R37758C4: got 'n.a.'
## Warning: Expecting numeric in D37759 / R37759C4: got 'n.a.'
## Warning: Expecting numeric in D37760 / R37760C4: got 'n.a.'
## Warning: Expecting numeric in D37761 / R37761C4: got 'n.a.'
## Warning: Expecting numeric in D37762 / R37762C4: got 'n.a.'
## Warning: Expecting numeric in D37763 / R37763C4: got 'n.a.'
## Warning: Expecting numeric in D37764 / R37764C4: got 'n.a.'
## Warning: Expecting numeric in D37765 / R37765C4: got 'n.a.'
## Warning: Expecting numeric in D37766 / R37766C4: got 'n.a.'
## Warning: Expecting numeric in D37767 / R37767C4: got 'n.a.'
## Warning: Expecting numeric in D37768 / R37768C4: got 'n.a.'
## Warning: Expecting numeric in D37769 / R37769C4: got 'n.a.'
## Warning: Expecting numeric in D37770 / R37770C4: got 'n.a.'
## Warning: Expecting numeric in D37771 / R37771C4: got 'n.a.'
## Warning: Expecting numeric in D37772 / R37772C4: got 'n.a.'
## Warning: Expecting numeric in D37773 / R37773C4: got 'n.a.'
## Warning: Expecting numeric in D37774 / R37774C4: got 'n.a.'
## Warning: Expecting numeric in D37775 / R37775C4: got 'n.a.'
## Warning: Expecting numeric in D37776 / R37776C4: got 'n.a.'
## Warning: Expecting numeric in D37777 / R37777C4: got 'n.a.'
## Warning: Expecting numeric in D37778 / R37778C4: got 'n.a.'
## Warning: Expecting numeric in D37779 / R37779C4: got 'n.a.'
## Warning: Expecting numeric in D37780 / R37780C4: got 'n.a.'
## Warning: Expecting numeric in D37781 / R37781C4: got 'n.a.'
## Warning: Expecting numeric in D37782 / R37782C4: got 'n.a.'
## Warning: Expecting numeric in D37783 / R37783C4: got 'n.a.'
## Warning: Expecting numeric in D37784 / R37784C4: got 'n.a.'
## Warning: Expecting numeric in D37785 / R37785C4: got 'n.a.'
## Warning: Expecting numeric in D37786 / R37786C4: got 'n.a.'
## Warning: Expecting numeric in D37787 / R37787C4: got 'n.a.'
## Warning: Expecting numeric in D37788 / R37788C4: got 'n.a.'
## Warning: Expecting numeric in D37789 / R37789C4: got 'n.a.'
## Warning: Expecting numeric in D37790 / R37790C4: got 'n.a.'
## Warning: Expecting numeric in D37791 / R37791C4: got 'n.a.'
## Warning: Expecting numeric in D37792 / R37792C4: got 'n.a.'
## Warning: Expecting numeric in D37793 / R37793C4: got 'n.a.'
## Warning: Expecting numeric in D37794 / R37794C4: got 'n.a.'
## Warning: Expecting numeric in D37795 / R37795C4: got 'n.a.'
## Warning: Expecting numeric in D37796 / R37796C4: got 'n.a.'
## Warning: Expecting numeric in D37797 / R37797C4: got 'n.a.'
## Warning: Expecting numeric in D37798 / R37798C4: got 'n.a.'
## Warning: Expecting numeric in D37799 / R37799C4: got 'n.a.'
## Warning: Expecting numeric in D37800 / R37800C4: got 'n.a.'
## Warning: Expecting numeric in D37801 / R37801C4: got 'n.a.'
## Warning: Expecting numeric in D37802 / R37802C4: got 'n.a.'
## Warning: Expecting numeric in D37803 / R37803C4: got 'n.a.'
## Warning: Expecting numeric in D37804 / R37804C4: got 'n.a.'
## Warning: Expecting numeric in D37805 / R37805C4: got 'n.a.'
## Warning: Expecting numeric in D37806 / R37806C4: got 'n.a.'
## Warning: Expecting numeric in D37807 / R37807C4: got 'n.a.'
## Warning: Expecting numeric in D37808 / R37808C4: got 'n.a.'
## Warning: Expecting numeric in D37809 / R37809C4: got 'n.a.'
## Warning: Expecting numeric in D37810 / R37810C4: got 'n.a.'
## Warning: Expecting numeric in D37811 / R37811C4: got 'n.a.'
## Warning: Expecting numeric in D37812 / R37812C4: got 'n.a.'
## Warning: Expecting numeric in D37813 / R37813C4: got 'n.a.'
## Warning: Expecting numeric in D37814 / R37814C4: got 'n.a.'
## Warning: Expecting numeric in D37815 / R37815C4: got 'n.a.'
## Warning: Expecting numeric in D37816 / R37816C4: got 'n.a.'
## Warning: Expecting numeric in D37817 / R37817C4: got 'n.a.'
## Warning: Expecting numeric in D37818 / R37818C4: got 'n.a.'
## Warning: Expecting numeric in D37819 / R37819C4: got 'n.a.'
## Warning: Expecting numeric in D37820 / R37820C4: got 'n.a.'
## Warning: Expecting numeric in D37821 / R37821C4: got 'n.a.'
## Warning: Expecting numeric in D37822 / R37822C4: got 'n.a.'
## Warning: Expecting numeric in D37823 / R37823C4: got 'n.a.'
## Warning: Expecting numeric in D37824 / R37824C4: got 'n.a.'
## Warning: Expecting numeric in D37825 / R37825C4: got 'n.a.'
## Warning: Expecting numeric in D37826 / R37826C4: got 'n.a.'
## Warning: Expecting numeric in D37827 / R37827C4: got 'n.a.'
## Warning: Expecting numeric in D37828 / R37828C4: got 'n.a.'
## Warning: Expecting numeric in D37829 / R37829C4: got 'n.a.'
## Warning: Expecting numeric in D37830 / R37830C4: got 'n.a.'
## Warning: Expecting numeric in D37831 / R37831C4: got 'n.a.'
## Warning: Expecting numeric in D37832 / R37832C4: got 'n.a.'
## Warning: Expecting numeric in D37833 / R37833C4: got 'n.a.'
## Warning: Expecting numeric in D37834 / R37834C4: got 'n.a.'
## Warning: Expecting numeric in D37835 / R37835C4: got 'n.a.'
## Warning: Expecting numeric in D37836 / R37836C4: got 'n.a.'
## Warning: Expecting numeric in D37837 / R37837C4: got 'n.a.'
## Warning: Expecting numeric in D37838 / R37838C4: got 'n.a.'
## Warning: Expecting numeric in D37839 / R37839C4: got 'n.a.'
## Warning: Expecting numeric in D37840 / R37840C4: got 'n.a.'
## Warning: Expecting numeric in D37841 / R37841C4: got 'n.a.'
## Warning: Expecting numeric in D37842 / R37842C4: got 'n.a.'
## Warning: Expecting numeric in D37843 / R37843C4: got 'n.a.'
## Warning: Expecting numeric in D37844 / R37844C4: got 'n.a.'
## Warning: Expecting numeric in D37845 / R37845C4: got 'n.a.'
## Warning: Expecting numeric in D37846 / R37846C4: got 'n.a.'
## Warning: Expecting numeric in D37847 / R37847C4: got 'n.a.'
## Warning: Expecting numeric in D37848 / R37848C4: got 'n.a.'
## Warning: Expecting numeric in D37849 / R37849C4: got 'n.a.'
## Warning: Expecting numeric in D37850 / R37850C4: got 'n.a.'
## Warning: Expecting numeric in D37851 / R37851C4: got 'n.a.'
## Warning: Expecting numeric in D37852 / R37852C4: got 'n.a.'
## Warning: Expecting numeric in D37853 / R37853C4: got 'n.a.'
## Warning: Expecting numeric in D37854 / R37854C4: got 'n.a.'
## Warning: Expecting numeric in D37855 / R37855C4: got 'n.a.'
## Warning: Expecting numeric in D37856 / R37856C4: got 'n.a.'
## Warning: Expecting numeric in D37857 / R37857C4: got 'n.a.'
## Warning: Expecting numeric in D37858 / R37858C4: got 'n.a.'
## Warning: Expecting numeric in D37859 / R37859C4: got 'n.a.'
## Warning: Expecting numeric in D37860 / R37860C4: got 'n.a.'
## Warning: Expecting numeric in D37861 / R37861C4: got 'n.a.'
## Warning: Expecting numeric in D37862 / R37862C4: got 'n.a.'
## Warning: Expecting numeric in D37863 / R37863C4: got 'n.a.'
## Warning: Expecting numeric in D37864 / R37864C4: got 'n.a.'
## Warning: Expecting numeric in D37865 / R37865C4: got 'n.a.'
## Warning: Expecting numeric in D37866 / R37866C4: got 'n.a.'
## Warning: Expecting numeric in D37867 / R37867C4: got 'n.a.'
## Warning: Expecting numeric in D37868 / R37868C4: got 'n.a.'
## Warning: Expecting numeric in D37869 / R37869C4: got 'n.a.'
## Warning: Expecting numeric in D37870 / R37870C4: got 'n.a.'
## Warning: Expecting numeric in D37871 / R37871C4: got 'n.a.'
## Warning: Expecting numeric in D37872 / R37872C4: got 'n.a.'
## Warning: Expecting numeric in D37873 / R37873C4: got 'n.a.'
## Warning: Expecting numeric in D37874 / R37874C4: got 'n.a.'
## Warning: Expecting numeric in D37875 / R37875C4: got 'n.a.'
## Warning: Expecting numeric in D37876 / R37876C4: got 'n.a.'
## Warning: Expecting numeric in D37877 / R37877C4: got 'n.a.'
## Warning: Expecting numeric in D37878 / R37878C4: got 'n.a.'
## Warning: Expecting numeric in D37879 / R37879C4: got 'n.a.'
## Warning: Expecting numeric in D37880 / R37880C4: got 'n.a.'
## Warning: Expecting numeric in D37881 / R37881C4: got 'n.a.'
## Warning: Expecting numeric in D37882 / R37882C4: got 'n.a.'
## Warning: Expecting numeric in D37883 / R37883C4: got 'n.a.'
## Warning: Expecting numeric in D37884 / R37884C4: got 'n.a.'
## Warning: Expecting numeric in D37885 / R37885C4: got 'n.a.'
## Warning: Expecting numeric in D37886 / R37886C4: got 'n.a.'
## Warning: Expecting numeric in D37887 / R37887C4: got 'n.a.'
## Warning: Expecting numeric in D37888 / R37888C4: got 'n.a.'
## Warning: Expecting numeric in D37889 / R37889C4: got 'n.a.'
## Warning: Expecting numeric in D37890 / R37890C4: got 'n.a.'
## Warning: Expecting numeric in D37891 / R37891C4: got 'n.a.'
## Warning: Expecting numeric in D37892 / R37892C4: got 'n.a.'
## Warning: Expecting numeric in D37893 / R37893C4: got 'n.a.'
## Warning: Expecting numeric in D37894 / R37894C4: got 'n.a.'
## Warning: Expecting numeric in D37895 / R37895C4: got 'n.a.'
## Warning: Expecting numeric in D37896 / R37896C4: got 'n.a.'
## Warning: Expecting numeric in D37897 / R37897C4: got 'n.a.'
## Warning: Expecting numeric in D37898 / R37898C4: got 'n.a.'
## Warning: Expecting numeric in D37899 / R37899C4: got 'n.a.'
## Warning: Expecting numeric in D37900 / R37900C4: got 'n.a.'
## Warning: Expecting numeric in D37901 / R37901C4: got 'n.a.'
## Warning: Expecting numeric in D37902 / R37902C4: got 'n.a.'
## Warning: Expecting numeric in D37903 / R37903C4: got 'n.a.'
## Warning: Expecting numeric in D37904 / R37904C4: got 'n.a.'
## Warning: Expecting numeric in D37905 / R37905C4: got 'n.a.'
## Warning: Expecting numeric in D37906 / R37906C4: got 'n.a.'
## Warning: Expecting numeric in D37907 / R37907C4: got 'n.a.'
## Warning: Expecting numeric in D37908 / R37908C4: got 'n.a.'
## Warning: Expecting numeric in D37909 / R37909C4: got 'n.a.'
## Warning: Expecting numeric in D37910 / R37910C4: got 'n.a.'
## Warning: Expecting numeric in D37911 / R37911C4: got 'n.a.'
## Warning: Expecting numeric in D37912 / R37912C4: got 'n.a.'
## Warning: Expecting numeric in D37913 / R37913C4: got 'n.a.'
## Warning: Expecting numeric in D37914 / R37914C4: got 'n.a.'
## Warning: Expecting numeric in D37915 / R37915C4: got 'n.a.'
## Warning: Expecting numeric in D37916 / R37916C4: got 'n.a.'
## Warning: Expecting numeric in D37917 / R37917C4: got 'n.a.'
## Warning: Expecting numeric in D37918 / R37918C4: got 'n.a.'
## Warning: Expecting numeric in D37919 / R37919C4: got 'n.a.'
## Warning: Expecting numeric in D37920 / R37920C4: got 'n.a.'
## Warning: Expecting numeric in D37921 / R37921C4: got 'n.a.'
## Warning: Expecting numeric in D37922 / R37922C4: got 'n.a.'
## Warning: Expecting numeric in D37923 / R37923C4: got 'n.a.'
## Warning: Expecting numeric in D37924 / R37924C4: got 'n.a.'
## Warning: Expecting numeric in D37925 / R37925C4: got 'n.a.'
## Warning: Expecting numeric in D37926 / R37926C4: got 'n.a.'
## Warning: Expecting numeric in D37927 / R37927C4: got 'n.a.'
## Warning: Expecting numeric in D37928 / R37928C4: got 'n.a.'
## Warning: Expecting numeric in D37929 / R37929C4: got 'n.a.'
## Warning: Expecting numeric in D37930 / R37930C4: got 'n.a.'
## Warning: Expecting numeric in D37931 / R37931C4: got 'n.a.'
## Warning: Expecting numeric in D37932 / R37932C4: got 'n.a.'
## Warning: Expecting numeric in D37933 / R37933C4: got 'n.a.'
## Warning: Expecting numeric in D37934 / R37934C4: got 'n.a.'
## Warning: Expecting numeric in D37935 / R37935C4: got 'n.a.'
## Warning: Expecting numeric in D37936 / R37936C4: got 'n.a.'
## Warning: Expecting numeric in D37937 / R37937C4: got 'n.a.'
## Warning: Expecting numeric in D37938 / R37938C4: got 'n.a.'
## Warning: Expecting numeric in D37939 / R37939C4: got 'n.a.'
## Warning: Expecting numeric in D37940 / R37940C4: got 'n.a.'
## Warning: Expecting numeric in D37941 / R37941C4: got 'n.a.'
## Warning: Expecting numeric in D37942 / R37942C4: got 'n.a.'
## Warning: Expecting numeric in D37943 / R37943C4: got 'n.a.'
## Warning: Expecting numeric in D37944 / R37944C4: got 'n.a.'
## Warning: Expecting numeric in D37945 / R37945C4: got 'n.a.'
## Warning: Expecting numeric in D37946 / R37946C4: got 'n.a.'
## Warning: Expecting numeric in D37947 / R37947C4: got 'n.a.'
## Warning: Expecting numeric in D37948 / R37948C4: got 'n.a.'
## Warning: Expecting numeric in D37949 / R37949C4: got 'n.a.'
## Warning: Expecting numeric in D37950 / R37950C4: got 'n.a.'
## Warning: Expecting numeric in D37951 / R37951C4: got 'n.a.'
## Warning: Expecting numeric in D37952 / R37952C4: got 'n.a.'
## Warning: Expecting numeric in D37953 / R37953C4: got 'n.a.'
## Warning: Expecting numeric in D37954 / R37954C4: got 'n.a.'
## Warning: Expecting numeric in D37955 / R37955C4: got 'n.a.'
## Warning: Expecting numeric in D37956 / R37956C4: got 'n.a.'
## Warning: Expecting numeric in D37957 / R37957C4: got 'n.a.'
## Warning: Expecting numeric in D37958 / R37958C4: got 'n.a.'
## Warning: Expecting numeric in D37959 / R37959C4: got 'n.a.'
## Warning: Expecting numeric in D37960 / R37960C4: got 'n.a.'
## Warning: Expecting numeric in D37961 / R37961C4: got 'n.a.'
## Warning: Expecting numeric in D37962 / R37962C4: got 'n.a.'
## Warning: Expecting numeric in D37963 / R37963C4: got 'n.a.'
## Warning: Expecting numeric in D37964 / R37964C4: got 'n.a.'
## Warning: Expecting numeric in D37965 / R37965C4: got 'n.a.'
## Warning: Expecting numeric in D37966 / R37966C4: got 'n.a.'
## Warning: Expecting numeric in D37967 / R37967C4: got 'n.a.'
## Warning: Expecting numeric in D37968 / R37968C4: got 'n.a.'
## Warning: Expecting numeric in D37969 / R37969C4: got 'n.a.'
## Warning: Expecting numeric in D37970 / R37970C4: got 'n.a.'
## Warning: Expecting numeric in D37971 / R37971C4: got 'n.a.'
## Warning: Expecting numeric in D37972 / R37972C4: got 'n.a.'
## Warning: Expecting numeric in D37973 / R37973C4: got 'n.a.'
## Warning: Expecting numeric in D37974 / R37974C4: got 'n.a.'
## Warning: Expecting numeric in D37975 / R37975C4: got 'n.a.'
## Warning: Expecting numeric in D37976 / R37976C4: got 'n.a.'
## Warning: Expecting numeric in D37977 / R37977C4: got 'n.a.'
## Warning: Expecting numeric in D37978 / R37978C4: got 'n.a.'
## Warning: Expecting numeric in D37979 / R37979C4: got 'n.a.'
## Warning: Expecting numeric in D37980 / R37980C4: got 'n.a.'
## Warning: Expecting numeric in D37981 / R37981C4: got 'n.a.'
## Warning: Expecting numeric in D37982 / R37982C4: got 'n.a.'
## Warning: Expecting numeric in D37983 / R37983C4: got 'n.a.'
## Warning: Expecting numeric in D37984 / R37984C4: got 'n.a.'
## Warning: Expecting numeric in D37985 / R37985C4: got 'n.a.'
## Warning: Expecting numeric in D37986 / R37986C4: got 'n.a.'
## Warning: Expecting numeric in D37987 / R37987C4: got 'n.a.'
## Warning: Expecting numeric in D37988 / R37988C4: got 'n.a.'
## Warning: Expecting numeric in D37989 / R37989C4: got 'n.a.'
## Warning: Expecting numeric in D37990 / R37990C4: got 'n.a.'
## Warning: Expecting numeric in D37991 / R37991C4: got 'n.a.'
## Warning: Expecting numeric in D37992 / R37992C4: got 'n.a.'
## Warning: Expecting numeric in D37993 / R37993C4: got 'n.a.'
## Warning: Expecting numeric in D37994 / R37994C4: got 'n.a.'
## Warning: Expecting numeric in D37995 / R37995C4: got 'n.a.'
## Warning: Expecting numeric in D37996 / R37996C4: got 'n.a.'
## Warning: Expecting numeric in D37997 / R37997C4: got 'n.a.'
## Warning: Expecting numeric in D37998 / R37998C4: got 'n.a.'
## Warning: Expecting numeric in D37999 / R37999C4: got 'n.a.'
## Warning: Expecting numeric in D38000 / R38000C4: got 'n.a.'
## Warning: Expecting numeric in D38001 / R38001C4: got 'n.a.'
## Warning: Expecting numeric in D38002 / R38002C4: got 'n.a.'
## Warning: Expecting numeric in D38003 / R38003C4: got 'n.a.'
## Warning: Expecting numeric in D38004 / R38004C4: got 'n.a.'
## Warning: Expecting numeric in D38005 / R38005C4: got 'n.a.'
## Warning: Expecting numeric in D38006 / R38006C4: got 'n.a.'
## Warning: Expecting numeric in D38007 / R38007C4: got 'n.a.'
## Warning: Expecting numeric in D38008 / R38008C4: got 'n.a.'
## Warning: Expecting numeric in D38009 / R38009C4: got 'n.a.'
## Warning: Expecting numeric in D38010 / R38010C4: got 'n.a.'
## Warning: Expecting numeric in D38011 / R38011C4: got 'n.a.'
## Warning: Expecting numeric in D38012 / R38012C4: got 'n.a.'
## Warning: Expecting numeric in D38013 / R38013C4: got 'n.a.'
## Warning: Expecting numeric in D38014 / R38014C4: got 'n.a.'
## Warning: Expecting numeric in D38015 / R38015C4: got 'n.a.'
## Warning: Expecting numeric in D38016 / R38016C4: got 'n.a.'
## Warning: Expecting numeric in D38017 / R38017C4: got 'n.a.'
## Warning: Expecting numeric in D38018 / R38018C4: got 'n.a.'
## Warning: Expecting numeric in D38019 / R38019C4: got 'n.a.'
## Warning: Expecting numeric in D38020 / R38020C4: got 'n.a.'
## Warning: Expecting numeric in D38021 / R38021C4: got 'n.a.'
## Warning: Expecting numeric in D38022 / R38022C4: got 'n.a.'
## Warning: Expecting numeric in D38023 / R38023C4: got 'n.a.'
## Warning: Expecting numeric in D38024 / R38024C4: got 'n.a.'
## Warning: Expecting numeric in D38025 / R38025C4: got 'n.a.'
## Warning: Expecting numeric in D38026 / R38026C4: got 'n.a.'
## Warning: Expecting numeric in D38027 / R38027C4: got 'n.a.'
## Warning: Expecting numeric in D38028 / R38028C4: got 'n.a.'
## Warning: Expecting numeric in D38029 / R38029C4: got 'n.a.'
## Warning: Expecting numeric in D38030 / R38030C4: got 'n.a.'
## Warning: Expecting numeric in D38031 / R38031C4: got 'n.a.'
## Warning: Expecting numeric in D38032 / R38032C4: got 'n.a.'
## Warning: Expecting numeric in D38033 / R38033C4: got 'n.a.'
## Warning: Expecting numeric in D38034 / R38034C4: got 'n.a.'
## Warning: Expecting numeric in D38035 / R38035C4: got 'n.a.'
## Warning: Expecting numeric in D38036 / R38036C4: got 'n.a.'
## Warning: Expecting numeric in D38037 / R38037C4: got 'n.a.'
## Warning: Expecting numeric in D38038 / R38038C4: got 'n.a.'
## Warning: Expecting numeric in D38039 / R38039C4: got 'n.a.'
## Warning: Expecting numeric in D38040 / R38040C4: got 'n.a.'
## Warning: Expecting numeric in D38041 / R38041C4: got 'n.a.'
## Warning: Expecting numeric in D38042 / R38042C4: got 'n.a.'
## Warning: Expecting numeric in D38043 / R38043C4: got 'n.a.'
## Warning: Expecting numeric in D38044 / R38044C4: got 'n.a.'
## Warning: Expecting numeric in D38045 / R38045C4: got 'n.a.'
## Warning: Expecting numeric in D38046 / R38046C4: got 'n.a.'
## Warning: Expecting numeric in D38047 / R38047C4: got 'n.a.'
## Warning: Expecting numeric in D38048 / R38048C4: got 'n.a.'
## Warning: Expecting numeric in D38049 / R38049C4: got 'n.a.'
## Warning: Expecting numeric in D38050 / R38050C4: got 'n.a.'
## Warning: Expecting numeric in D38051 / R38051C4: got 'n.a.'
## Warning: Expecting numeric in D38052 / R38052C4: got 'n.a.'
## Warning: Expecting numeric in D38053 / R38053C4: got 'n.a.'
## Warning: Expecting numeric in D38054 / R38054C4: got 'n.a.'
## Warning: Expecting numeric in D38055 / R38055C4: got 'n.a.'
## Warning: Expecting numeric in D38056 / R38056C4: got 'n.a.'
## Warning: Expecting numeric in D38057 / R38057C4: got 'n.a.'
## Warning: Expecting numeric in D38058 / R38058C4: got 'n.a.'
## Warning: Expecting numeric in D38059 / R38059C4: got 'n.a.'
## Warning: Expecting numeric in D38060 / R38060C4: got 'n.a.'
## Warning: Expecting numeric in D38061 / R38061C4: got 'n.a.'
## Warning: Expecting numeric in D38062 / R38062C4: got 'n.a.'
## Warning: Expecting numeric in D38063 / R38063C4: got 'n.a.'
## Warning: Expecting numeric in D38064 / R38064C4: got 'n.a.'
## Warning: Expecting numeric in D38065 / R38065C4: got 'n.a.'
## Warning: Expecting numeric in D38066 / R38066C4: got 'n.a.'
## Warning: Expecting numeric in D38067 / R38067C4: got 'n.a.'
## Warning: Expecting numeric in D38068 / R38068C4: got 'n.a.'
## Warning: Expecting numeric in D38069 / R38069C4: got 'n.a.'
## Warning: Expecting numeric in D38070 / R38070C4: got 'n.a.'
## Warning: Expecting numeric in D38071 / R38071C4: got 'n.a.'
## Warning: Expecting numeric in D38072 / R38072C4: got 'n.a.'
## Warning: Expecting numeric in D38073 / R38073C4: got 'n.a.'
## Warning: Expecting numeric in D38074 / R38074C4: got 'n.a.'
## Warning: Expecting numeric in D38075 / R38075C4: got 'n.a.'
## Warning: Expecting numeric in D38076 / R38076C4: got 'n.a.'
## Warning: Expecting numeric in D38077 / R38077C4: got 'n.a.'
## Warning: Expecting numeric in D38078 / R38078C4: got 'n.a.'
## Warning: Expecting numeric in D38079 / R38079C4: got 'n.a.'
## Warning: Expecting numeric in D38080 / R38080C4: got 'n.a.'
## Warning: Expecting numeric in D38081 / R38081C4: got 'n.a.'
## Warning: Expecting numeric in D38082 / R38082C4: got 'n.a.'
## Warning: Expecting numeric in D38083 / R38083C4: got 'n.a.'
## Warning: Expecting numeric in D38084 / R38084C4: got 'n.a.'
## Warning: Expecting numeric in D38085 / R38085C4: got 'n.a.'
## Warning: Expecting numeric in D38086 / R38086C4: got 'n.a.'
## Warning: Expecting numeric in D38087 / R38087C4: got 'n.a.'
## Warning: Expecting numeric in D38088 / R38088C4: got 'n.a.'
## Warning: Expecting numeric in D38089 / R38089C4: got 'n.a.'
## Warning: Expecting numeric in D38090 / R38090C4: got 'n.a.'
## Warning: Expecting numeric in D38091 / R38091C4: got 'n.a.'
## Warning: Expecting numeric in D38092 / R38092C4: got 'n.a.'
## Warning: Expecting numeric in D38093 / R38093C4: got 'n.a.'
## Warning: Expecting numeric in D38094 / R38094C4: got 'n.a.'
## Warning: Expecting numeric in D38095 / R38095C4: got 'n.a.'
## Warning: Expecting numeric in D38096 / R38096C4: got 'n.a.'
## Warning: Expecting numeric in D38097 / R38097C4: got 'n.a.'
## Warning: Expecting numeric in D38098 / R38098C4: got 'n.a.'
## Warning: Expecting numeric in D38099 / R38099C4: got 'n.a.'
## Warning: Expecting numeric in D38100 / R38100C4: got 'n.a.'
## Warning: Expecting numeric in D38101 / R38101C4: got 'n.a.'
## Warning: Expecting numeric in D38102 / R38102C4: got 'n.a.'
## Warning: Expecting numeric in D38103 / R38103C4: got 'n.a.'
## Warning: Expecting numeric in D38104 / R38104C4: got 'n.a.'
## Warning: Expecting numeric in D38105 / R38105C4: got 'n.a.'
## Warning: Expecting numeric in D38106 / R38106C4: got 'n.a.'
## Warning: Expecting numeric in D38107 / R38107C4: got 'n.a.'
## Warning: Expecting numeric in D38108 / R38108C4: got 'n.a.'
## Warning: Expecting numeric in D38109 / R38109C4: got 'n.a.'
## Warning: Expecting numeric in D38110 / R38110C4: got 'n.a.'
## Warning: Expecting numeric in D38111 / R38111C4: got 'n.a.'
## Warning: Expecting numeric in D38112 / R38112C4: got 'n.a.'
## Warning: Expecting numeric in D38113 / R38113C4: got 'n.a.'
## Warning: Expecting numeric in D38114 / R38114C4: got 'n.a.'
## Warning: Expecting numeric in D38115 / R38115C4: got 'n.a.'
## Warning: Expecting numeric in D38116 / R38116C4: got 'n.a.'
## Warning: Expecting numeric in D38117 / R38117C4: got 'n.a.'
## Warning: Expecting numeric in D38118 / R38118C4: got 'n.a.'
## Warning: Expecting numeric in D38119 / R38119C4: got 'n.a.'
## Warning: Expecting numeric in D38120 / R38120C4: got 'n.a.'
## Warning: Expecting numeric in D38121 / R38121C4: got 'n.a.'
## Warning: Expecting numeric in D38122 / R38122C4: got 'n.a.'
## Warning: Expecting numeric in D38123 / R38123C4: got 'n.a.'
## Warning: Expecting numeric in D38124 / R38124C4: got 'n.a.'
## Warning: Expecting numeric in D38125 / R38125C4: got 'n.a.'
## Warning: Expecting numeric in D38126 / R38126C4: got 'n.a.'
## Warning: Expecting numeric in D38127 / R38127C4: got 'n.a.'
## Warning: Expecting numeric in D38128 / R38128C4: got 'n.a.'
## Warning: Expecting numeric in D38129 / R38129C4: got 'n.a.'
## Warning: Expecting numeric in D38130 / R38130C4: got 'n.a.'
## Warning: Expecting numeric in D38131 / R38131C4: got 'n.a.'
## Warning: Expecting numeric in D38132 / R38132C4: got 'n.a.'
## Warning: Expecting numeric in D38133 / R38133C4: got 'n.a.'
## Warning: Expecting numeric in D38134 / R38134C4: got 'n.a.'
## Warning: Expecting numeric in D38135 / R38135C4: got 'n.a.'
## Warning: Expecting numeric in D38136 / R38136C4: got 'n.a.'
## Warning: Expecting numeric in D38137 / R38137C4: got 'n.a.'
## Warning: Expecting numeric in D38138 / R38138C4: got 'n.a.'
## Warning: Expecting numeric in D38139 / R38139C4: got 'n.a.'
## Warning: Expecting numeric in D38140 / R38140C4: got 'n.a.'
## Warning: Expecting numeric in D38141 / R38141C4: got 'n.a.'
## Warning: Expecting numeric in D38142 / R38142C4: got 'n.a.'
## Warning: Expecting numeric in D38143 / R38143C4: got 'n.a.'
## Warning: Expecting numeric in D38144 / R38144C4: got 'n.a.'
## Warning: Expecting numeric in D38145 / R38145C4: got 'n.a.'
## Warning: Expecting numeric in D38146 / R38146C4: got 'n.a.'
## Warning: Expecting numeric in D38147 / R38147C4: got 'n.a.'
## Warning: Expecting numeric in D38148 / R38148C4: got 'n.a.'
## Warning: Expecting numeric in D38149 / R38149C4: got 'n.a.'
## Warning: Expecting numeric in D38150 / R38150C4: got 'n.a.'
## Warning: Expecting numeric in D38151 / R38151C4: got 'n.a.'
## Warning: Expecting numeric in D38152 / R38152C4: got 'n.a.'
## Warning: Expecting numeric in D38153 / R38153C4: got 'n.a.'
## Warning: Expecting numeric in D38154 / R38154C4: got 'n.a.'
## Warning: Expecting numeric in D38155 / R38155C4: got 'n.a.'
## Warning: Expecting numeric in D38156 / R38156C4: got 'n.a.'
## Warning: Expecting numeric in D38157 / R38157C4: got 'n.a.'
## Warning: Expecting numeric in D38158 / R38158C4: got 'n.a.'
## Warning: Expecting numeric in D38159 / R38159C4: got 'n.a.'
## Warning: Expecting numeric in D38160 / R38160C4: got 'n.a.'
## Warning: Expecting numeric in D38161 / R38161C4: got 'n.a.'
## Warning: Expecting numeric in D38162 / R38162C4: got 'n.a.'
## Warning: Expecting numeric in D38163 / R38163C4: got 'n.a.'
## Warning: Expecting numeric in D38164 / R38164C4: got 'n.a.'
## Warning: Expecting numeric in D38165 / R38165C4: got 'n.a.'
## Warning: Expecting numeric in D38166 / R38166C4: got 'n.a.'
## Warning: Expecting numeric in D38167 / R38167C4: got 'n.a.'
## Warning: Expecting numeric in D38168 / R38168C4: got 'n.a.'
## Warning: Expecting numeric in D38169 / R38169C4: got 'n.a.'
## Warning: Expecting numeric in D38170 / R38170C4: got 'n.a.'
## Warning: Expecting numeric in D38171 / R38171C4: got 'n.a.'
## Warning: Expecting numeric in D38172 / R38172C4: got 'n.a.'
## Warning: Expecting numeric in D38173 / R38173C4: got 'n.a.'
## Warning: Expecting numeric in D38174 / R38174C4: got 'n.a.'
## Warning: Expecting numeric in D38175 / R38175C4: got 'n.a.'
## Warning: Expecting numeric in D38176 / R38176C4: got 'n.a.'
## Warning: Expecting numeric in D38177 / R38177C4: got 'n.a.'
## Warning: Expecting numeric in D38178 / R38178C4: got 'n.a.'
## Warning: Expecting numeric in D38179 / R38179C4: got 'n.a.'
## Warning: Expecting numeric in D38180 / R38180C4: got 'n.a.'
## Warning: Expecting numeric in D38181 / R38181C4: got 'n.a.'
## Warning: Expecting numeric in D38182 / R38182C4: got 'n.a.'
## Warning: Expecting numeric in D38183 / R38183C4: got 'n.a.'
## Warning: Expecting numeric in D38184 / R38184C4: got 'n.a.'
## Warning: Expecting numeric in D38185 / R38185C4: got 'n.a.'
## Warning: Expecting numeric in D38186 / R38186C4: got 'n.a.'
## Warning: Expecting numeric in D38187 / R38187C4: got 'n.a.'
## Warning: Expecting numeric in D38188 / R38188C4: got 'n.a.'
## Warning: Expecting numeric in D38189 / R38189C4: got 'n.a.'
## Warning: Expecting numeric in D38190 / R38190C4: got 'n.a.'
## Warning: Expecting numeric in D38191 / R38191C4: got 'n.a.'
## Warning: Expecting numeric in D38192 / R38192C4: got 'n.a.'
## Warning: Expecting numeric in D38193 / R38193C4: got 'n.a.'
## Warning: Expecting numeric in D38194 / R38194C4: got 'n.a.'
## Warning: Expecting numeric in D38195 / R38195C4: got 'n.a.'
## Warning: Expecting numeric in D38196 / R38196C4: got 'n.a.'
## Warning: Expecting numeric in D38197 / R38197C4: got 'n.a.'
## Warning: Expecting numeric in D38198 / R38198C4: got 'n.a.'
## Warning: Expecting numeric in D38199 / R38199C4: got 'n.a.'
## Warning: Expecting numeric in D38200 / R38200C4: got 'n.a.'
## Warning: Expecting numeric in D38201 / R38201C4: got 'n.a.'
## Warning: Expecting numeric in D38202 / R38202C4: got 'n.a.'
## Warning: Expecting numeric in D38203 / R38203C4: got 'n.a.'
## Warning: Expecting numeric in D38204 / R38204C4: got 'n.a.'
## Warning: Expecting numeric in D38205 / R38205C4: got 'n.a.'
## Warning: Expecting numeric in D38206 / R38206C4: got 'n.a.'
## Warning: Expecting numeric in D38207 / R38207C4: got 'n.a.'
## Warning: Expecting numeric in D38208 / R38208C4: got 'n.a.'
## Warning: Expecting numeric in D38209 / R38209C4: got 'n.a.'
## Warning: Expecting numeric in D38210 / R38210C4: got 'n.a.'
## Warning: Expecting numeric in D38211 / R38211C4: got 'n.a.'
## Warning: Expecting numeric in D38212 / R38212C4: got 'n.a.'
## Warning: Expecting numeric in D38213 / R38213C4: got 'n.a.'
## Warning: Expecting numeric in D38214 / R38214C4: got 'n.a.'
## Warning: Expecting numeric in D38215 / R38215C4: got 'n.a.'
## Warning: Expecting numeric in D38216 / R38216C4: got 'n.a.'
## Warning: Expecting numeric in D38217 / R38217C4: got 'n.a.'
## Warning: Expecting numeric in D38218 / R38218C4: got 'n.a.'
## Warning: Expecting numeric in D38219 / R38219C4: got 'n.a.'
## Warning: Expecting numeric in D38220 / R38220C4: got 'n.a.'
## Warning: Expecting numeric in D38221 / R38221C4: got 'n.a.'
## Warning: Expecting numeric in D38222 / R38222C4: got 'n.a.'
## Warning: Expecting numeric in D38223 / R38223C4: got 'n.a.'
## Warning: Expecting numeric in D38224 / R38224C4: got 'n.a.'
## Warning: Expecting numeric in D38225 / R38225C4: got 'n.a.'
## Warning: Expecting numeric in D38226 / R38226C4: got 'n.a.'
## Warning: Expecting numeric in D38227 / R38227C4: got 'n.a.'
## Warning: Expecting numeric in D38228 / R38228C4: got 'n.a.'
## Warning: Expecting numeric in D38229 / R38229C4: got 'n.a.'
## Warning: Expecting numeric in D38230 / R38230C4: got 'n.a.'
## Warning: Expecting numeric in D38231 / R38231C4: got 'n.a.'
## Warning: Expecting numeric in D38232 / R38232C4: got 'n.a.'
## Warning: Expecting numeric in D38233 / R38233C4: got 'n.a.'
## Warning: Expecting numeric in D38234 / R38234C4: got 'n.a.'
## Warning: Expecting numeric in D38235 / R38235C4: got 'n.a.'
## Warning: Expecting numeric in D38236 / R38236C4: got 'n.a.'
## Warning: Expecting numeric in D38237 / R38237C4: got 'n.a.'
## Warning: Expecting numeric in D38238 / R38238C4: got 'n.a.'
## Warning: Expecting numeric in D38239 / R38239C4: got 'n.a.'
## Warning: Expecting numeric in D38240 / R38240C4: got 'n.a.'
## Warning: Expecting numeric in D38241 / R38241C4: got 'n.a.'
## Warning: Expecting numeric in D38242 / R38242C4: got 'n.a.'
## Warning: Expecting numeric in D38243 / R38243C4: got 'n.a.'
## Warning: Expecting numeric in D38244 / R38244C4: got 'n.a.'
## Warning: Expecting numeric in D38245 / R38245C4: got 'n.a.'
## Warning: Expecting numeric in D38246 / R38246C4: got 'n.a.'
## Warning: Expecting numeric in D38247 / R38247C4: got 'n.a.'
## Warning: Expecting numeric in D38248 / R38248C4: got 'n.a.'
## Warning: Expecting numeric in D38249 / R38249C4: got 'n.a.'
## Warning: Expecting numeric in D38250 / R38250C4: got 'n.a.'
## Warning: Expecting numeric in D38251 / R38251C4: got 'n.a.'
## Warning: Expecting numeric in D38252 / R38252C4: got 'n.a.'
## Warning: Expecting numeric in D38253 / R38253C4: got 'n.a.'
## Warning: Expecting numeric in D38254 / R38254C4: got 'n.a.'
## Warning: Expecting numeric in D38255 / R38255C4: got 'n.a.'
## Warning: Expecting numeric in D38256 / R38256C4: got 'n.a.'
## Warning: Expecting numeric in D38257 / R38257C4: got 'n.a.'
## Warning: Expecting numeric in D38258 / R38258C4: got 'n.a.'
## Warning: Expecting numeric in D38259 / R38259C4: got 'n.a.'
## Warning: Expecting numeric in D38260 / R38260C4: got 'n.a.'
## Warning: Expecting numeric in D38261 / R38261C4: got 'n.a.'
## Warning: Expecting numeric in D38262 / R38262C4: got 'n.a.'
## Warning: Expecting numeric in D38263 / R38263C4: got 'n.a.'
## Warning: Expecting numeric in D38264 / R38264C4: got 'n.a.'
## Warning: Expecting numeric in D38265 / R38265C4: got 'n.a.'
## Warning: Expecting numeric in D38266 / R38266C4: got 'n.a.'
## Warning: Expecting numeric in D38267 / R38267C4: got 'n.a.'
## Warning: Expecting numeric in D38268 / R38268C4: got 'n.a.'
## Warning: Expecting numeric in D38269 / R38269C4: got 'n.a.'
## Warning: Expecting numeric in D38270 / R38270C4: got 'n.a.'
## Warning: Expecting numeric in D38271 / R38271C4: got 'n.a.'
## Warning: Expecting numeric in D38272 / R38272C4: got 'n.a.'
## Warning: Expecting numeric in D38273 / R38273C4: got 'n.a.'
## Warning: Expecting numeric in D38274 / R38274C4: got 'n.a.'
## Warning: Expecting numeric in D38275 / R38275C4: got 'n.a.'
## Warning: Expecting numeric in D38276 / R38276C4: got 'n.a.'
## Warning: Expecting numeric in D38277 / R38277C4: got 'n.a.'
## Warning: Expecting numeric in D38278 / R38278C4: got 'n.a.'
## Warning: Expecting numeric in D38279 / R38279C4: got 'n.a.'
## Warning: Expecting numeric in D38280 / R38280C4: got 'n.a.'
## Warning: Expecting numeric in D38281 / R38281C4: got 'n.a.'
## Warning: Expecting numeric in D38282 / R38282C4: got 'n.a.'
## Warning: Expecting numeric in D38283 / R38283C4: got 'n.a.'
## Warning: Expecting numeric in D38284 / R38284C4: got 'n.a.'
## Warning: Expecting numeric in D38285 / R38285C4: got 'n.a.'
## Warning: Expecting numeric in D38286 / R38286C4: got 'n.a.'
## Warning: Expecting numeric in D38287 / R38287C4: got 'n.a.'
## Warning: Expecting numeric in D38288 / R38288C4: got 'n.a.'
## Warning: Expecting numeric in D38289 / R38289C4: got 'n.a.'
## Warning: Expecting numeric in D38290 / R38290C4: got 'n.a.'
## Warning: Expecting numeric in D38291 / R38291C4: got 'n.a.'
## Warning: Expecting numeric in D38292 / R38292C4: got 'n.a.'
## Warning: Expecting numeric in D38293 / R38293C4: got 'n.a.'
## Warning: Expecting numeric in D38294 / R38294C4: got 'n.a.'
## Warning: Expecting numeric in D38295 / R38295C4: got 'n.a.'
## Warning: Expecting numeric in D38296 / R38296C4: got 'n.a.'
## Warning: Expecting numeric in D38297 / R38297C4: got 'n.a.'
## Warning: Expecting numeric in D38298 / R38298C4: got 'n.a.'
## Warning: Expecting numeric in D38299 / R38299C4: got 'n.a.'
## Warning: Expecting numeric in D38300 / R38300C4: got 'n.a.'
## Warning: Expecting numeric in D38301 / R38301C4: got 'n.a.'
## Warning: Expecting numeric in D38302 / R38302C4: got 'n.a.'
## Warning: Expecting numeric in D38303 / R38303C4: got 'n.a.'
## Warning: Expecting numeric in D38304 / R38304C4: got 'n.a.'
## Warning: Expecting numeric in D38305 / R38305C4: got 'n.a.'
## Warning: Expecting numeric in D38306 / R38306C4: got 'n.a.'
## Warning: Expecting numeric in D38307 / R38307C4: got 'n.a.'
## Warning: Expecting numeric in D38308 / R38308C4: got 'n.a.'
## Warning: Expecting numeric in D38309 / R38309C4: got 'n.a.'
## Warning: Expecting numeric in D38310 / R38310C4: got 'n.a.'
## Warning: Expecting numeric in D38311 / R38311C4: got 'n.a.'
## Warning: Expecting numeric in D38312 / R38312C4: got 'n.a.'
## Warning: Expecting numeric in D38313 / R38313C4: got 'n.a.'
## Warning: Expecting numeric in D38314 / R38314C4: got 'n.a.'
## Warning: Expecting numeric in D38315 / R38315C4: got 'n.a.'
## Warning: Expecting numeric in D38316 / R38316C4: got 'n.a.'
## Warning: Expecting numeric in D38317 / R38317C4: got 'n.a.'
## Warning: Expecting numeric in D38318 / R38318C4: got 'n.a.'
## Warning: Expecting numeric in D38319 / R38319C4: got 'n.a.'
## Warning: Expecting numeric in D38320 / R38320C4: got 'n.a.'
## Warning: Expecting numeric in D38321 / R38321C4: got 'n.a.'
## Warning: Expecting numeric in D38322 / R38322C4: got 'n.a.'
## Warning: Expecting numeric in D38323 / R38323C4: got 'n.a.'
## Warning: Expecting numeric in D38324 / R38324C4: got 'n.a.'
## Warning: Expecting numeric in D38325 / R38325C4: got 'n.a.'
## Warning: Expecting numeric in D38326 / R38326C4: got 'n.a.'
## Warning: Expecting numeric in D38327 / R38327C4: got 'n.a.'
## Warning: Expecting numeric in D38328 / R38328C4: got 'n.a.'
## Warning: Expecting numeric in D38329 / R38329C4: got 'n.a.'
## Warning: Expecting numeric in D38330 / R38330C4: got 'n.a.'
## Warning: Expecting numeric in D38331 / R38331C4: got 'n.a.'
## Warning: Expecting numeric in D38332 / R38332C4: got 'n.a.'
## Warning: Expecting numeric in D38333 / R38333C4: got 'n.a.'
## Warning: Expecting numeric in D38334 / R38334C4: got 'n.a.'
## Warning: Expecting numeric in D38335 / R38335C4: got 'n.a.'
## Warning: Expecting numeric in D38336 / R38336C4: got 'n.a.'
## Warning: Expecting numeric in D38337 / R38337C4: got 'n.a.'
## Warning: Expecting numeric in D38338 / R38338C4: got 'n.a.'
## Warning: Expecting numeric in D38339 / R38339C4: got 'n.a.'
## Warning: Expecting numeric in D38340 / R38340C4: got 'n.a.'
## Warning: Expecting numeric in D38341 / R38341C4: got 'n.a.'
## Warning: Expecting numeric in D38342 / R38342C4: got 'n.a.'
## Warning: Expecting numeric in D38343 / R38343C4: got 'n.a.'
## Warning: Expecting numeric in D38344 / R38344C4: got 'n.a.'
## Warning: Expecting numeric in D38345 / R38345C4: got 'n.a.'
## Warning: Expecting numeric in D38346 / R38346C4: got 'n.a.'
## Warning: Expecting numeric in D38347 / R38347C4: got 'n.a.'
## Warning: Expecting numeric in D38348 / R38348C4: got 'n.a.'
## Warning: Expecting numeric in D38349 / R38349C4: got 'n.a.'
## Warning: Expecting numeric in D38350 / R38350C4: got 'n.a.'
## Warning: Expecting numeric in D38351 / R38351C4: got 'n.a.'
## Warning: Expecting numeric in D38352 / R38352C4: got 'n.a.'
## Warning: Expecting numeric in D38353 / R38353C4: got 'n.a.'
## Warning: Expecting numeric in D38354 / R38354C4: got 'n.a.'
## Warning: Expecting numeric in D38355 / R38355C4: got 'n.a.'
## Warning: Expecting numeric in D38356 / R38356C4: got 'n.a.'
## Warning: Expecting numeric in D38357 / R38357C4: got 'n.a.'
## Warning: Expecting numeric in D38358 / R38358C4: got 'n.a.'
## Warning: Expecting numeric in D38359 / R38359C4: got 'n.a.'
## Warning: Expecting numeric in D38360 / R38360C4: got 'n.a.'
## Warning: Expecting numeric in D38361 / R38361C4: got 'n.a.'
## Warning: Expecting numeric in D38362 / R38362C4: got 'n.a.'
## Warning: Expecting numeric in D38363 / R38363C4: got 'n.a.'
## Warning: Expecting numeric in D38364 / R38364C4: got 'n.a.'
## Warning: Expecting numeric in D38365 / R38365C4: got 'n.a.'
## Warning: Expecting numeric in D38366 / R38366C4: got 'n.a.'
## Warning: Expecting numeric in D38367 / R38367C4: got 'n.a.'
## Warning: Expecting numeric in D38368 / R38368C4: got 'n.a.'
## Warning: Expecting numeric in D38369 / R38369C4: got 'n.a.'
## Warning: Expecting numeric in D38370 / R38370C4: got 'n.a.'
## Warning: Expecting numeric in D38371 / R38371C4: got 'n.a.'
## Warning: Expecting numeric in D38372 / R38372C4: got 'n.a.'
## Warning: Expecting numeric in D38373 / R38373C4: got 'n.a.'
## Warning: Expecting numeric in D38374 / R38374C4: got 'n.a.'
## Warning: Expecting numeric in D38375 / R38375C4: got 'n.a.'
## Warning: Expecting numeric in D38376 / R38376C4: got 'n.a.'
## Warning: Expecting numeric in D38377 / R38377C4: got 'n.a.'
## Warning: Expecting numeric in D38378 / R38378C4: got 'n.a.'
## Warning: Expecting numeric in D38379 / R38379C4: got 'n.a.'
## Warning: Expecting numeric in D38380 / R38380C4: got 'n.a.'
## Warning: Expecting numeric in D38381 / R38381C4: got 'n.a.'
## Warning: Expecting numeric in D38382 / R38382C4: got 'n.a.'
## Warning: Expecting numeric in D38383 / R38383C4: got 'n.a.'
## Warning: Expecting numeric in D38384 / R38384C4: got 'n.a.'
## Warning: Expecting numeric in D38385 / R38385C4: got 'n.a.'
## Warning: Expecting numeric in D38386 / R38386C4: got 'n.a.'
## Warning: Expecting numeric in D38387 / R38387C4: got 'n.a.'
## Warning: Expecting numeric in D38388 / R38388C4: got 'n.a.'
## Warning: Expecting numeric in D38389 / R38389C4: got 'n.a.'
## Warning: Expecting numeric in D38390 / R38390C4: got 'n.a.'
## Warning: Expecting numeric in D38391 / R38391C4: got 'n.a.'
## Warning: Expecting numeric in D38392 / R38392C4: got 'n.a.'
## Warning: Expecting numeric in D38393 / R38393C4: got 'n.a.'
## Warning: Expecting numeric in D38394 / R38394C4: got 'n.a.'
## Warning: Expecting numeric in D38395 / R38395C4: got 'n.a.'
## Warning: Expecting numeric in D38396 / R38396C4: got 'n.a.'
## Warning: Expecting numeric in D38397 / R38397C4: got 'n.a.'
## Warning: Expecting numeric in D38398 / R38398C4: got 'n.a.'
## Warning: Expecting numeric in D38399 / R38399C4: got 'n.a.'
## Warning: Expecting numeric in D38400 / R38400C4: got 'n.a.'
## Warning: Expecting numeric in D38401 / R38401C4: got 'n.a.'
## Warning: Expecting numeric in D38402 / R38402C4: got 'n.a.'
## Warning: Expecting numeric in D38403 / R38403C4: got 'n.a.'
## Warning: Expecting numeric in D38404 / R38404C4: got 'n.a.'
## Warning: Expecting numeric in D38405 / R38405C4: got 'n.a.'
## Warning: Expecting numeric in D38406 / R38406C4: got 'n.a.'
## Warning: Expecting numeric in D38407 / R38407C4: got 'n.a.'
## Warning: Expecting numeric in D38408 / R38408C4: got 'n.a.'
## Warning: Expecting numeric in D38409 / R38409C4: got 'n.a.'
## Warning: Expecting numeric in D38410 / R38410C4: got 'n.a.'
## Warning: Expecting numeric in D38411 / R38411C4: got 'n.a.'
## Warning: Expecting numeric in D38412 / R38412C4: got 'n.a.'
## Warning: Expecting numeric in D38413 / R38413C4: got 'n.a.'
## Warning: Expecting numeric in D38414 / R38414C4: got 'n.a.'
## Warning: Expecting numeric in D38415 / R38415C4: got 'n.a.'
## Warning: Expecting numeric in D38416 / R38416C4: got 'n.a.'
## Warning: Expecting numeric in D38417 / R38417C4: got 'n.a.'
## Warning: Expecting numeric in D38418 / R38418C4: got 'n.a.'
## Warning: Expecting numeric in D38419 / R38419C4: got 'n.a.'
## Warning: Expecting numeric in D38420 / R38420C4: got 'n.a.'
## Warning: Expecting numeric in D38421 / R38421C4: got 'n.a.'
## Warning: Expecting numeric in D38422 / R38422C4: got 'n.a.'
## Warning: Expecting numeric in D38423 / R38423C4: got 'n.a.'
## Warning: Expecting numeric in D38424 / R38424C4: got 'n.a.'
## Warning: Expecting numeric in D38425 / R38425C4: got 'n.a.'
## Warning: Expecting numeric in D38426 / R38426C4: got 'n.a.'
## Warning: Expecting numeric in D38427 / R38427C4: got 'n.a.'
## Warning: Expecting numeric in D38428 / R38428C4: got 'n.a.'
## Warning: Expecting numeric in D38429 / R38429C4: got 'n.a.'
## Warning: Expecting numeric in D38430 / R38430C4: got 'n.a.'
## Warning: Expecting numeric in D38431 / R38431C4: got 'n.a.'
## Warning: Expecting numeric in D38432 / R38432C4: got 'n.a.'
## Warning: Expecting numeric in D38433 / R38433C4: got 'n.a.'
## Warning: Expecting numeric in D38434 / R38434C4: got 'n.a.'
## Warning: Expecting numeric in D38435 / R38435C4: got 'n.a.'
## Warning: Expecting numeric in D38436 / R38436C4: got 'n.a.'
## Warning: Expecting numeric in D38437 / R38437C4: got 'n.a.'
## Warning: Expecting numeric in D38438 / R38438C4: got 'n.a.'
## Warning: Expecting numeric in D38439 / R38439C4: got 'n.a.'
## Warning: Expecting numeric in D38440 / R38440C4: got 'n.a.'
## Warning: Expecting numeric in D38441 / R38441C4: got 'n.a.'
## Warning: Expecting numeric in D38442 / R38442C4: got 'n.a.'
## Warning: Expecting numeric in D38443 / R38443C4: got 'n.a.'
## Warning: Expecting numeric in D38444 / R38444C4: got 'n.a.'
## Warning: Expecting numeric in D38445 / R38445C4: got 'n.a.'
## Warning: Expecting numeric in D38446 / R38446C4: got 'n.a.'
## Warning: Expecting numeric in D38447 / R38447C4: got 'n.a.'
## Warning: Expecting numeric in D38448 / R38448C4: got 'n.a.'
## Warning: Expecting numeric in D38449 / R38449C4: got 'n.a.'
## Warning: Expecting numeric in D38450 / R38450C4: got 'n.a.'
## Warning: Expecting numeric in D38451 / R38451C4: got 'n.a.'
## Warning: Expecting numeric in D38452 / R38452C4: got 'n.a.'
## Warning: Expecting numeric in D38453 / R38453C4: got 'n.a.'
## Warning: Expecting numeric in D38454 / R38454C4: got 'n.a.'
## Warning: Expecting numeric in D38455 / R38455C4: got 'n.a.'
## Warning: Expecting numeric in D38456 / R38456C4: got 'n.a.'
## Warning: Expecting numeric in D38457 / R38457C4: got 'n.a.'
## Warning: Expecting numeric in D38458 / R38458C4: got 'n.a.'
## Warning: Expecting numeric in D38459 / R38459C4: got 'n.a.'
## Warning: Expecting numeric in D38460 / R38460C4: got 'n.a.'
## Warning: Expecting numeric in D38461 / R38461C4: got 'n.a.'
## Warning: Expecting numeric in D38462 / R38462C4: got 'n.a.'
## Warning: Expecting numeric in D38463 / R38463C4: got 'n.a.'
## Warning: Expecting numeric in D38464 / R38464C4: got 'n.a.'
## Warning: Expecting numeric in D38465 / R38465C4: got 'n.a.'
## Warning: Expecting numeric in D38466 / R38466C4: got 'n.a.'
## Warning: Expecting numeric in D38467 / R38467C4: got 'n.a.'
## Warning: Expecting numeric in D38468 / R38468C4: got 'n.a.'
## Warning: Expecting numeric in D38469 / R38469C4: got 'n.a.'
## Warning: Expecting numeric in D38470 / R38470C4: got 'n.a.'
## Warning: Expecting numeric in D38471 / R38471C4: got 'n.a.'
## Warning: Expecting numeric in D38472 / R38472C4: got 'n.a.'
## Warning: Expecting numeric in D38473 / R38473C4: got 'n.a.'
## Warning: Expecting numeric in D38474 / R38474C4: got 'n.a.'
## Warning: Expecting numeric in D38475 / R38475C4: got 'n.a.'
## Warning: Expecting numeric in D38476 / R38476C4: got 'n.a.'
## Warning: Expecting numeric in D38477 / R38477C4: got 'n.a.'
## Warning: Expecting numeric in D38478 / R38478C4: got 'n.a.'
## Warning: Expecting numeric in D38479 / R38479C4: got 'n.a.'
## Warning: Expecting numeric in D38480 / R38480C4: got 'n.a.'
## Warning: Expecting numeric in D38481 / R38481C4: got 'n.a.'
## Warning: Expecting numeric in D38482 / R38482C4: got 'n.a.'
## Warning: Expecting numeric in D38483 / R38483C4: got 'n.a.'
## Warning: Expecting numeric in D38484 / R38484C4: got 'n.a.'
## Warning: Expecting numeric in D38485 / R38485C4: got 'n.a.'
## Warning: Expecting numeric in D38486 / R38486C4: got 'n.a.'
## Warning: Expecting numeric in D38487 / R38487C4: got 'n.a.'
## Warning: Expecting numeric in D38488 / R38488C4: got 'n.a.'
## Warning: Expecting numeric in D38489 / R38489C4: got 'n.a.'
## Warning: Expecting numeric in D38490 / R38490C4: got 'n.a.'
## Warning: Expecting numeric in D38491 / R38491C4: got 'n.a.'
## Warning: Expecting numeric in D38492 / R38492C4: got 'n.a.'
## Warning: Expecting numeric in D38493 / R38493C4: got 'n.a.'
## Warning: Expecting numeric in D38494 / R38494C4: got 'n.a.'
## Warning: Expecting numeric in D38495 / R38495C4: got 'n.a.'
## Warning: Expecting numeric in D38496 / R38496C4: got 'n.a.'
## Warning: Expecting numeric in D38497 / R38497C4: got 'n.a.'
## Warning: Expecting numeric in D38498 / R38498C4: got 'n.a.'
## Warning: Expecting numeric in D38499 / R38499C4: got 'n.a.'
## Warning: Expecting numeric in D38500 / R38500C4: got 'n.a.'
## Warning: Expecting numeric in D38501 / R38501C4: got 'n.a.'
## Warning: Expecting numeric in D38502 / R38502C4: got 'n.a.'
## Warning: Expecting numeric in D38503 / R38503C4: got 'n.a.'
## Warning: Expecting numeric in D38504 / R38504C4: got 'n.a.'
## Warning: Expecting numeric in D38505 / R38505C4: got 'n.a.'
## Warning: Expecting numeric in D38506 / R38506C4: got 'n.a.'
## Warning: Expecting numeric in D38507 / R38507C4: got 'n.a.'
## Warning: Expecting numeric in D38508 / R38508C4: got 'n.a.'
## Warning: Expecting numeric in D38509 / R38509C4: got 'n.a.'
## Warning: Expecting numeric in D38510 / R38510C4: got 'n.a.'
## Warning: Expecting numeric in D38511 / R38511C4: got 'n.a.'
## Warning: Expecting numeric in D38512 / R38512C4: got 'n.a.'
## Warning: Expecting numeric in D38513 / R38513C4: got 'n.a.'
## Warning: Expecting numeric in D38514 / R38514C4: got 'n.a.'
## Warning: Expecting numeric in D38515 / R38515C4: got 'n.a.'
## Warning: Expecting numeric in D38516 / R38516C4: got 'n.a.'
## Warning: Expecting numeric in D38517 / R38517C4: got 'n.a.'
## Warning: Expecting numeric in D38518 / R38518C4: got 'n.a.'
## Warning: Expecting numeric in D38519 / R38519C4: got 'n.a.'
## Warning: Expecting numeric in D38520 / R38520C4: got 'n.a.'
## Warning: Expecting numeric in D38521 / R38521C4: got 'n.a.'
## Warning: Expecting numeric in D38522 / R38522C4: got 'n.a.'
## Warning: Expecting numeric in D38523 / R38523C4: got 'n.a.'
## Warning: Expecting numeric in D38524 / R38524C4: got 'n.a.'
## Warning: Expecting numeric in D38525 / R38525C4: got 'n.a.'
## Warning: Expecting numeric in D38526 / R38526C4: got 'n.a.'
## Warning: Expecting numeric in D38527 / R38527C4: got 'n.a.'
## Warning: Expecting numeric in D38528 / R38528C4: got 'n.a.'
## Warning: Expecting numeric in D38529 / R38529C4: got 'n.a.'
## Warning: Expecting numeric in D38530 / R38530C4: got 'n.a.'
## Warning: Expecting numeric in D38531 / R38531C4: got 'n.a.'
## Warning: Expecting numeric in D38532 / R38532C4: got 'n.a.'
## Warning: Expecting numeric in D38533 / R38533C4: got 'n.a.'
## Warning: Expecting numeric in D38534 / R38534C4: got 'n.a.'
## Warning: Expecting numeric in D38535 / R38535C4: got 'n.a.'
## Warning: Expecting numeric in D38536 / R38536C4: got 'n.a.'
## Warning: Expecting numeric in D38537 / R38537C4: got 'n.a.'
## Warning: Expecting numeric in D38538 / R38538C4: got 'n.a.'
## Warning: Expecting numeric in D38539 / R38539C4: got 'n.a.'
## Warning: Expecting numeric in D38540 / R38540C4: got 'n.a.'
## Warning: Expecting numeric in D38541 / R38541C4: got 'n.a.'
## Warning: Expecting numeric in D38542 / R38542C4: got 'n.a.'
## Warning: Expecting numeric in D38543 / R38543C4: got 'n.a.'
## Warning: Expecting numeric in D38544 / R38544C4: got 'n.a.'
## Warning: Expecting numeric in D38545 / R38545C4: got 'n.a.'
## Warning: Expecting numeric in D38546 / R38546C4: got 'n.a.'
## Warning: Expecting numeric in D38547 / R38547C4: got 'n.a.'
## Warning: Expecting numeric in D38548 / R38548C4: got 'n.a.'
## Warning: Expecting numeric in D38549 / R38549C4: got 'n.a.'
## Warning: Expecting numeric in D38550 / R38550C4: got 'n.a.'
## Warning: Expecting numeric in D38551 / R38551C4: got 'n.a.'
## Warning: Expecting numeric in D38552 / R38552C4: got 'n.a.'
## Warning: Expecting numeric in D38553 / R38553C4: got 'n.a.'
## Warning: Expecting numeric in D38554 / R38554C4: got 'n.a.'
## Warning: Expecting numeric in D38555 / R38555C4: got 'n.a.'
## Warning: Expecting numeric in D38556 / R38556C4: got 'n.a.'
## Warning: Expecting numeric in D38557 / R38557C4: got 'n.a.'
## Warning: Expecting numeric in D38558 / R38558C4: got 'n.a.'
## Warning: Expecting numeric in D38559 / R38559C4: got 'n.a.'
## Warning: Expecting numeric in D38560 / R38560C4: got 'n.a.'
## Warning: Expecting numeric in D38561 / R38561C4: got 'n.a.'
## Warning: Expecting numeric in D38562 / R38562C4: got 'n.a.'
## Warning: Expecting numeric in D38563 / R38563C4: got 'n.a.'
## Warning: Expecting numeric in D38564 / R38564C4: got 'n.a.'
## Warning: Expecting numeric in D38565 / R38565C4: got 'n.a.'
## Warning: Expecting numeric in D38566 / R38566C4: got 'n.a.'
## Warning: Expecting numeric in D38567 / R38567C4: got 'n.a.'
## Warning: Expecting numeric in D38568 / R38568C4: got 'n.a.'
## Warning: Expecting numeric in D38569 / R38569C4: got 'n.a.'
## Warning: Expecting numeric in D38570 / R38570C4: got 'n.a.'
## Warning: Expecting numeric in D38571 / R38571C4: got 'n.a.'
## Warning: Expecting numeric in D38572 / R38572C4: got 'n.a.'
## Warning: Expecting numeric in D38573 / R38573C4: got 'n.a.'
## Warning: Expecting numeric in D38574 / R38574C4: got 'n.a.'
## Warning: Expecting numeric in D38575 / R38575C4: got 'n.a.'
## Warning: Expecting numeric in D38576 / R38576C4: got 'n.a.'
## Warning: Expecting numeric in D38577 / R38577C4: got 'n.a.'
## Warning: Expecting numeric in D38578 / R38578C4: got 'n.a.'
## Warning: Expecting numeric in D38579 / R38579C4: got 'n.a.'
## Warning: Expecting numeric in D38580 / R38580C4: got 'n.a.'
## Warning: Expecting numeric in D38581 / R38581C4: got 'n.a.'
## Warning: Expecting numeric in D38582 / R38582C4: got 'n.a.'
## Warning: Expecting numeric in D38583 / R38583C4: got 'n.a.'
## Warning: Expecting numeric in D38584 / R38584C4: got 'n.a.'
## Warning: Expecting numeric in D38585 / R38585C4: got 'n.a.'
## Warning: Expecting numeric in D38586 / R38586C4: got 'n.a.'
## Warning: Expecting numeric in D38587 / R38587C4: got 'n.a.'
## Warning: Expecting numeric in D38588 / R38588C4: got 'n.a.'
## Warning: Expecting numeric in D38589 / R38589C4: got 'n.a.'
## Warning: Expecting numeric in D38590 / R38590C4: got 'n.a.'
## Warning: Expecting numeric in D38591 / R38591C4: got 'n.a.'
## Warning: Expecting numeric in D38592 / R38592C4: got 'n.a.'
## Warning: Expecting numeric in D38593 / R38593C4: got 'n.a.'
## Warning: Expecting numeric in D38594 / R38594C4: got 'n.a.'
## Warning: Expecting numeric in D38595 / R38595C4: got 'n.a.'
## Warning: Expecting numeric in D38596 / R38596C4: got 'n.a.'
## Warning: Expecting numeric in D38597 / R38597C4: got 'n.a.'
## Warning: Expecting numeric in D38598 / R38598C4: got 'n.a.'
## Warning: Expecting numeric in D38599 / R38599C4: got 'n.a.'
## Warning: Expecting numeric in D38600 / R38600C4: got 'n.a.'
## Warning: Expecting numeric in D38601 / R38601C4: got 'n.a.'
## Warning: Expecting numeric in D38602 / R38602C4: got 'n.a.'
## Warning: Expecting numeric in D38603 / R38603C4: got 'n.a.'
## Warning: Expecting numeric in D38604 / R38604C4: got 'n.a.'
## Warning: Expecting numeric in D38605 / R38605C4: got 'n.a.'
## Warning: Expecting numeric in D38606 / R38606C4: got 'n.a.'
## Warning: Expecting numeric in D38607 / R38607C4: got 'n.a.'
## Warning: Expecting numeric in D38608 / R38608C4: got 'n.a.'
## Warning: Expecting numeric in D38609 / R38609C4: got 'n.a.'
## Warning: Expecting numeric in D38610 / R38610C4: got 'n.a.'
## Warning: Expecting numeric in D38611 / R38611C4: got 'n.a.'
## Warning: Expecting numeric in D38612 / R38612C4: got 'n.a.'
## Warning: Expecting numeric in D38613 / R38613C4: got 'n.a.'
## Warning: Expecting numeric in D38614 / R38614C4: got 'n.a.'
## Warning: Expecting numeric in D38615 / R38615C4: got 'n.a.'
## Warning: Expecting numeric in D38616 / R38616C4: got 'n.a.'
## Warning: Expecting numeric in D38617 / R38617C4: got 'n.a.'
## Warning: Expecting numeric in D38618 / R38618C4: got 'n.a.'
## Warning: Expecting numeric in D38619 / R38619C4: got 'n.a.'
## Warning: Expecting numeric in D38620 / R38620C4: got 'n.a.'
## Warning: Expecting numeric in D38621 / R38621C4: got 'n.a.'
## Warning: Expecting numeric in D38622 / R38622C4: got 'n.a.'
## Warning: Expecting numeric in D38623 / R38623C4: got 'n.a.'
## Warning: Expecting numeric in D38624 / R38624C4: got 'n.a.'
## Warning: Expecting numeric in D38625 / R38625C4: got 'n.a.'
## Warning: Expecting numeric in D38626 / R38626C4: got 'n.a.'
## Warning: Expecting numeric in D38627 / R38627C4: got 'n.a.'
## Warning: Expecting numeric in D38628 / R38628C4: got 'n.a.'
## Warning: Expecting numeric in D38629 / R38629C4: got 'n.a.'
## Warning: Expecting numeric in D38630 / R38630C4: got 'n.a.'
## Warning: Expecting numeric in D38631 / R38631C4: got 'n.a.'
## Warning: Expecting numeric in D38632 / R38632C4: got 'n.a.'
## Warning: Expecting numeric in D38633 / R38633C4: got 'n.a.'
## Warning: Expecting numeric in D38634 / R38634C4: got 'n.a.'
## Warning: Expecting numeric in D38635 / R38635C4: got 'n.a.'
## Warning: Expecting numeric in D38636 / R38636C4: got 'n.a.'
## Warning: Expecting numeric in D38637 / R38637C4: got 'n.a.'
## Warning: Expecting numeric in D38638 / R38638C4: got 'n.a.'
## Warning: Expecting numeric in D38639 / R38639C4: got 'n.a.'
## Warning: Expecting numeric in D38640 / R38640C4: got 'n.a.'
## Warning: Expecting numeric in D38641 / R38641C4: got 'n.a.'
## Warning: Expecting numeric in D38642 / R38642C4: got 'n.a.'
## Warning: Expecting numeric in D38643 / R38643C4: got 'n.a.'
## Warning: Expecting numeric in D38644 / R38644C4: got 'n.a.'
## Warning: Expecting numeric in D38645 / R38645C4: got 'n.a.'
## Warning: Expecting numeric in D38646 / R38646C4: got 'n.a.'
## Warning: Expecting numeric in D38647 / R38647C4: got 'n.a.'
## Warning: Expecting numeric in D38648 / R38648C4: got 'n.a.'
## Warning: Expecting numeric in D38649 / R38649C4: got 'n.a.'
## Warning: Expecting numeric in D38650 / R38650C4: got 'n.a.'
## Warning: Expecting numeric in D38651 / R38651C4: got 'n.a.'
## Warning: Expecting numeric in D38652 / R38652C4: got 'n.a.'
## Warning: Expecting numeric in D38653 / R38653C4: got 'n.a.'
## Warning: Expecting numeric in D38654 / R38654C4: got 'n.a.'
## Warning: Expecting numeric in D38655 / R38655C4: got 'n.a.'
## Warning: Expecting numeric in D38656 / R38656C4: got 'n.a.'
## Warning: Expecting numeric in D38657 / R38657C4: got 'n.a.'
## Warning: Expecting numeric in D38658 / R38658C4: got 'n.a.'
## Warning: Expecting numeric in D38659 / R38659C4: got 'n.a.'
## Warning: Expecting numeric in D38660 / R38660C4: got 'n.a.'
## Warning: Expecting numeric in D38661 / R38661C4: got 'n.a.'
## Warning: Expecting numeric in D38662 / R38662C4: got 'n.a.'
## Warning: Expecting numeric in D38663 / R38663C4: got 'n.a.'
## Warning: Expecting numeric in D38664 / R38664C4: got 'n.a.'
## Warning: Expecting numeric in D38665 / R38665C4: got 'n.a.'
## Warning: Expecting numeric in D38666 / R38666C4: got 'n.a.'
## Warning: Expecting numeric in D38667 / R38667C4: got 'n.a.'
## Warning: Expecting numeric in D38668 / R38668C4: got 'n.a.'
## Warning: Expecting numeric in D38669 / R38669C4: got 'n.a.'
## Warning: Expecting numeric in D38670 / R38670C4: got 'n.a.'
## Warning: Expecting numeric in D38671 / R38671C4: got 'n.a.'
## Warning: Expecting numeric in D38672 / R38672C4: got 'n.a.'
## Warning: Expecting numeric in D38673 / R38673C4: got 'n.a.'
## Warning: Expecting numeric in D38674 / R38674C4: got 'n.a.'
## Warning: Expecting numeric in D38675 / R38675C4: got 'n.a.'
## Warning: Expecting numeric in D38676 / R38676C4: got 'n.a.'
## Warning: Expecting numeric in D38677 / R38677C4: got 'n.a.'
## Warning: Expecting numeric in D38678 / R38678C4: got 'n.a.'
## Warning: Expecting numeric in D38679 / R38679C4: got 'n.a.'
## Warning: Expecting numeric in D38680 / R38680C4: got 'n.a.'
## Warning: Expecting numeric in D38681 / R38681C4: got 'n.a.'
## Warning: Expecting numeric in D38682 / R38682C4: got 'n.a.'
## Warning: Expecting numeric in D38683 / R38683C4: got 'n.a.'
## Warning: Expecting numeric in D38684 / R38684C4: got 'n.a.'
## Warning: Expecting numeric in D38685 / R38685C4: got 'n.a.'
## Warning: Expecting numeric in D38686 / R38686C4: got 'n.a.'
## Warning: Expecting numeric in D38687 / R38687C4: got 'n.a.'
## Warning: Expecting numeric in D38688 / R38688C4: got 'n.a.'
## Warning: Expecting numeric in D38689 / R38689C4: got 'n.a.'
## Warning: Expecting numeric in D38690 / R38690C4: got 'n.a.'
## Warning: Expecting numeric in D38691 / R38691C4: got 'n.a.'
## Warning: Expecting numeric in D38692 / R38692C4: got 'n.a.'
## Warning: Expecting numeric in D38693 / R38693C4: got 'n.a.'
## Warning: Expecting numeric in D38694 / R38694C4: got 'n.a.'
## Warning: Expecting numeric in D38695 / R38695C4: got 'n.a.'
## Warning: Expecting numeric in D38696 / R38696C4: got 'n.a.'
## Warning: Expecting numeric in D38697 / R38697C4: got 'n.a.'
## Warning: Expecting numeric in D38698 / R38698C4: got 'n.a.'
## Warning: Expecting numeric in D38699 / R38699C4: got 'n.a.'
## Warning: Expecting numeric in D38700 / R38700C4: got 'n.a.'
## Warning: Expecting numeric in D38701 / R38701C4: got 'n.a.'
## Warning: Expecting numeric in D38702 / R38702C4: got 'n.a.'
## Warning: Expecting numeric in D38703 / R38703C4: got 'n.a.'
## Warning: Expecting numeric in D38704 / R38704C4: got 'n.a.'
## Warning: Expecting numeric in D38705 / R38705C4: got 'n.a.'
## Warning: Expecting numeric in D38706 / R38706C4: got 'n.a.'
## Warning: Expecting numeric in D38707 / R38707C4: got 'n.a.'
## Warning: Expecting numeric in D38708 / R38708C4: got 'n.a.'
## Warning: Expecting numeric in D38709 / R38709C4: got 'n.a.'
## Warning: Expecting numeric in D38710 / R38710C4: got 'n.a.'
## Warning: Expecting numeric in D38711 / R38711C4: got 'n.a.'
## Warning: Expecting numeric in D38712 / R38712C4: got 'n.a.'
## Warning: Expecting numeric in D38713 / R38713C4: got 'n.a.'
## Warning: Expecting numeric in D38714 / R38714C4: got 'n.a.'
## Warning: Expecting numeric in D38715 / R38715C4: got 'n.a.'
## Warning: Expecting numeric in D38716 / R38716C4: got 'n.a.'
## Warning: Expecting numeric in D38717 / R38717C4: got 'n.a.'
## Warning: Expecting numeric in D38718 / R38718C4: got 'n.a.'
## Warning: Expecting numeric in D38719 / R38719C4: got 'n.a.'
## Warning: Expecting numeric in D38720 / R38720C4: got 'n.a.'
## Warning: Expecting numeric in D38721 / R38721C4: got 'n.a.'
## Warning: Expecting numeric in D38722 / R38722C4: got 'n.a.'
## Warning: Expecting numeric in D38723 / R38723C4: got 'n.a.'
## Warning: Expecting numeric in D38724 / R38724C4: got 'n.a.'
## Warning: Expecting numeric in D38725 / R38725C4: got 'n.a.'
## Warning: Expecting numeric in D38726 / R38726C4: got 'n.a.'
## Warning: Expecting numeric in D38727 / R38727C4: got 'n.a.'
## Warning: Expecting numeric in D38728 / R38728C4: got 'n.a.'
## Warning: Expecting numeric in D38729 / R38729C4: got 'n.a.'
## Warning: Expecting numeric in D38730 / R38730C4: got 'n.a.'
## Warning: Expecting numeric in D38731 / R38731C4: got 'n.a.'
## Warning: Expecting numeric in D38732 / R38732C4: got 'n.a.'
## Warning: Expecting numeric in D38733 / R38733C4: got 'n.a.'
## Warning: Expecting numeric in D38734 / R38734C4: got 'n.a.'
## Warning: Expecting numeric in D38735 / R38735C4: got 'n.a.'
## Warning: Expecting numeric in D38736 / R38736C4: got 'n.a.'
## Warning: Expecting numeric in D38737 / R38737C4: got 'n.a.'
## Warning: Expecting numeric in D38738 / R38738C4: got 'n.a.'
## Warning: Expecting numeric in D38739 / R38739C4: got 'n.a.'
## Warning: Expecting numeric in D38740 / R38740C4: got 'n.a.'
## Warning: Expecting numeric in D38741 / R38741C4: got 'n.a.'
## Warning: Expecting numeric in D38742 / R38742C4: got 'n.a.'
## Warning: Expecting numeric in D38743 / R38743C4: got 'n.a.'
## Warning: Expecting numeric in D38744 / R38744C4: got 'n.a.'
## Warning: Expecting numeric in D38745 / R38745C4: got 'n.a.'
## Warning: Expecting numeric in D38746 / R38746C4: got 'n.a.'
## Warning: Expecting numeric in D38747 / R38747C4: got 'n.a.'
## Warning: Expecting numeric in D38748 / R38748C4: got 'n.a.'
## Warning: Expecting numeric in D38749 / R38749C4: got 'n.a.'
## Warning: Expecting numeric in D38750 / R38750C4: got 'n.a.'
## Warning: Expecting numeric in D38751 / R38751C4: got 'n.a.'
## Warning: Expecting numeric in D38752 / R38752C4: got 'n.a.'
## Warning: Expecting numeric in D38753 / R38753C4: got 'n.a.'
## Warning: Expecting numeric in D38754 / R38754C4: got 'n.a.'
## Warning: Expecting numeric in D38755 / R38755C4: got 'n.a.'
## Warning: Expecting numeric in D38756 / R38756C4: got 'n.a.'
## Warning: Expecting numeric in D38757 / R38757C4: got 'n.a.'
## Warning: Expecting numeric in D38758 / R38758C4: got 'n.a.'
## Warning: Expecting numeric in D38759 / R38759C4: got 'n.a.'
## Warning: Expecting numeric in D38760 / R38760C4: got 'n.a.'
## Warning: Expecting numeric in D38761 / R38761C4: got 'n.a.'
## Warning: Expecting numeric in D38762 / R38762C4: got 'n.a.'
## Warning: Expecting numeric in D38763 / R38763C4: got 'n.a.'
## Warning: Expecting numeric in D38764 / R38764C4: got 'n.a.'
## Warning: Expecting numeric in D38765 / R38765C4: got 'n.a.'
## Warning: Expecting numeric in D38766 / R38766C4: got 'n.a.'
## Warning: Expecting numeric in D38767 / R38767C4: got 'n.a.'
## Warning: Expecting numeric in D38768 / R38768C4: got 'n.a.'
## Warning: Expecting numeric in D38769 / R38769C4: got 'n.a.'
## Warning: Expecting numeric in D38770 / R38770C4: got 'n.a.'
## Warning: Expecting numeric in D38771 / R38771C4: got 'n.a.'
## Warning: Expecting numeric in D38772 / R38772C4: got 'n.a.'
## Warning: Expecting numeric in D38773 / R38773C4: got 'n.a.'
## Warning: Expecting numeric in D38774 / R38774C4: got 'n.a.'
## Warning: Expecting numeric in D38775 / R38775C4: got 'n.a.'
## Warning: Expecting numeric in D38776 / R38776C4: got 'n.a.'
## Warning: Expecting numeric in D38777 / R38777C4: got 'n.a.'
## Warning: Expecting numeric in D38778 / R38778C4: got 'n.a.'
## Warning: Expecting numeric in D38779 / R38779C4: got 'n.a.'
## Warning: Expecting numeric in D38780 / R38780C4: got 'n.a.'
## Warning: Expecting numeric in D38781 / R38781C4: got 'n.a.'
## Warning: Expecting numeric in D38782 / R38782C4: got 'n.a.'
## Warning: Expecting numeric in D38783 / R38783C4: got 'n.a.'
## Warning: Expecting numeric in D38784 / R38784C4: got 'n.a.'
## Warning: Expecting numeric in D38785 / R38785C4: got 'n.a.'
## Warning: Expecting numeric in D38786 / R38786C4: got 'n.a.'
## Warning: Expecting numeric in D38787 / R38787C4: got 'n.a.'
## Warning: Expecting numeric in D38788 / R38788C4: got 'n.a.'
## Warning: Expecting numeric in D38789 / R38789C4: got 'n.a.'
## Warning: Expecting numeric in D38790 / R38790C4: got 'n.a.'
## Warning: Expecting numeric in D38791 / R38791C4: got 'n.a.'
## Warning: Expecting numeric in D38792 / R38792C4: got 'n.a.'
## Warning: Expecting numeric in D38793 / R38793C4: got 'n.a.'
## Warning: Expecting numeric in D38794 / R38794C4: got 'n.a.'
## Warning: Expecting numeric in D38795 / R38795C4: got 'n.a.'
## Warning: Expecting numeric in D38796 / R38796C4: got 'n.a.'
## Warning: Expecting numeric in D38797 / R38797C4: got 'n.a.'
## Warning: Expecting numeric in D38798 / R38798C4: got 'n.a.'
## Warning: Expecting numeric in D38799 / R38799C4: got 'n.a.'
## Warning: Expecting numeric in D38800 / R38800C4: got 'n.a.'
## Warning: Expecting numeric in D38801 / R38801C4: got 'n.a.'
## Warning: Expecting numeric in D38802 / R38802C4: got 'n.a.'
## Warning: Expecting numeric in D38803 / R38803C4: got 'n.a.'
## Warning: Expecting numeric in D38804 / R38804C4: got 'n.a.'
## Warning: Expecting numeric in D38805 / R38805C4: got 'n.a.'
## Warning: Expecting numeric in D38806 / R38806C4: got 'n.a.'
## Warning: Expecting numeric in D38807 / R38807C4: got 'n.a.'
## Warning: Expecting numeric in D38808 / R38808C4: got 'n.a.'
## Warning: Expecting numeric in D38809 / R38809C4: got 'n.a.'
## Warning: Expecting numeric in D38810 / R38810C4: got 'n.a.'
## Warning: Expecting numeric in D38811 / R38811C4: got 'n.a.'
## Warning: Expecting numeric in D38812 / R38812C4: got 'n.a.'
## Warning: Expecting numeric in D38813 / R38813C4: got 'n.a.'
## Warning: Expecting numeric in D38814 / R38814C4: got 'n.a.'
## Warning: Expecting numeric in D38815 / R38815C4: got 'n.a.'
## Warning: Expecting numeric in D38816 / R38816C4: got 'n.a.'
## Warning: Expecting numeric in D38817 / R38817C4: got 'n.a.'
## Warning: Expecting numeric in D38818 / R38818C4: got 'n.a.'
## Warning: Expecting numeric in D38819 / R38819C4: got 'n.a.'
## Warning: Expecting numeric in D38820 / R38820C4: got 'n.a.'
## Warning: Expecting numeric in D38821 / R38821C4: got 'n.a.'
## Warning: Expecting numeric in D38822 / R38822C4: got 'n.a.'
## Warning: Expecting numeric in D38823 / R38823C4: got 'n.a.'
## Warning: Expecting numeric in D38824 / R38824C4: got 'n.a.'
## Warning: Expecting numeric in D38825 / R38825C4: got 'n.a.'
## Warning: Expecting numeric in D38826 / R38826C4: got 'n.a.'
## Warning: Expecting numeric in D38827 / R38827C4: got 'n.a.'
## Warning: Expecting numeric in D38828 / R38828C4: got 'n.a.'
## Warning: Expecting numeric in D38829 / R38829C4: got 'n.a.'
## Warning: Expecting numeric in D38830 / R38830C4: got 'n.a.'
## Warning: Expecting numeric in D38831 / R38831C4: got 'n.a.'
## Warning: Expecting numeric in D38832 / R38832C4: got 'n.a.'
## Warning: Expecting numeric in D38833 / R38833C4: got 'n.a.'
## Warning: Expecting numeric in D38834 / R38834C4: got 'n.a.'
## Warning: Expecting numeric in D38835 / R38835C4: got 'n.a.'
## Warning: Expecting numeric in D38836 / R38836C4: got 'n.a.'
## Warning: Expecting numeric in D38837 / R38837C4: got 'n.a.'
## Warning: Expecting numeric in D38838 / R38838C4: got 'n.a.'
## Warning: Expecting numeric in D38839 / R38839C4: got 'n.a.'
## Warning: Expecting numeric in D38840 / R38840C4: got 'n.a.'
## Warning: Expecting numeric in D38841 / R38841C4: got 'n.a.'
## Warning: Expecting numeric in D38842 / R38842C4: got 'n.a.'
## Warning: Expecting numeric in D38843 / R38843C4: got 'n.a.'
## Warning: Expecting numeric in D38844 / R38844C4: got 'n.a.'
## Warning: Expecting numeric in D38845 / R38845C4: got 'n.a.'
## Warning: Expecting numeric in D38846 / R38846C4: got 'n.a.'
## Warning: Expecting numeric in D38847 / R38847C4: got 'n.a.'
## Warning: Expecting numeric in D38848 / R38848C4: got 'n.a.'
## Warning: Expecting numeric in D38849 / R38849C4: got 'n.a.'
## Warning: Expecting numeric in D38850 / R38850C4: got 'n.a.'
## Warning: Expecting numeric in D38851 / R38851C4: got 'n.a.'
## Warning: Expecting numeric in D38852 / R38852C4: got 'n.a.'
## Warning: Expecting numeric in D38853 / R38853C4: got 'n.a.'
## Warning: Expecting numeric in D38854 / R38854C4: got 'n.a.'
## Warning: Expecting numeric in D38855 / R38855C4: got 'n.a.'
## Warning: Expecting numeric in D38856 / R38856C4: got 'n.a.'
## Warning: Expecting numeric in D38857 / R38857C4: got 'n.a.'
## Warning: Expecting numeric in D38858 / R38858C4: got 'n.a.'
## Warning: Expecting numeric in D38859 / R38859C4: got 'n.a.'
## Warning: Expecting numeric in D38860 / R38860C4: got 'n.a.'
## Warning: Expecting numeric in D38861 / R38861C4: got 'n.a.'
## Warning: Expecting numeric in D38862 / R38862C4: got 'n.a.'
## Warning: Expecting numeric in D38863 / R38863C4: got 'n.a.'
## Warning: Expecting numeric in D38864 / R38864C4: got 'n.a.'
## Warning: Expecting numeric in D38865 / R38865C4: got 'n.a.'
## Warning: Expecting numeric in D38866 / R38866C4: got 'n.a.'
## Warning: Expecting numeric in D38867 / R38867C4: got 'n.a.'
## Warning: Expecting numeric in D38868 / R38868C4: got 'n.a.'
## Warning: Expecting numeric in D38869 / R38869C4: got 'n.a.'
## Warning: Expecting numeric in D38870 / R38870C4: got 'n.a.'
## Warning: Expecting numeric in D38871 / R38871C4: got 'n.a.'
## Warning: Expecting numeric in D38872 / R38872C4: got 'n.a.'
## Warning: Expecting numeric in D38873 / R38873C4: got 'n.a.'
## Warning: Expecting numeric in D38874 / R38874C4: got 'n.a.'
## Warning: Expecting numeric in D38875 / R38875C4: got 'n.a.'
## Warning: Expecting numeric in D38876 / R38876C4: got 'n.a.'
## Warning: Expecting numeric in D38877 / R38877C4: got 'n.a.'
## Warning: Expecting numeric in D38878 / R38878C4: got 'n.a.'
## Warning: Expecting numeric in D38879 / R38879C4: got 'n.a.'
## Warning: Expecting numeric in D38880 / R38880C4: got 'n.a.'
## Warning: Expecting numeric in D38881 / R38881C4: got 'n.a.'
## Warning: Expecting numeric in D38882 / R38882C4: got 'n.a.'
## Warning: Expecting numeric in D38883 / R38883C4: got 'n.a.'
## Warning: Expecting numeric in D38884 / R38884C4: got 'n.a.'
## Warning: Expecting numeric in D38885 / R38885C4: got 'n.a.'
## Warning: Expecting numeric in D38886 / R38886C4: got 'n.a.'
## Warning: Expecting numeric in D38887 / R38887C4: got 'n.a.'
## Warning: Expecting numeric in D38888 / R38888C4: got 'n.a.'
## Warning: Expecting numeric in D38889 / R38889C4: got 'n.a.'
## Warning: Expecting numeric in D38890 / R38890C4: got 'n.a.'
## Warning: Expecting numeric in D38891 / R38891C4: got 'n.a.'
## Warning: Expecting numeric in D38892 / R38892C4: got 'n.a.'
## Warning: Expecting numeric in D38893 / R38893C4: got 'n.a.'
## Warning: Expecting numeric in D38894 / R38894C4: got 'n.a.'
## Warning: Expecting numeric in D38895 / R38895C4: got 'n.a.'
## Warning: Expecting numeric in D38896 / R38896C4: got 'n.a.'
## Warning: Expecting numeric in D38897 / R38897C4: got 'n.a.'
## Warning: Expecting numeric in D38898 / R38898C4: got 'n.a.'
## Warning: Expecting numeric in D38899 / R38899C4: got 'n.a.'
## Warning: Expecting numeric in D38900 / R38900C4: got 'n.a.'
## Warning: Expecting numeric in D38901 / R38901C4: got 'n.a.'
## Warning: Expecting numeric in D38902 / R38902C4: got 'n.a.'
## Warning: Expecting numeric in D38903 / R38903C4: got 'n.a.'
## Warning: Expecting numeric in D38904 / R38904C4: got 'n.a.'
## Warning: Expecting numeric in D38905 / R38905C4: got 'n.a.'
## Warning: Expecting numeric in D38906 / R38906C4: got 'n.a.'
## Warning: Expecting numeric in D38907 / R38907C4: got 'n.a.'
## Warning: Expecting numeric in D38908 / R38908C4: got 'n.a.'
## Warning: Expecting numeric in D38909 / R38909C4: got 'n.a.'
## Warning: Expecting numeric in D38910 / R38910C4: got 'n.a.'
## Warning: Expecting numeric in D38911 / R38911C4: got 'n.a.'
## Warning: Expecting numeric in D38912 / R38912C4: got 'n.a.'
## Warning: Expecting numeric in D38913 / R38913C4: got 'n.a.'
## Warning: Expecting numeric in D38914 / R38914C4: got 'n.a.'
## Warning: Expecting numeric in D38915 / R38915C4: got 'n.a.'
## Warning: Expecting numeric in D38916 / R38916C4: got 'n.a.'
## Warning: Expecting numeric in D38917 / R38917C4: got 'n.a.'
## Warning: Expecting numeric in D38918 / R38918C4: got 'n.a.'
## Warning: Expecting numeric in D38919 / R38919C4: got 'n.a.'
## Warning: Expecting numeric in D38920 / R38920C4: got 'n.a.'
## Warning: Expecting numeric in D38921 / R38921C4: got 'n.a.'
## Warning: Expecting numeric in D38922 / R38922C4: got 'n.a.'
## Warning: Expecting numeric in D38923 / R38923C4: got 'n.a.'
## Warning: Expecting numeric in D38924 / R38924C4: got 'n.a.'
## Warning: Expecting numeric in D38925 / R38925C4: got 'n.a.'
## Warning: Expecting numeric in D38926 / R38926C4: got 'n.a.'
## Warning: Expecting numeric in D38927 / R38927C4: got 'n.a.'
## Warning: Expecting numeric in D38928 / R38928C4: got 'n.a.'
## Warning: Expecting numeric in D38929 / R38929C4: got 'n.a.'
## Warning: Expecting numeric in D38930 / R38930C4: got 'n.a.'
## Warning: Expecting numeric in D38931 / R38931C4: got 'n.a.'
## Warning: Expecting numeric in D38932 / R38932C4: got 'n.a.'
## Warning: Expecting numeric in D38933 / R38933C4: got 'n.a.'
## Warning: Expecting numeric in D38934 / R38934C4: got 'n.a.'
## Warning: Expecting numeric in D38935 / R38935C4: got 'n.a.'
## Warning: Expecting numeric in D38936 / R38936C4: got 'n.a.'
## Warning: Expecting numeric in D38937 / R38937C4: got 'n.a.'
## Warning: Expecting numeric in D38938 / R38938C4: got 'n.a.'
## Warning: Expecting numeric in D38939 / R38939C4: got 'n.a.'
## Warning: Expecting numeric in D38940 / R38940C4: got 'n.a.'
## Warning: Expecting numeric in D38941 / R38941C4: got 'n.a.'
## Warning: Expecting numeric in D38942 / R38942C4: got 'n.a.'
## Warning: Expecting numeric in D38943 / R38943C4: got 'n.a.'
## Warning: Expecting numeric in D38944 / R38944C4: got 'n.a.'
## Warning: Expecting numeric in D38945 / R38945C4: got 'n.a.'
## Warning: Expecting numeric in D38946 / R38946C4: got 'n.a.'
## Warning: Expecting numeric in D38947 / R38947C4: got 'n.a.'
## Warning: Expecting numeric in D38948 / R38948C4: got 'n.a.'
## Warning: Expecting numeric in D38949 / R38949C4: got 'n.a.'
## Warning: Expecting numeric in D38950 / R38950C4: got 'n.a.'
## Warning: Expecting numeric in D38951 / R38951C4: got 'n.a.'
## Warning: Expecting numeric in D38952 / R38952C4: got 'n.a.'
## Warning: Expecting numeric in D38953 / R38953C4: got 'n.a.'
## Warning: Expecting numeric in D38954 / R38954C4: got 'n.a.'
## Warning: Expecting numeric in D38955 / R38955C4: got 'n.a.'
## Warning: Expecting numeric in D38956 / R38956C4: got 'n.a.'
## Warning: Expecting numeric in D38957 / R38957C4: got 'n.a.'
## Warning: Expecting numeric in D38958 / R38958C4: got 'n.a.'
## Warning: Expecting numeric in D38959 / R38959C4: got 'n.a.'
## Warning: Expecting numeric in D38960 / R38960C4: got 'n.a.'
## Warning: Expecting numeric in D38961 / R38961C4: got 'n.a.'
## Warning: Expecting numeric in D38962 / R38962C4: got 'n.a.'
## Warning: Expecting numeric in D38963 / R38963C4: got 'n.a.'
## Warning: Expecting numeric in D38964 / R38964C4: got 'n.a.'
## Warning: Expecting numeric in D38965 / R38965C4: got 'n.a.'
## Warning: Expecting numeric in D38966 / R38966C4: got 'n.a.'
## Warning: Expecting numeric in D38967 / R38967C4: got 'n.a.'
## Warning: Expecting numeric in D38968 / R38968C4: got 'n.a.'
## Warning: Expecting numeric in D38969 / R38969C4: got 'n.a.'
## Warning: Expecting numeric in D38970 / R38970C4: got 'n.a.'
## Warning: Expecting numeric in D38971 / R38971C4: got 'n.a.'
## Warning: Expecting numeric in D38972 / R38972C4: got 'n.a.'
## Warning: Expecting numeric in D38973 / R38973C4: got 'n.a.'
## Warning: Expecting numeric in D38974 / R38974C4: got 'n.a.'
## Warning: Expecting numeric in D38975 / R38975C4: got 'n.a.'
## Warning: Expecting numeric in D38976 / R38976C4: got 'n.a.'
## Warning: Expecting numeric in D38977 / R38977C4: got 'n.a.'
## Warning: Expecting numeric in D38978 / R38978C4: got 'n.a.'
## Warning: Expecting numeric in D38979 / R38979C4: got 'n.a.'
## Warning: Expecting numeric in D38980 / R38980C4: got 'n.a.'
## Warning: Expecting numeric in D38981 / R38981C4: got 'n.a.'
## Warning: Expecting numeric in D38982 / R38982C4: got 'n.a.'
## Warning: Expecting numeric in D38983 / R38983C4: got 'n.a.'
## Warning: Expecting numeric in D38984 / R38984C4: got 'n.a.'
## Warning: Expecting numeric in D38985 / R38985C4: got 'n.a.'
## Warning: Expecting numeric in D38986 / R38986C4: got 'n.a.'
## Warning: Expecting numeric in D38987 / R38987C4: got 'n.a.'
## Warning: Expecting numeric in D38988 / R38988C4: got 'n.a.'
## Warning: Expecting numeric in D38989 / R38989C4: got 'n.a.'
## Warning: Expecting numeric in D38990 / R38990C4: got 'n.a.'
## Warning: Expecting numeric in D38991 / R38991C4: got 'n.a.'
## Warning: Expecting numeric in D38992 / R38992C4: got 'n.a.'
## Warning: Expecting numeric in D38993 / R38993C4: got 'n.a.'
## Warning: Expecting numeric in D38994 / R38994C4: got 'n.a.'
## Warning: Expecting numeric in D38995 / R38995C4: got 'n.a.'
## Warning: Expecting numeric in D38996 / R38996C4: got 'n.a.'
## Warning: Expecting numeric in D38997 / R38997C4: got 'n.a.'
## Warning: Expecting numeric in D38998 / R38998C4: got 'n.a.'
## Warning: Expecting numeric in D38999 / R38999C4: got 'n.a.'
## Warning: Expecting numeric in D39000 / R39000C4: got 'n.a.'
## Warning: Expecting numeric in D39001 / R39001C4: got 'n.a.'
## Warning: Expecting numeric in D39002 / R39002C4: got 'n.a.'
## Warning: Expecting numeric in D39003 / R39003C4: got 'n.a.'
## Warning: Expecting numeric in D39004 / R39004C4: got 'n.a.'
## Warning: Expecting numeric in D39005 / R39005C4: got 'n.a.'
## Warning: Expecting numeric in D39006 / R39006C4: got 'n.a.'
## Warning: Expecting numeric in D39007 / R39007C4: got 'n.a.'
## Warning: Expecting numeric in D39008 / R39008C4: got 'n.a.'
## Warning: Expecting numeric in D39009 / R39009C4: got 'n.a.'
## Warning: Expecting numeric in D39010 / R39010C4: got 'n.a.'
## Warning: Expecting numeric in D39011 / R39011C4: got 'n.a.'
## Warning: Expecting numeric in D39012 / R39012C4: got 'n.a.'
## Warning: Expecting numeric in D39013 / R39013C4: got 'n.a.'
## Warning: Expecting numeric in D39014 / R39014C4: got 'n.a.'
## Warning: Expecting numeric in D39015 / R39015C4: got 'n.a.'
## Warning: Expecting numeric in D39016 / R39016C4: got 'n.a.'
## Warning: Expecting numeric in D39017 / R39017C4: got 'n.a.'
## Warning: Expecting numeric in D39018 / R39018C4: got 'n.a.'
## Warning: Expecting numeric in D39019 / R39019C4: got 'n.a.'
## Warning: Expecting numeric in D39020 / R39020C4: got 'n.a.'
## Warning: Expecting numeric in D39021 / R39021C4: got 'n.a.'
## Warning: Expecting numeric in D39022 / R39022C4: got 'n.a.'
## Warning: Expecting numeric in D39023 / R39023C4: got 'n.a.'
## Warning: Expecting numeric in D39024 / R39024C4: got 'n.a.'
## Warning: Expecting numeric in D39025 / R39025C4: got 'n.a.'
## Warning: Expecting numeric in D39026 / R39026C4: got 'n.a.'
## Warning: Expecting numeric in D39027 / R39027C4: got 'n.a.'
## Warning: Expecting numeric in D39028 / R39028C4: got 'n.a.'
## Warning: Expecting numeric in D39029 / R39029C4: got 'n.a.'
## Warning: Expecting numeric in D39030 / R39030C4: got 'n.a.'
## Warning: Expecting numeric in D39031 / R39031C4: got 'n.a.'
## Warning: Expecting numeric in D39032 / R39032C4: got 'n.a.'
## Warning: Expecting numeric in D39033 / R39033C4: got 'n.a.'
## Warning: Expecting numeric in D39034 / R39034C4: got 'n.a.'
## Warning: Expecting numeric in D39035 / R39035C4: got 'n.a.'
## Warning: Expecting numeric in D39036 / R39036C4: got 'n.a.'
## Warning: Expecting numeric in D39037 / R39037C4: got 'n.a.'
## Warning: Expecting numeric in D39038 / R39038C4: got 'n.a.'
## Warning: Expecting numeric in D39039 / R39039C4: got 'n.a.'
## Warning: Expecting numeric in D39040 / R39040C4: got 'n.a.'
## Warning: Expecting numeric in D39041 / R39041C4: got 'n.a.'
## Warning: Expecting numeric in D39042 / R39042C4: got 'n.a.'
## Warning: Expecting numeric in D39043 / R39043C4: got 'n.a.'
## Warning: Expecting numeric in D39044 / R39044C4: got 'n.a.'
## Warning: Expecting numeric in D39045 / R39045C4: got 'n.a.'
## Warning: Expecting numeric in D39046 / R39046C4: got 'n.a.'
## Warning: Expecting numeric in D39047 / R39047C4: got 'n.a.'
## Warning: Expecting numeric in D39048 / R39048C4: got 'n.a.'
## Warning: Expecting numeric in D39049 / R39049C4: got 'n.a.'
## Warning: Expecting numeric in D39050 / R39050C4: got 'n.a.'
## Warning: Expecting numeric in D39051 / R39051C4: got 'n.a.'
## Warning: Expecting numeric in D39052 / R39052C4: got 'n.a.'
## Warning: Expecting numeric in D39053 / R39053C4: got 'n.a.'
## Warning: Expecting numeric in D39054 / R39054C4: got 'n.a.'
## Warning: Expecting numeric in D39055 / R39055C4: got 'n.a.'
## Warning: Expecting numeric in D39056 / R39056C4: got 'n.a.'
## Warning: Expecting numeric in D39057 / R39057C4: got 'n.a.'
## Warning: Expecting numeric in D39058 / R39058C4: got 'n.a.'
## Warning: Expecting numeric in D39059 / R39059C4: got 'n.a.'
## Warning: Expecting numeric in D39060 / R39060C4: got 'n.a.'
## Warning: Expecting numeric in D39061 / R39061C4: got 'n.a.'
## Warning: Expecting numeric in D39062 / R39062C4: got 'n.a.'
## Warning: Expecting numeric in D39063 / R39063C4: got 'n.a.'
## Warning: Expecting numeric in D39064 / R39064C4: got 'n.a.'
## Warning: Expecting numeric in D39065 / R39065C4: got 'n.a.'
## Warning: Expecting numeric in D39066 / R39066C4: got 'n.a.'
## Warning: Expecting numeric in D39067 / R39067C4: got 'n.a.'
## Warning: Expecting numeric in D39068 / R39068C4: got 'n.a.'
## Warning: Expecting numeric in D39069 / R39069C4: got 'n.a.'
## Warning: Expecting numeric in D39070 / R39070C4: got 'n.a.'
## Warning: Expecting numeric in D39071 / R39071C4: got 'n.a.'
## Warning: Expecting numeric in D39072 / R39072C4: got 'n.a.'
## Warning: Expecting numeric in D39073 / R39073C4: got 'n.a.'
## Warning: Expecting numeric in D39074 / R39074C4: got 'n.a.'
## Warning: Expecting numeric in D39075 / R39075C4: got 'n.a.'
## Warning: Expecting numeric in D39076 / R39076C4: got 'n.a.'
## Warning: Expecting numeric in D39077 / R39077C4: got 'n.a.'
## Warning: Expecting numeric in D39078 / R39078C4: got 'n.a.'
## Warning: Expecting numeric in D39079 / R39079C4: got 'n.a.'
## Warning: Expecting numeric in D39080 / R39080C4: got 'n.a.'
## Warning: Expecting numeric in D39081 / R39081C4: got 'n.a.'
## Warning: Expecting numeric in D39082 / R39082C4: got 'n.a.'
## Warning: Expecting numeric in D39083 / R39083C4: got 'n.a.'
## Warning: Expecting numeric in D39084 / R39084C4: got 'n.a.'
## Warning: Expecting numeric in D39085 / R39085C4: got 'n.a.'
## Warning: Expecting numeric in D39086 / R39086C4: got 'n.a.'
## Warning: Expecting numeric in D39087 / R39087C4: got 'n.a.'
## Warning: Expecting numeric in D39088 / R39088C4: got 'n.a.'
## Warning: Expecting numeric in D39089 / R39089C4: got 'n.a.'
## Warning: Expecting numeric in D39090 / R39090C4: got 'n.a.'
## Warning: Expecting numeric in D39091 / R39091C4: got 'n.a.'
## Warning: Expecting numeric in D39092 / R39092C4: got 'n.a.'
## Warning: Expecting numeric in D39093 / R39093C4: got 'n.a.'
## Warning: Expecting numeric in D39094 / R39094C4: got 'n.a.'
## Warning: Expecting numeric in D39095 / R39095C4: got 'n.a.'
## Warning: Expecting numeric in D39096 / R39096C4: got 'n.a.'
## Warning: Expecting numeric in D39097 / R39097C4: got 'n.a.'
## Warning: Expecting numeric in D39098 / R39098C4: got 'n.a.'
## Warning: Expecting numeric in D39099 / R39099C4: got 'n.a.'
## Warning: Expecting numeric in D39100 / R39100C4: got 'n.a.'
## Warning: Expecting numeric in D39101 / R39101C4: got 'n.a.'
## Warning: Expecting numeric in D39102 / R39102C4: got 'n.a.'
## Warning: Expecting numeric in D39103 / R39103C4: got 'n.a.'
## Warning: Expecting numeric in D39104 / R39104C4: got 'n.a.'
## Warning: Expecting numeric in D39105 / R39105C4: got 'n.a.'
## Warning: Expecting numeric in D39106 / R39106C4: got 'n.a.'
## Warning: Expecting numeric in D39107 / R39107C4: got 'n.a.'
## Warning: Expecting numeric in D39108 / R39108C4: got 'n.a.'
## Warning: Expecting numeric in D39109 / R39109C4: got 'n.a.'
## Warning: Expecting numeric in D39110 / R39110C4: got 'n.a.'
## Warning: Expecting numeric in D39111 / R39111C4: got 'n.a.'
## Warning: Expecting numeric in D39112 / R39112C4: got 'n.a.'
## Warning: Expecting numeric in D39113 / R39113C4: got 'n.a.'
## Warning: Expecting numeric in D39114 / R39114C4: got 'n.a.'
## Warning: Expecting numeric in D39115 / R39115C4: got 'n.a.'
## Warning: Expecting numeric in D39116 / R39116C4: got 'n.a.'
## Warning: Expecting numeric in D39117 / R39117C4: got 'n.a.'
## Warning: Expecting numeric in D39118 / R39118C4: got 'n.a.'
## Warning: Expecting numeric in D39119 / R39119C4: got 'n.a.'
## Warning: Expecting numeric in D39120 / R39120C4: got 'n.a.'
## Warning: Expecting numeric in D39121 / R39121C4: got 'n.a.'
## Warning: Expecting numeric in D39122 / R39122C4: got 'n.a.'
## Warning: Expecting numeric in D39123 / R39123C4: got 'n.a.'
## Warning: Expecting numeric in D39124 / R39124C4: got 'n.a.'
## Warning: Expecting numeric in D39125 / R39125C4: got 'n.a.'
## Warning: Expecting numeric in D39126 / R39126C4: got 'n.a.'
## Warning: Expecting numeric in D39127 / R39127C4: got 'n.a.'
## Warning: Expecting numeric in D39128 / R39128C4: got 'n.a.'
## Warning: Expecting numeric in D39129 / R39129C4: got 'n.a.'
## Warning: Expecting numeric in D39130 / R39130C4: got 'n.a.'
## Warning: Expecting numeric in D39131 / R39131C4: got 'n.a.'
## Warning: Expecting numeric in D39132 / R39132C4: got 'n.a.'
## Warning: Expecting numeric in D39133 / R39133C4: got 'n.a.'
## Warning: Expecting numeric in D39134 / R39134C4: got 'n.a.'
## Warning: Expecting numeric in D39135 / R39135C4: got 'n.a.'
## Warning: Expecting numeric in D39136 / R39136C4: got 'n.a.'
## Warning: Expecting numeric in D39137 / R39137C4: got 'n.a.'
## Warning: Expecting numeric in D39138 / R39138C4: got 'n.a.'
## Warning: Expecting numeric in D39139 / R39139C4: got 'n.a.'
## Warning: Expecting numeric in D39140 / R39140C4: got 'n.a.'
## Warning: Expecting numeric in D39141 / R39141C4: got 'n.a.'
## Warning: Expecting numeric in D39142 / R39142C4: got 'n.a.'
## Warning: Expecting numeric in D39143 / R39143C4: got 'n.a.'
## Warning: Expecting numeric in D39144 / R39144C4: got 'n.a.'
## Warning: Expecting numeric in D39145 / R39145C4: got 'n.a.'
## Warning: Expecting numeric in D39146 / R39146C4: got 'n.a.'
## Warning: Expecting numeric in D39147 / R39147C4: got 'n.a.'
## Warning: Expecting numeric in D39148 / R39148C4: got 'n.a.'
## Warning: Expecting numeric in D39149 / R39149C4: got 'n.a.'
## Warning: Expecting numeric in D39150 / R39150C4: got 'n.a.'
## Warning: Expecting numeric in D39151 / R39151C4: got 'n.a.'
## Warning: Expecting numeric in D39152 / R39152C4: got 'n.a.'
## Warning: Expecting numeric in D39153 / R39153C4: got 'n.a.'
## Warning: Expecting numeric in D39154 / R39154C4: got 'n.a.'
## Warning: Expecting numeric in D39155 / R39155C4: got 'n.a.'
## Warning: Expecting numeric in D39156 / R39156C4: got 'n.a.'
## Warning: Expecting numeric in D39157 / R39157C4: got 'n.a.'
## Warning: Expecting numeric in D39158 / R39158C4: got 'n.a.'
## Warning: Expecting numeric in D39159 / R39159C4: got 'n.a.'
## Warning: Expecting numeric in D39160 / R39160C4: got 'n.a.'
## Warning: Expecting numeric in D39161 / R39161C4: got 'n.a.'
## Warning: Expecting numeric in D39162 / R39162C4: got 'n.a.'
## Warning: Expecting numeric in D39163 / R39163C4: got 'n.a.'
## Warning: Expecting numeric in D39164 / R39164C4: got 'n.a.'
## Warning: Expecting numeric in D39165 / R39165C4: got 'n.a.'
## Warning: Expecting numeric in D39166 / R39166C4: got 'n.a.'
## Warning: Expecting numeric in D39167 / R39167C4: got 'n.a.'
## Warning: Expecting numeric in D39168 / R39168C4: got 'n.a.'
## Warning: Expecting numeric in D39169 / R39169C4: got 'n.a.'
## Warning: Expecting numeric in D39170 / R39170C4: got 'n.a.'
## Warning: Expecting numeric in D39171 / R39171C4: got 'n.a.'
## Warning: Expecting numeric in D39172 / R39172C4: got 'n.a.'
## Warning: Expecting numeric in D39173 / R39173C4: got 'n.a.'
## Warning: Expecting numeric in D39174 / R39174C4: got 'n.a.'
## Warning: Expecting numeric in D39175 / R39175C4: got 'n.a.'
## Warning: Expecting numeric in D39176 / R39176C4: got 'n.a.'
## Warning: Expecting numeric in D39177 / R39177C4: got 'n.a.'
## Warning: Expecting numeric in D39178 / R39178C4: got 'n.a.'
## Warning: Expecting numeric in D39179 / R39179C4: got 'n.a.'
## Warning: Expecting numeric in D39180 / R39180C4: got 'n.a.'
## Warning: Expecting numeric in D39181 / R39181C4: got 'n.a.'
## Warning: Expecting numeric in D39182 / R39182C4: got 'n.a.'
## Warning: Expecting numeric in D39183 / R39183C4: got 'n.a.'
## Warning: Expecting numeric in D39184 / R39184C4: got 'n.a.'
## Warning: Expecting numeric in D39185 / R39185C4: got 'n.a.'
## Warning: Expecting numeric in D39186 / R39186C4: got 'n.a.'
## Warning: Expecting numeric in D39187 / R39187C4: got 'n.a.'
## Warning: Expecting numeric in D39188 / R39188C4: got 'n.a.'
## Warning: Expecting numeric in D39189 / R39189C4: got 'n.a.'
## Warning: Expecting numeric in D39190 / R39190C4: got 'n.a.'
## Warning: Expecting numeric in D39191 / R39191C4: got 'n.a.'
## Warning: Expecting numeric in D39192 / R39192C4: got 'n.a.'
## Warning: Expecting numeric in D39193 / R39193C4: got 'n.a.'
## Warning: Expecting numeric in D39194 / R39194C4: got 'n.a.'
## Warning: Expecting numeric in D39195 / R39195C4: got 'n.a.'
## Warning: Expecting numeric in D39196 / R39196C4: got 'n.a.'
## Warning: Expecting numeric in D39197 / R39197C4: got 'n.a.'
## Warning: Expecting numeric in D39198 / R39198C4: got 'n.a.'
## Warning: Expecting numeric in D39199 / R39199C4: got 'n.a.'
## Warning: Expecting numeric in D39200 / R39200C4: got 'n.a.'
## Warning: Expecting numeric in D39201 / R39201C4: got 'n.a.'
## Warning: Expecting numeric in D39202 / R39202C4: got 'n.a.'
## Warning: Expecting numeric in D39203 / R39203C4: got 'n.a.'
## Warning: Expecting numeric in D39204 / R39204C4: got 'n.a.'
## Warning: Expecting numeric in D39205 / R39205C4: got 'n.a.'
## Warning: Expecting numeric in D39206 / R39206C4: got 'n.a.'
## Warning: Expecting numeric in D39207 / R39207C4: got 'n.a.'
## Warning: Expecting numeric in D39208 / R39208C4: got 'n.a.'
## Warning: Expecting numeric in D39209 / R39209C4: got 'n.a.'
## Warning: Expecting numeric in D39210 / R39210C4: got 'n.a.'
## Warning: Expecting numeric in D39211 / R39211C4: got 'n.a.'
## Warning: Expecting numeric in D39212 / R39212C4: got 'n.a.'
## Warning: Expecting numeric in D39213 / R39213C4: got 'n.a.'
## Warning: Expecting numeric in D39214 / R39214C4: got 'n.a.'
## Warning: Expecting numeric in D39215 / R39215C4: got 'n.a.'
## Warning: Expecting numeric in D39216 / R39216C4: got 'n.a.'
## Warning: Expecting numeric in D39217 / R39217C4: got 'n.a.'
## Warning: Expecting numeric in D39218 / R39218C4: got 'n.a.'
## Warning: Expecting numeric in D39219 / R39219C4: got 'n.a.'
## Warning: Expecting numeric in D39220 / R39220C4: got 'n.a.'
## Warning: Expecting numeric in D39221 / R39221C4: got 'n.a.'
## Warning: Expecting numeric in D39222 / R39222C4: got 'n.a.'
## Warning: Expecting numeric in D39223 / R39223C4: got 'n.a.'
## Warning: Expecting numeric in D39224 / R39224C4: got 'n.a.'
## Warning: Expecting numeric in D39225 / R39225C4: got 'n.a.'
## Warning: Expecting numeric in D39226 / R39226C4: got 'n.a.'
## Warning: Expecting numeric in D39227 / R39227C4: got 'n.a.'
## Warning: Expecting numeric in D39228 / R39228C4: got 'n.a.'
## Warning: Expecting numeric in D39229 / R39229C4: got 'n.a.'
## Warning: Expecting numeric in D39230 / R39230C4: got 'n.a.'
## Warning: Expecting numeric in D39231 / R39231C4: got 'n.a.'
## Warning: Expecting numeric in D39232 / R39232C4: got 'n.a.'
## Warning: Expecting numeric in D39233 / R39233C4: got 'n.a.'
## Warning: Expecting numeric in D39234 / R39234C4: got 'n.a.'
## Warning: Expecting numeric in D39235 / R39235C4: got 'n.a.'
## Warning: Expecting numeric in D39236 / R39236C4: got 'n.a.'
## Warning: Expecting numeric in D39237 / R39237C4: got 'n.a.'
## Warning: Expecting numeric in D39238 / R39238C4: got 'n.a.'
## Warning: Expecting numeric in D39239 / R39239C4: got 'n.a.'
## Warning: Expecting numeric in D39240 / R39240C4: got 'n.a.'
## Warning: Expecting numeric in D39241 / R39241C4: got 'n.a.'
## Warning: Expecting numeric in D39242 / R39242C4: got 'n.a.'
## Warning: Expecting numeric in D39243 / R39243C4: got 'n.a.'
## Warning: Expecting numeric in D39244 / R39244C4: got 'n.a.'
## Warning: Expecting numeric in D39245 / R39245C4: got 'n.a.'
## Warning: Expecting numeric in D39246 / R39246C4: got 'n.a.'
## Warning: Expecting numeric in D39247 / R39247C4: got 'n.a.'
## Warning: Expecting numeric in D39248 / R39248C4: got 'n.a.'
## Warning: Expecting numeric in D39249 / R39249C4: got 'n.a.'
## Warning: Expecting numeric in D39250 / R39250C4: got 'n.a.'
## Warning: Expecting numeric in D39251 / R39251C4: got 'n.a.'
## Warning: Expecting numeric in D39252 / R39252C4: got 'n.a.'
## Warning: Expecting numeric in D39253 / R39253C4: got 'n.a.'
## Warning: Expecting numeric in D39254 / R39254C4: got 'n.a.'
## Warning: Expecting numeric in D39255 / R39255C4: got 'n.a.'
## Warning: Expecting numeric in D39256 / R39256C4: got 'n.a.'
## Warning: Expecting numeric in D39257 / R39257C4: got 'n.a.'
## Warning: Expecting numeric in D39258 / R39258C4: got 'n.a.'
## Warning: Expecting numeric in D39259 / R39259C4: got 'n.a.'
## Warning: Expecting numeric in D39260 / R39260C4: got 'n.a.'
## Warning: Expecting numeric in D39261 / R39261C4: got 'n.a.'
## Warning: Expecting numeric in D39262 / R39262C4: got 'n.a.'
## Warning: Expecting numeric in D39263 / R39263C4: got 'n.a.'
## Warning: Expecting numeric in D39264 / R39264C4: got 'n.a.'
## Warning: Expecting numeric in D39265 / R39265C4: got 'n.a.'
## Warning: Expecting numeric in D39266 / R39266C4: got 'n.a.'
## Warning: Expecting numeric in D39267 / R39267C4: got 'n.a.'
## Warning: Expecting numeric in D39268 / R39268C4: got 'n.a.'
## Warning: Expecting numeric in D39269 / R39269C4: got 'n.a.'
## Warning: Expecting numeric in D39270 / R39270C4: got 'n.a.'
## Warning: Expecting numeric in D39271 / R39271C4: got 'n.a.'
## Warning: Expecting numeric in D39272 / R39272C4: got 'n.a.'
## Warning: Expecting numeric in D39273 / R39273C4: got 'n.a.'
## Warning: Expecting numeric in D39274 / R39274C4: got 'n.a.'
## Warning: Expecting numeric in D39275 / R39275C4: got 'n.a.'
## Warning: Expecting numeric in D39276 / R39276C4: got 'n.a.'
## Warning: Expecting numeric in D39277 / R39277C4: got 'n.a.'
## Warning: Expecting numeric in D39278 / R39278C4: got 'n.a.'
## Warning: Expecting numeric in D39279 / R39279C4: got 'n.a.'
## Warning: Expecting numeric in D39280 / R39280C4: got 'n.a.'
## Warning: Expecting numeric in D39281 / R39281C4: got 'n.a.'
## Warning: Expecting numeric in D39282 / R39282C4: got 'n.a.'
## Warning: Expecting numeric in D39283 / R39283C4: got 'n.a.'
## Warning: Expecting numeric in D39284 / R39284C4: got 'n.a.'
## Warning: Expecting numeric in D39285 / R39285C4: got 'n.a.'
## Warning: Expecting numeric in D39286 / R39286C4: got 'n.a.'
## Warning: Expecting numeric in D39287 / R39287C4: got 'n.a.'
## Warning: Expecting numeric in D39288 / R39288C4: got 'n.a.'
## Warning: Expecting numeric in D39289 / R39289C4: got 'n.a.'
## Warning: Expecting numeric in D39290 / R39290C4: got 'n.a.'
## Warning: Expecting numeric in D39291 / R39291C4: got 'n.a.'
## Warning: Expecting numeric in D39292 / R39292C4: got 'n.a.'
## Warning: Expecting numeric in D39293 / R39293C4: got 'n.a.'
## Warning: Expecting numeric in D39294 / R39294C4: got 'n.a.'
## Warning: Expecting numeric in D39295 / R39295C4: got 'n.a.'
## Warning: Expecting numeric in D39296 / R39296C4: got 'n.a.'
## Warning: Expecting numeric in D39297 / R39297C4: got 'n.a.'
## Warning: Expecting numeric in D39298 / R39298C4: got 'n.a.'
## Warning: Expecting numeric in D39299 / R39299C4: got 'n.a.'
## Warning: Expecting numeric in D39300 / R39300C4: got 'n.a.'
## Warning: Expecting numeric in D39301 / R39301C4: got 'n.a.'
## Warning: Expecting numeric in D39302 / R39302C4: got 'n.a.'
## Warning: Expecting numeric in D39303 / R39303C4: got 'n.a.'
## Warning: Expecting numeric in D39304 / R39304C4: got 'n.a.'
## Warning: Expecting numeric in D39305 / R39305C4: got 'n.a.'
## Warning: Expecting numeric in D39306 / R39306C4: got 'n.a.'
## Warning: Expecting numeric in D39307 / R39307C4: got 'n.a.'
## Warning: Expecting numeric in D39308 / R39308C4: got 'n.a.'
## Warning: Expecting numeric in D39309 / R39309C4: got 'n.a.'
## Warning: Expecting numeric in D39310 / R39310C4: got 'n.a.'
## Warning: Expecting numeric in D39311 / R39311C4: got 'n.a.'
## Warning: Expecting numeric in D39312 / R39312C4: got 'n.a.'
## Warning: Expecting numeric in D39313 / R39313C4: got 'n.a.'
## Warning: Expecting numeric in D39314 / R39314C4: got 'n.a.'
## Warning: Expecting numeric in D39315 / R39315C4: got 'n.a.'
## Warning: Expecting numeric in D39316 / R39316C4: got 'n.a.'
## Warning: Expecting numeric in D39317 / R39317C4: got 'n.a.'
## Warning: Expecting numeric in D39318 / R39318C4: got 'n.a.'
## Warning: Expecting numeric in D39319 / R39319C4: got 'n.a.'
## Warning: Expecting numeric in D39320 / R39320C4: got 'n.a.'
## Warning: Expecting numeric in D39321 / R39321C4: got 'n.a.'
## Warning: Expecting numeric in D39322 / R39322C4: got 'n.a.'
## Warning: Expecting numeric in D39323 / R39323C4: got 'n.a.'
## Warning: Expecting numeric in D39324 / R39324C4: got 'n.a.'
## Warning: Expecting numeric in D39325 / R39325C4: got 'n.a.'
## Warning: Expecting numeric in D39326 / R39326C4: got 'n.a.'
## Warning: Expecting numeric in D39327 / R39327C4: got 'n.a.'
## Warning: Expecting numeric in D39328 / R39328C4: got 'n.a.'
## Warning: Expecting numeric in D39329 / R39329C4: got 'n.a.'
## Warning: Expecting numeric in D39330 / R39330C4: got 'n.a.'
## Warning: Expecting numeric in D39331 / R39331C4: got 'n.a.'
## Warning: Expecting numeric in D39332 / R39332C4: got 'n.a.'
## Warning: Expecting numeric in D39333 / R39333C4: got 'n.a.'
## Warning: Expecting numeric in D39334 / R39334C4: got 'n.a.'
## Warning: Expecting numeric in D39335 / R39335C4: got 'n.a.'
## Warning: Expecting numeric in D39336 / R39336C4: got 'n.a.'
## Warning: Expecting numeric in D39337 / R39337C4: got 'n.a.'
## Warning: Expecting numeric in D39338 / R39338C4: got 'n.a.'
## Warning: Expecting numeric in D39339 / R39339C4: got 'n.a.'
## Warning: Expecting numeric in D39340 / R39340C4: got 'n.a.'
## Warning: Expecting numeric in D39341 / R39341C4: got 'n.a.'
## Warning: Expecting numeric in D39342 / R39342C4: got 'n.a.'
## Warning: Expecting numeric in D39343 / R39343C4: got 'n.a.'
## Warning: Expecting numeric in D39344 / R39344C4: got 'n.a.'
## Warning: Expecting numeric in D39345 / R39345C4: got 'n.a.'
## Warning: Expecting numeric in D39346 / R39346C4: got 'n.a.'
## Warning: Expecting numeric in D39347 / R39347C4: got 'n.a.'
## Warning: Expecting numeric in D39348 / R39348C4: got 'n.a.'
## Warning: Expecting numeric in D39349 / R39349C4: got 'n.a.'
## Warning: Expecting numeric in D39350 / R39350C4: got 'n.a.'
## Warning: Expecting numeric in D39351 / R39351C4: got 'n.a.'
## Warning: Expecting numeric in D39352 / R39352C4: got 'n.a.'
## Warning: Expecting numeric in D39353 / R39353C4: got 'n.a.'
## Warning: Expecting numeric in D39354 / R39354C4: got 'n.a.'
## Warning: Expecting numeric in D39355 / R39355C4: got 'n.a.'
## Warning: Expecting numeric in D39356 / R39356C4: got 'n.a.'
## Warning: Expecting numeric in D39357 / R39357C4: got 'n.a.'
## Warning: Expecting numeric in D39358 / R39358C4: got 'n.a.'
## Warning: Expecting numeric in D39359 / R39359C4: got 'n.a.'
## Warning: Expecting numeric in D39360 / R39360C4: got 'n.a.'
## Warning: Expecting numeric in D39361 / R39361C4: got 'n.a.'
## Warning: Expecting numeric in D39362 / R39362C4: got 'n.a.'
## Warning: Expecting numeric in D39363 / R39363C4: got 'n.a.'
## Warning: Expecting numeric in D39364 / R39364C4: got 'n.a.'
## Warning: Expecting numeric in D39365 / R39365C4: got 'n.a.'
## Warning: Expecting numeric in D39366 / R39366C4: got 'n.a.'
## Warning: Expecting numeric in D39367 / R39367C4: got 'n.a.'
## Warning: Expecting numeric in D39368 / R39368C4: got 'n.a.'
## Warning: Expecting numeric in D39369 / R39369C4: got 'n.a.'
## Warning: Expecting numeric in D39370 / R39370C4: got 'n.a.'
## Warning: Expecting numeric in D39371 / R39371C4: got 'n.a.'
## Warning: Expecting numeric in D39372 / R39372C4: got 'n.a.'
## Warning: Expecting numeric in D39373 / R39373C4: got 'n.a.'
## Warning: Expecting numeric in D39374 / R39374C4: got 'n.a.'
## Warning: Expecting numeric in D39375 / R39375C4: got 'n.a.'
## Warning: Expecting numeric in D39376 / R39376C4: got 'n.a.'
## Warning: Expecting numeric in D39377 / R39377C4: got 'n.a.'
## Warning: Expecting numeric in D39378 / R39378C4: got 'n.a.'
## Warning: Expecting numeric in D39379 / R39379C4: got 'n.a.'
## Warning: Expecting numeric in D39380 / R39380C4: got 'n.a.'
## Warning: Expecting numeric in D39381 / R39381C4: got 'n.a.'
## Warning: Expecting numeric in D39382 / R39382C4: got 'n.a.'
## Warning: Expecting numeric in D39383 / R39383C4: got 'n.a.'
## Warning: Expecting numeric in D39384 / R39384C4: got 'n.a.'
## Warning: Expecting numeric in D39385 / R39385C4: got 'n.a.'
## Warning: Expecting numeric in D39386 / R39386C4: got 'n.a.'
## Warning: Expecting numeric in D39387 / R39387C4: got 'n.a.'
## Warning: Expecting numeric in D39388 / R39388C4: got 'n.a.'
## Warning: Expecting numeric in D39389 / R39389C4: got 'n.a.'
## Warning: Expecting numeric in D39390 / R39390C4: got 'n.a.'
## Warning: Expecting numeric in D39391 / R39391C4: got 'n.a.'
## Warning: Expecting numeric in D39392 / R39392C4: got 'n.a.'
## Warning: Expecting numeric in D39393 / R39393C4: got 'n.a.'
## Warning: Expecting numeric in D39394 / R39394C4: got 'n.a.'
## Warning: Expecting numeric in D39395 / R39395C4: got 'n.a.'
## Warning: Expecting numeric in D39396 / R39396C4: got 'n.a.'
## Warning: Expecting numeric in D39397 / R39397C4: got 'n.a.'
## Warning: Expecting numeric in D39398 / R39398C4: got 'n.a.'
## Warning: Expecting numeric in D39399 / R39399C4: got 'n.a.'
## Warning: Expecting numeric in D39400 / R39400C4: got 'n.a.'
## Warning: Expecting numeric in D39401 / R39401C4: got 'n.a.'
## Warning: Expecting numeric in D39402 / R39402C4: got 'n.a.'
## Warning: Expecting numeric in D39403 / R39403C4: got 'n.a.'
## Warning: Expecting numeric in D39404 / R39404C4: got 'n.a.'
## Warning: Expecting numeric in D39405 / R39405C4: got 'n.a.'
## Warning: Expecting numeric in D39406 / R39406C4: got 'n.a.'
## Warning: Expecting numeric in D39407 / R39407C4: got 'n.a.'
## Warning: Expecting numeric in D39408 / R39408C4: got 'n.a.'
## Warning: Expecting numeric in D39409 / R39409C4: got 'n.a.'
## Warning: Expecting numeric in D39410 / R39410C4: got 'n.a.'
## Warning: Expecting numeric in D39411 / R39411C4: got 'n.a.'
## Warning: Expecting numeric in D39412 / R39412C4: got 'n.a.'
## Warning: Expecting numeric in D39413 / R39413C4: got 'n.a.'
## Warning: Expecting numeric in D39414 / R39414C4: got 'n.a.'
## Warning: Expecting numeric in D39415 / R39415C4: got 'n.a.'
## Warning: Expecting numeric in D39416 / R39416C4: got 'n.a.'
## Warning: Expecting numeric in D39417 / R39417C4: got 'n.a.'
## Warning: Expecting numeric in D39418 / R39418C4: got 'n.a.'
## Warning: Expecting numeric in D39419 / R39419C4: got 'n.a.'
## Warning: Expecting numeric in D39420 / R39420C4: got 'n.a.'
## Warning: Expecting numeric in D39421 / R39421C4: got 'n.a.'
## Warning: Expecting numeric in D39422 / R39422C4: got 'n.a.'
## Warning: Expecting numeric in D39423 / R39423C4: got 'n.a.'
## Warning: Expecting numeric in D39424 / R39424C4: got 'n.a.'
## Warning: Expecting numeric in D39425 / R39425C4: got 'n.a.'
## Warning: Expecting numeric in D39426 / R39426C4: got 'n.a.'
## Warning: Expecting numeric in D39427 / R39427C4: got 'n.a.'
## Warning: Expecting numeric in D39428 / R39428C4: got 'n.a.'
## Warning: Expecting numeric in D39429 / R39429C4: got 'n.a.'
## Warning: Expecting numeric in D39430 / R39430C4: got 'n.a.'
## Warning: Expecting numeric in D39431 / R39431C4: got 'n.a.'
## Warning: Expecting numeric in D39432 / R39432C4: got 'n.a.'
## Warning: Expecting numeric in D39433 / R39433C4: got 'n.a.'
## Warning: Expecting numeric in D39434 / R39434C4: got 'n.a.'
## Warning: Expecting numeric in D39435 / R39435C4: got 'n.a.'
## Warning: Expecting numeric in D39436 / R39436C4: got 'n.a.'
## Warning: Expecting numeric in D39437 / R39437C4: got 'n.a.'
## Warning: Expecting numeric in D39438 / R39438C4: got 'n.a.'
## Warning: Expecting numeric in D39439 / R39439C4: got 'n.a.'
## Warning: Expecting numeric in D39440 / R39440C4: got 'n.a.'
## Warning: Expecting numeric in D39441 / R39441C4: got 'n.a.'
## Warning: Expecting numeric in D39442 / R39442C4: got 'n.a.'
## Warning: Expecting numeric in D39443 / R39443C4: got 'n.a.'
## Warning: Expecting numeric in D39444 / R39444C4: got 'n.a.'
## Warning: Expecting numeric in D39445 / R39445C4: got 'n.a.'
## Warning: Expecting numeric in D39446 / R39446C4: got 'n.a.'
## Warning: Expecting numeric in D39447 / R39447C4: got 'n.a.'
## Warning: Expecting numeric in D39448 / R39448C4: got 'n.a.'
## Warning: Expecting numeric in D39449 / R39449C4: got 'n.a.'
## Warning: Expecting numeric in D39450 / R39450C4: got 'n.a.'
## Warning: Expecting numeric in D39451 / R39451C4: got 'n.a.'
## Warning: Expecting numeric in D39452 / R39452C4: got 'n.a.'
## Warning: Expecting numeric in D39453 / R39453C4: got 'n.a.'
## Warning: Expecting numeric in D39454 / R39454C4: got 'n.a.'
## Warning: Expecting numeric in D39455 / R39455C4: got 'n.a.'
## Warning: Expecting numeric in D39456 / R39456C4: got 'n.a.'
## Warning: Expecting numeric in D39457 / R39457C4: got 'n.a.'
## Warning: Expecting numeric in D39458 / R39458C4: got 'n.a.'
## Warning: Expecting numeric in D39459 / R39459C4: got 'n.a.'
## Warning: Expecting numeric in D39460 / R39460C4: got 'n.a.'
## Warning: Expecting numeric in D39461 / R39461C4: got 'n.a.'
## Warning: Expecting numeric in D39462 / R39462C4: got 'n.a.'
## Warning: Expecting numeric in D39463 / R39463C4: got 'n.a.'
## Warning: Expecting numeric in D39464 / R39464C4: got 'n.a.'
## Warning: Expecting numeric in D39465 / R39465C4: got 'n.a.'
## Warning: Expecting numeric in D39466 / R39466C4: got 'n.a.'
## Warning: Expecting numeric in D39467 / R39467C4: got 'n.a.'
## Warning: Expecting numeric in D39468 / R39468C4: got 'n.a.'
## Warning: Expecting numeric in D39469 / R39469C4: got 'n.a.'
## Warning: Expecting numeric in D39470 / R39470C4: got 'n.a.'
## Warning: Expecting numeric in D39471 / R39471C4: got 'n.a.'
## Warning: Expecting numeric in D39472 / R39472C4: got 'n.a.'
## Warning: Expecting numeric in D39473 / R39473C4: got 'n.a.'
## Warning: Expecting numeric in D39474 / R39474C4: got 'n.a.'
## Warning: Expecting numeric in D39475 / R39475C4: got 'n.a.'
## Warning: Expecting numeric in D39476 / R39476C4: got 'n.a.'
## Warning: Expecting numeric in D39477 / R39477C4: got 'n.a.'
## Warning: Expecting numeric in D39478 / R39478C4: got 'n.a.'
## Warning: Expecting numeric in D39479 / R39479C4: got 'n.a.'
## Warning: Expecting numeric in D39480 / R39480C4: got 'n.a.'
## Warning: Expecting numeric in D39481 / R39481C4: got 'n.a.'
## Warning: Expecting numeric in D39482 / R39482C4: got 'n.a.'
## Warning: Expecting numeric in D39483 / R39483C4: got 'n.a.'
## Warning: Expecting numeric in D39484 / R39484C4: got 'n.a.'
## Warning: Expecting numeric in D39485 / R39485C4: got 'n.a.'
## Warning: Expecting numeric in D39486 / R39486C4: got 'n.a.'
## Warning: Expecting numeric in D39487 / R39487C4: got 'n.a.'
## Warning: Expecting numeric in D39488 / R39488C4: got 'n.a.'
## Warning: Expecting numeric in D39489 / R39489C4: got 'n.a.'
## Warning: Expecting numeric in D39490 / R39490C4: got 'n.a.'
## Warning: Expecting numeric in D39491 / R39491C4: got 'n.a.'
## Warning: Expecting numeric in D39492 / R39492C4: got 'n.a.'
## Warning: Expecting numeric in D39493 / R39493C4: got 'n.a.'
## Warning: Expecting numeric in D39494 / R39494C4: got 'n.a.'
## Warning: Expecting numeric in D39495 / R39495C4: got 'n.a.'
## Warning: Expecting numeric in D39496 / R39496C4: got 'n.a.'
## Warning: Expecting numeric in D39497 / R39497C4: got 'n.a.'
## Warning: Expecting numeric in D39498 / R39498C4: got 'n.a.'
## Warning: Expecting numeric in D39499 / R39499C4: got 'n.a.'
## Warning: Expecting numeric in D39500 / R39500C4: got 'n.a.'
## Warning: Expecting numeric in D39501 / R39501C4: got 'n.a.'
## Warning: Expecting numeric in D39502 / R39502C4: got 'n.a.'
## Warning: Expecting numeric in D39503 / R39503C4: got 'n.a.'
## Warning: Expecting numeric in D39504 / R39504C4: got 'n.a.'
## Warning: Expecting numeric in D39505 / R39505C4: got 'n.a.'
## Warning: Expecting numeric in D39506 / R39506C4: got 'n.a.'
## Warning: Expecting numeric in D39507 / R39507C4: got 'n.a.'
## Warning: Expecting numeric in D39508 / R39508C4: got 'n.a.'
## Warning: Expecting numeric in D39509 / R39509C4: got 'n.a.'
## Warning: Expecting numeric in D39510 / R39510C4: got 'n.a.'
## Warning: Expecting numeric in D39511 / R39511C4: got 'n.a.'
## Warning: Expecting numeric in D39512 / R39512C4: got 'n.a.'
## Warning: Expecting numeric in D39513 / R39513C4: got 'n.a.'
## Warning: Expecting numeric in D39514 / R39514C4: got 'n.a.'
## Warning: Expecting numeric in D39515 / R39515C4: got 'n.a.'
## Warning: Expecting numeric in D39516 / R39516C4: got 'n.a.'
## Warning: Expecting numeric in D39517 / R39517C4: got 'n.a.'
## Warning: Expecting numeric in D39518 / R39518C4: got 'n.a.'
## Warning: Expecting numeric in D39519 / R39519C4: got 'n.a.'
## Warning: Expecting numeric in D39520 / R39520C4: got 'n.a.'
## Warning: Expecting numeric in D39521 / R39521C4: got 'n.a.'
## Warning: Expecting numeric in D39522 / R39522C4: got 'n.a.'
## Warning: Expecting numeric in D39523 / R39523C4: got 'n.a.'
## Warning: Expecting numeric in D39524 / R39524C4: got 'n.a.'
## Warning: Expecting numeric in D39525 / R39525C4: got 'n.a.'
## Warning: Expecting numeric in D39526 / R39526C4: got 'n.a.'
## Warning: Expecting numeric in D39527 / R39527C4: got 'n.a.'
## Warning: Expecting numeric in D39528 / R39528C4: got 'n.a.'
## Warning: Expecting numeric in D39529 / R39529C4: got 'n.a.'
## Warning: Expecting numeric in D39530 / R39530C4: got 'n.a.'
## Warning: Expecting numeric in D39531 / R39531C4: got 'n.a.'
## Warning: Expecting numeric in D39532 / R39532C4: got 'n.a.'
## Warning: Expecting numeric in D39533 / R39533C4: got 'n.a.'
## Warning: Expecting numeric in D39534 / R39534C4: got 'n.a.'
## Warning: Expecting numeric in D39535 / R39535C4: got 'n.a.'
## Warning: Expecting numeric in D39536 / R39536C4: got 'n.a.'
## Warning: Expecting numeric in D39537 / R39537C4: got 'n.a.'
## Warning: Expecting numeric in D39538 / R39538C4: got 'n.a.'
## Warning: Expecting numeric in D39539 / R39539C4: got 'n.a.'
## Warning: Expecting numeric in D39540 / R39540C4: got 'n.a.'
## Warning: Expecting numeric in D39541 / R39541C4: got 'n.a.'
## Warning: Expecting numeric in D39542 / R39542C4: got 'n.a.'
## Warning: Expecting numeric in D39543 / R39543C4: got 'n.a.'
## Warning: Expecting numeric in D39544 / R39544C4: got 'n.a.'
## Warning: Expecting numeric in D39545 / R39545C4: got 'n.a.'
## Warning: Expecting numeric in D39546 / R39546C4: got 'n.a.'
## Warning: Expecting numeric in D39547 / R39547C4: got 'n.a.'
## Warning: Expecting numeric in D39548 / R39548C4: got 'n.a.'
## Warning: Expecting numeric in D39549 / R39549C4: got 'n.a.'
## Warning: Expecting numeric in D39550 / R39550C4: got 'n.a.'
## Warning: Expecting numeric in D39551 / R39551C4: got 'n.a.'
## Warning: Expecting numeric in D39552 / R39552C4: got 'n.a.'
## Warning: Expecting numeric in D39553 / R39553C4: got 'n.a.'
## Warning: Expecting numeric in D39554 / R39554C4: got 'n.a.'
## Warning: Expecting numeric in D39555 / R39555C4: got 'n.a.'
## Warning: Expecting numeric in D39556 / R39556C4: got 'n.a.'
## Warning: Expecting numeric in D39557 / R39557C4: got 'n.a.'
## Warning: Expecting numeric in D39558 / R39558C4: got 'n.a.'
## Warning: Expecting numeric in D39559 / R39559C4: got 'n.a.'
## Warning: Expecting numeric in D39560 / R39560C4: got 'n.a.'
## Warning: Expecting numeric in D39561 / R39561C4: got 'n.a.'
## Warning: Expecting numeric in D39562 / R39562C4: got 'n.a.'
## Warning: Expecting numeric in D39563 / R39563C4: got 'n.a.'
## Warning: Expecting numeric in D39564 / R39564C4: got 'n.a.'
## Warning: Expecting numeric in D39565 / R39565C4: got 'n.a.'
## Warning: Expecting numeric in D39566 / R39566C4: got 'n.a.'
## Warning: Expecting numeric in D39567 / R39567C4: got 'n.a.'
## Warning: Expecting numeric in D39568 / R39568C4: got 'n.a.'
## Warning: Expecting numeric in D39569 / R39569C4: got 'n.a.'
## Warning: Expecting numeric in D39570 / R39570C4: got 'n.a.'
## Warning: Expecting numeric in D39571 / R39571C4: got 'n.a.'
## Warning: Expecting numeric in D39572 / R39572C4: got 'n.a.'
## Warning: Expecting numeric in D39573 / R39573C4: got 'n.a.'
## Warning: Expecting numeric in D39574 / R39574C4: got 'n.a.'
## Warning: Expecting numeric in D39575 / R39575C4: got 'n.a.'
## Warning: Expecting numeric in D39576 / R39576C4: got 'n.a.'
## Warning: Expecting numeric in D39577 / R39577C4: got 'n.a.'
## Warning: Expecting numeric in D39578 / R39578C4: got 'n.a.'
## Warning: Expecting numeric in D39579 / R39579C4: got 'n.a.'
## Warning: Expecting numeric in D39580 / R39580C4: got 'n.a.'
## Warning: Expecting numeric in D39581 / R39581C4: got 'n.a.'
## Warning: Expecting numeric in D39582 / R39582C4: got 'n.a.'
## Warning: Expecting numeric in D39583 / R39583C4: got 'n.a.'
## Warning: Expecting numeric in D39584 / R39584C4: got 'n.a.'
## Warning: Expecting numeric in D39585 / R39585C4: got 'n.a.'
## Warning: Expecting numeric in D39586 / R39586C4: got 'n.a.'
## Warning: Expecting numeric in D39587 / R39587C4: got 'n.a.'
## Warning: Expecting numeric in D39588 / R39588C4: got 'n.a.'
## Warning: Expecting numeric in D39589 / R39589C4: got 'n.a.'
## Warning: Expecting numeric in D39590 / R39590C4: got 'n.a.'
## Warning: Expecting numeric in D39591 / R39591C4: got 'n.a.'
## Warning: Expecting numeric in D39592 / R39592C4: got 'n.a.'
## Warning: Expecting numeric in D39593 / R39593C4: got 'n.a.'
## Warning: Expecting numeric in D39594 / R39594C4: got 'n.a.'
## Warning: Expecting numeric in D39595 / R39595C4: got 'n.a.'
## Warning: Expecting numeric in D39596 / R39596C4: got 'n.a.'
## Warning: Expecting numeric in D39597 / R39597C4: got 'n.a.'
## Warning: Expecting numeric in D39598 / R39598C4: got 'n.a.'
## Warning: Expecting numeric in D39599 / R39599C4: got 'n.a.'
## Warning: Expecting numeric in D39600 / R39600C4: got 'n.a.'
## Warning: Expecting numeric in D39601 / R39601C4: got 'n.a.'
## Warning: Expecting numeric in D39602 / R39602C4: got 'n.a.'
## Warning: Expecting numeric in D39603 / R39603C4: got 'n.a.'
## Warning: Expecting numeric in D39604 / R39604C4: got 'n.a.'
## Warning: Expecting numeric in D39605 / R39605C4: got 'n.a.'
## Warning: Expecting numeric in D39606 / R39606C4: got 'n.a.'
## Warning: Expecting numeric in D39607 / R39607C4: got 'n.a.'
## Warning: Expecting numeric in D39608 / R39608C4: got 'n.a.'
## Warning: Expecting numeric in D39609 / R39609C4: got 'n.a.'
## Warning: Expecting numeric in D39610 / R39610C4: got 'n.a.'
## Warning: Expecting numeric in D39611 / R39611C4: got 'n.a.'
## Warning: Expecting numeric in D39612 / R39612C4: got 'n.a.'
## Warning: Expecting numeric in D39613 / R39613C4: got 'n.a.'
## Warning: Expecting numeric in D39614 / R39614C4: got 'n.a.'
## Warning: Expecting numeric in D39615 / R39615C4: got 'n.a.'
## Warning: Expecting numeric in D39616 / R39616C4: got 'n.a.'
## Warning: Expecting numeric in D39617 / R39617C4: got 'n.a.'
## Warning: Expecting numeric in D39618 / R39618C4: got 'n.a.'
## Warning: Expecting numeric in D39619 / R39619C4: got 'n.a.'
## Warning: Expecting numeric in D39620 / R39620C4: got 'n.a.'
## Warning: Expecting numeric in D39621 / R39621C4: got 'n.a.'
## Warning: Expecting numeric in D39622 / R39622C4: got 'n.a.'
## Warning: Expecting numeric in D39623 / R39623C4: got 'n.a.'
## Warning: Expecting numeric in D39624 / R39624C4: got 'n.a.'
## Warning: Expecting numeric in D39625 / R39625C4: got 'n.a.'
## Warning: Expecting numeric in D39626 / R39626C4: got 'n.a.'
## Warning: Expecting numeric in D39627 / R39627C4: got 'n.a.'
## Warning: Expecting numeric in D39628 / R39628C4: got 'n.a.'
## Warning: Expecting numeric in D39629 / R39629C4: got 'n.a.'
## Warning: Expecting numeric in D39630 / R39630C4: got 'n.a.'
## Warning: Expecting numeric in D39631 / R39631C4: got 'n.a.'
## Warning: Expecting numeric in D39632 / R39632C4: got 'n.a.'
## Warning: Expecting numeric in D39633 / R39633C4: got 'n.a.'
## Warning: Expecting numeric in D39634 / R39634C4: got 'n.a.'
## Warning: Expecting numeric in D39635 / R39635C4: got 'n.a.'
## Warning: Expecting numeric in D39636 / R39636C4: got 'n.a.'
## Warning: Expecting numeric in D39637 / R39637C4: got 'n.a.'
## Warning: Expecting numeric in D39638 / R39638C4: got 'n.a.'
## Warning: Expecting numeric in D39639 / R39639C4: got 'n.a.'
## Warning: Expecting numeric in D39640 / R39640C4: got 'n.a.'
## Warning: Expecting numeric in D39641 / R39641C4: got 'n.a.'
## Warning: Expecting numeric in D39642 / R39642C4: got 'n.a.'
## Warning: Expecting numeric in D39643 / R39643C4: got 'n.a.'
## Warning: Expecting numeric in D39644 / R39644C4: got 'n.a.'
## Warning: Expecting numeric in D39645 / R39645C4: got 'n.a.'
## Warning: Expecting numeric in D39646 / R39646C4: got 'n.a.'
## Warning: Expecting numeric in D39647 / R39647C4: got 'n.a.'
## Warning: Expecting numeric in D39648 / R39648C4: got 'n.a.'
## Warning: Expecting numeric in D39649 / R39649C4: got 'n.a.'
## Warning: Expecting numeric in D39650 / R39650C4: got 'n.a.'
## Warning: Expecting numeric in D39651 / R39651C4: got 'n.a.'
## Warning: Expecting numeric in D39652 / R39652C4: got 'n.a.'
## Warning: Expecting numeric in D39653 / R39653C4: got 'n.a.'
## Warning: Expecting numeric in D39654 / R39654C4: got 'n.a.'
## Warning: Expecting numeric in D39655 / R39655C4: got 'n.a.'
## Warning: Expecting numeric in D39656 / R39656C4: got 'n.a.'
## Warning: Expecting numeric in D39657 / R39657C4: got 'n.a.'
## Warning: Expecting numeric in D39658 / R39658C4: got 'n.a.'
## Warning: Expecting numeric in D39659 / R39659C4: got 'n.a.'
## Warning: Expecting numeric in D39660 / R39660C4: got 'n.a.'
## Warning: Expecting numeric in D39661 / R39661C4: got 'n.a.'
## Warning: Expecting numeric in D39662 / R39662C4: got 'n.a.'
## Warning: Expecting numeric in D39663 / R39663C4: got 'n.a.'
## Warning: Expecting numeric in D39664 / R39664C4: got 'n.a.'
## Warning: Expecting numeric in D39665 / R39665C4: got 'n.a.'
## Warning: Expecting numeric in D39666 / R39666C4: got 'n.a.'
## Warning: Expecting numeric in D39667 / R39667C4: got 'n.a.'
## Warning: Expecting numeric in D39668 / R39668C4: got 'n.a.'
## Warning: Expecting numeric in D39669 / R39669C4: got 'n.a.'
## Warning: Expecting numeric in D39670 / R39670C4: got 'n.a.'
## Warning: Expecting numeric in D39671 / R39671C4: got 'n.a.'
## Warning: Expecting numeric in D39672 / R39672C4: got 'n.a.'
## Warning: Expecting numeric in D39673 / R39673C4: got 'n.a.'
## Warning: Expecting numeric in D39674 / R39674C4: got 'n.a.'
## Warning: Expecting numeric in D39675 / R39675C4: got 'n.a.'
## Warning: Expecting numeric in D39676 / R39676C4: got 'n.a.'
## Warning: Expecting numeric in D39677 / R39677C4: got 'n.a.'
## Warning: Expecting numeric in D39678 / R39678C4: got 'n.a.'
## Warning: Expecting numeric in D39679 / R39679C4: got 'n.a.'
## Warning: Expecting numeric in D39680 / R39680C4: got 'n.a.'
## Warning: Expecting numeric in D39681 / R39681C4: got 'n.a.'
## Warning: Expecting numeric in D39682 / R39682C4: got 'n.a.'
## Warning: Expecting numeric in D39683 / R39683C4: got 'n.a.'
## Warning: Expecting numeric in D39684 / R39684C4: got 'n.a.'
## Warning: Expecting numeric in D39685 / R39685C4: got 'n.a.'
## Warning: Expecting numeric in D39686 / R39686C4: got 'n.a.'
## Warning: Expecting numeric in D39687 / R39687C4: got 'n.a.'
## Warning: Expecting numeric in D39688 / R39688C4: got 'n.a.'
## Warning: Expecting numeric in D39689 / R39689C4: got 'n.a.'
## Warning: Expecting numeric in D39690 / R39690C4: got 'n.a.'
## Warning: Expecting numeric in D39691 / R39691C4: got 'n.a.'
## Warning: Expecting numeric in D39692 / R39692C4: got 'n.a.'
## Warning: Expecting numeric in D39693 / R39693C4: got 'n.a.'
## Warning: Expecting numeric in D39694 / R39694C4: got 'n.a.'
## Warning: Expecting numeric in D39695 / R39695C4: got 'n.a.'
## Warning: Expecting numeric in D39696 / R39696C4: got 'n.a.'
## Warning: Expecting numeric in D39697 / R39697C4: got 'n.a.'
## Warning: Expecting numeric in D39698 / R39698C4: got 'n.a.'
## Warning: Expecting numeric in D39699 / R39699C4: got 'n.a.'
## Warning: Expecting numeric in D39700 / R39700C4: got 'n.a.'
## Warning: Expecting numeric in D39701 / R39701C4: got 'n.a.'
## Warning: Expecting numeric in D39702 / R39702C4: got 'n.a.'
## Warning: Expecting numeric in D39703 / R39703C4: got 'n.a.'
## Warning: Expecting numeric in D39704 / R39704C4: got 'n.a.'
## Warning: Expecting numeric in D39705 / R39705C4: got 'n.a.'
## Warning: Expecting numeric in D39706 / R39706C4: got 'n.a.'
## Warning: Expecting numeric in D39707 / R39707C4: got 'n.a.'
## Warning: Expecting numeric in D39708 / R39708C4: got 'n.a.'
## Warning: Expecting numeric in D39709 / R39709C4: got 'n.a.'
## Warning: Expecting numeric in D39710 / R39710C4: got 'n.a.'
## Warning: Expecting numeric in D39711 / R39711C4: got 'n.a.'
## Warning: Expecting numeric in D39712 / R39712C4: got 'n.a.'
## Warning: Expecting numeric in D39713 / R39713C4: got 'n.a.'
## Warning: Expecting numeric in D39714 / R39714C4: got 'n.a.'
## Warning: Expecting numeric in D39715 / R39715C4: got 'n.a.'
## Warning: Expecting numeric in D39716 / R39716C4: got 'n.a.'
## Warning: Expecting numeric in D39717 / R39717C4: got 'n.a.'
## Warning: Expecting numeric in D39718 / R39718C4: got 'n.a.'
## Warning: Expecting numeric in D39719 / R39719C4: got 'n.a.'
## Warning: Expecting numeric in D39720 / R39720C4: got 'n.a.'
## Warning: Expecting numeric in D39721 / R39721C4: got 'n.a.'
## Warning: Expecting numeric in D39722 / R39722C4: got 'n.a.'
## Warning: Expecting numeric in D39723 / R39723C4: got 'n.a.'
## Warning: Expecting numeric in D39724 / R39724C4: got 'n.a.'
## Warning: Expecting numeric in D39725 / R39725C4: got 'n.a.'
## Warning: Expecting numeric in D39726 / R39726C4: got 'n.a.'
## Warning: Expecting numeric in D39727 / R39727C4: got 'n.a.'
## Warning: Expecting numeric in D39728 / R39728C4: got 'n.a.'
## Warning: Expecting numeric in D39729 / R39729C4: got 'n.a.'
## Warning: Expecting numeric in D39730 / R39730C4: got 'n.a.'
## Warning: Expecting numeric in D39731 / R39731C4: got 'n.a.'
## Warning: Expecting numeric in D39732 / R39732C4: got 'n.a.'
## Warning: Expecting numeric in D39733 / R39733C4: got 'n.a.'
## Warning: Expecting numeric in D39734 / R39734C4: got 'n.a.'
## Warning: Expecting numeric in D39735 / R39735C4: got 'n.a.'
## Warning: Expecting numeric in D39736 / R39736C4: got 'n.a.'
## Warning: Expecting numeric in D39737 / R39737C4: got 'n.a.'
## Warning: Expecting numeric in D39738 / R39738C4: got 'n.a.'
## Warning: Expecting numeric in D39739 / R39739C4: got 'n.a.'
## Warning: Expecting numeric in D39740 / R39740C4: got 'n.a.'
## Warning: Expecting numeric in D39741 / R39741C4: got 'n.a.'
## Warning: Expecting numeric in D39742 / R39742C4: got 'n.a.'
## Warning: Expecting numeric in D39743 / R39743C4: got 'n.a.'
## Warning: Expecting numeric in D39744 / R39744C4: got 'n.a.'
## Warning: Expecting numeric in D39745 / R39745C4: got 'n.a.'
## Warning: Expecting numeric in D39746 / R39746C4: got 'n.a.'
## Warning: Expecting numeric in D39747 / R39747C4: got 'n.a.'
## Warning: Expecting numeric in D39748 / R39748C4: got 'n.a.'
## Warning: Expecting numeric in D39749 / R39749C4: got 'n.a.'
## Warning: Expecting numeric in D39750 / R39750C4: got 'n.a.'
## Warning: Expecting numeric in D39751 / R39751C4: got 'n.a.'
## Warning: Expecting numeric in D39752 / R39752C4: got 'n.a.'
## Warning: Expecting numeric in D39753 / R39753C4: got 'n.a.'
## Warning: Expecting numeric in D39754 / R39754C4: got 'n.a.'
## Warning: Expecting numeric in D39755 / R39755C4: got 'n.a.'
## Warning: Expecting numeric in D39756 / R39756C4: got 'n.a.'
## Warning: Expecting numeric in D39757 / R39757C4: got 'n.a.'
## Warning: Expecting numeric in D39758 / R39758C4: got 'n.a.'
## Warning: Expecting numeric in D39759 / R39759C4: got 'n.a.'
## Warning: Expecting numeric in D39760 / R39760C4: got 'n.a.'
## Warning: Expecting numeric in D39761 / R39761C4: got 'n.a.'
## Warning: Expecting numeric in D39762 / R39762C4: got 'n.a.'
## Warning: Expecting numeric in D39763 / R39763C4: got 'n.a.'
## Warning: Expecting numeric in D39764 / R39764C4: got 'n.a.'
## Warning: Expecting numeric in D39765 / R39765C4: got 'n.a.'
## Warning: Expecting numeric in D39766 / R39766C4: got 'n.a.'
## Warning: Expecting numeric in D39767 / R39767C4: got 'n.a.'
## Warning: Expecting numeric in D39768 / R39768C4: got 'n.a.'
## Warning: Expecting numeric in D39769 / R39769C4: got 'n.a.'
## Warning: Expecting numeric in D39770 / R39770C4: got 'n.a.'
## Warning: Expecting numeric in D39771 / R39771C4: got 'n.a.'
## Warning: Expecting numeric in D39772 / R39772C4: got 'n.a.'
## Warning: Expecting numeric in D39773 / R39773C4: got 'n.a.'
## Warning: Expecting numeric in D39774 / R39774C4: got 'n.a.'
## Warning: Expecting numeric in D39775 / R39775C4: got 'n.a.'
## Warning: Expecting numeric in D39776 / R39776C4: got 'n.a.'
## Warning: Expecting numeric in D39777 / R39777C4: got 'n.a.'
## Warning: Expecting numeric in D39778 / R39778C4: got 'n.a.'
## Warning: Expecting numeric in D39779 / R39779C4: got 'n.a.'
## Warning: Expecting numeric in D39780 / R39780C4: got 'n.a.'
## Warning: Expecting numeric in D39781 / R39781C4: got 'n.a.'
## Warning: Expecting numeric in D39782 / R39782C4: got 'n.a.'
## Warning: Expecting numeric in D39783 / R39783C4: got 'n.a.'
## Warning: Expecting numeric in D39784 / R39784C4: got 'n.a.'
## Warning: Expecting numeric in D39785 / R39785C4: got 'n.a.'
## Warning: Expecting numeric in D39786 / R39786C4: got 'n.a.'
## Warning: Expecting numeric in D39787 / R39787C4: got 'n.a.'
## Warning: Expecting numeric in D39788 / R39788C4: got 'n.a.'
## Warning: Expecting numeric in D39789 / R39789C4: got 'n.a.'
## Warning: Expecting numeric in D39790 / R39790C4: got 'n.a.'
## Warning: Expecting numeric in D39791 / R39791C4: got 'n.a.'
## Warning: Expecting numeric in D39792 / R39792C4: got 'n.a.'
## Warning: Expecting numeric in D39793 / R39793C4: got 'n.a.'
## Warning: Expecting numeric in D39794 / R39794C4: got 'n.a.'
## Warning: Expecting numeric in D39795 / R39795C4: got 'n.a.'
## Warning: Expecting numeric in D39796 / R39796C4: got 'n.a.'
## Warning: Expecting numeric in D39797 / R39797C4: got 'n.a.'
## Warning: Expecting numeric in D39798 / R39798C4: got 'n.a.'
## Warning: Expecting numeric in D39799 / R39799C4: got 'n.a.'
## Warning: Expecting numeric in D39800 / R39800C4: got 'n.a.'
## Warning: Expecting numeric in D39801 / R39801C4: got 'n.a.'
## Warning: Expecting numeric in D39802 / R39802C4: got 'n.a.'
## Warning: Expecting numeric in D39803 / R39803C4: got 'n.a.'
## Warning: Expecting numeric in D39804 / R39804C4: got 'n.a.'
## Warning: Expecting numeric in D39805 / R39805C4: got 'n.a.'
## Warning: Expecting numeric in D39806 / R39806C4: got 'n.a.'
## Warning: Expecting numeric in D39807 / R39807C4: got 'n.a.'
## Warning: Expecting numeric in D39808 / R39808C4: got 'n.a.'
## Warning: Expecting numeric in D39809 / R39809C4: got 'n.a.'
## Warning: Expecting numeric in D39810 / R39810C4: got 'n.a.'
## Warning: Expecting numeric in D39811 / R39811C4: got 'n.a.'
## Warning: Expecting numeric in D39812 / R39812C4: got 'n.a.'
## Warning: Expecting numeric in D39813 / R39813C4: got 'n.a.'
## Warning: Expecting numeric in D39814 / R39814C4: got 'n.a.'
## Warning: Expecting numeric in D39815 / R39815C4: got 'n.a.'
## Warning: Expecting numeric in D39816 / R39816C4: got 'n.a.'
## Warning: Expecting numeric in D39817 / R39817C4: got 'n.a.'
## Warning: Expecting numeric in D39818 / R39818C4: got 'n.a.'
## Warning: Expecting numeric in D39819 / R39819C4: got 'n.a.'
## Warning: Expecting numeric in D39820 / R39820C4: got 'n.a.'
## Warning: Expecting numeric in D39821 / R39821C4: got 'n.a.'
## Warning: Expecting numeric in D39822 / R39822C4: got 'n.a.'
## Warning: Expecting numeric in D39823 / R39823C4: got 'n.a.'
## Warning: Expecting numeric in D39824 / R39824C4: got 'n.a.'
## Warning: Expecting numeric in D39825 / R39825C4: got 'n.a.'
## Warning: Expecting numeric in D39826 / R39826C4: got 'n.a.'
## Warning: Expecting numeric in D39827 / R39827C4: got 'n.a.'
## Warning: Expecting numeric in D39828 / R39828C4: got 'n.a.'
## Warning: Expecting numeric in D39829 / R39829C4: got 'n.a.'
## Warning: Expecting numeric in D39830 / R39830C4: got 'n.a.'
## Warning: Expecting numeric in D39831 / R39831C4: got 'n.a.'
## Warning: Expecting numeric in D39832 / R39832C4: got 'n.a.'
## Warning: Expecting numeric in D39833 / R39833C4: got 'n.a.'
## Warning: Expecting numeric in D39834 / R39834C4: got 'n.a.'
## Warning: Expecting numeric in D39835 / R39835C4: got 'n.a.'
## Warning: Expecting numeric in D39836 / R39836C4: got 'n.a.'
## Warning: Expecting numeric in D39837 / R39837C4: got 'n.a.'
## Warning: Expecting numeric in D39838 / R39838C4: got 'n.a.'
## Warning: Expecting numeric in D39839 / R39839C4: got 'n.a.'
## Warning: Expecting numeric in D39840 / R39840C4: got 'n.a.'
## Warning: Expecting numeric in D39841 / R39841C4: got 'n.a.'
## Warning: Expecting numeric in D39842 / R39842C4: got 'n.a.'
## Warning: Expecting numeric in D39843 / R39843C4: got 'n.a.'
## Warning: Expecting numeric in D39844 / R39844C4: got 'n.a.'
## Warning: Expecting numeric in D39845 / R39845C4: got 'n.a.'
## Warning: Expecting numeric in D39846 / R39846C4: got 'n.a.'
## Warning: Expecting numeric in D39847 / R39847C4: got 'n.a.'
## Warning: Expecting numeric in D39848 / R39848C4: got 'n.a.'
## Warning: Expecting numeric in D39849 / R39849C4: got 'n.a.'
## Warning: Expecting numeric in D39850 / R39850C4: got 'n.a.'
## Warning: Expecting numeric in D39851 / R39851C4: got 'n.a.'
## Warning: Expecting numeric in D39852 / R39852C4: got 'n.a.'
## Warning: Expecting numeric in D39853 / R39853C4: got 'n.a.'
## Warning: Expecting numeric in D39854 / R39854C4: got 'n.a.'
## Warning: Expecting numeric in D39855 / R39855C4: got 'n.a.'
## Warning: Expecting numeric in D39856 / R39856C4: got 'n.a.'
## Warning: Expecting numeric in D39857 / R39857C4: got 'n.a.'
## Warning: Expecting numeric in D39858 / R39858C4: got 'n.a.'
## Warning: Expecting numeric in D39859 / R39859C4: got 'n.a.'
## Warning: Expecting numeric in D39860 / R39860C4: got 'n.a.'
## Warning: Expecting numeric in D39861 / R39861C4: got 'n.a.'
## Warning: Expecting numeric in D39862 / R39862C4: got 'n.a.'
## Warning: Expecting numeric in D39863 / R39863C4: got 'n.a.'
## Warning: Expecting numeric in D39864 / R39864C4: got 'n.a.'
## Warning: Expecting numeric in D39865 / R39865C4: got 'n.a.'
## Warning: Expecting numeric in D39866 / R39866C4: got 'n.a.'
## Warning: Expecting numeric in D39867 / R39867C4: got 'n.a.'
## Warning: Expecting numeric in D39868 / R39868C4: got 'n.a.'
## Warning: Expecting numeric in D39869 / R39869C4: got 'n.a.'
## Warning: Expecting numeric in D39870 / R39870C4: got 'n.a.'
## Warning: Expecting numeric in D39871 / R39871C4: got 'n.a.'
## Warning: Expecting numeric in D39872 / R39872C4: got 'n.a.'
## Warning: Expecting numeric in D39873 / R39873C4: got 'n.a.'
## Warning: Expecting numeric in D39874 / R39874C4: got 'n.a.'
## Warning: Expecting numeric in D39875 / R39875C4: got 'n.a.'
## Warning: Expecting numeric in D39876 / R39876C4: got 'n.a.'
## Warning: Expecting numeric in D39877 / R39877C4: got 'n.a.'
## Warning: Expecting numeric in D39878 / R39878C4: got 'n.a.'
## Warning: Expecting numeric in D39879 / R39879C4: got 'n.a.'
## Warning: Expecting numeric in D39880 / R39880C4: got 'n.a.'
## Warning: Expecting numeric in D39881 / R39881C4: got 'n.a.'
## Warning: Expecting numeric in D39882 / R39882C4: got 'n.a.'
## Warning: Expecting numeric in D39883 / R39883C4: got 'n.a.'
## Warning: Expecting numeric in D39884 / R39884C4: got 'n.a.'
## Warning: Expecting numeric in D39885 / R39885C4: got 'n.a.'
## Warning: Expecting numeric in D39886 / R39886C4: got 'n.a.'
## Warning: Expecting numeric in D39887 / R39887C4: got 'n.a.'
## Warning: Expecting numeric in D39888 / R39888C4: got 'n.a.'
## Warning: Expecting numeric in D39889 / R39889C4: got 'n.a.'
## Warning: Expecting numeric in D39890 / R39890C4: got 'n.a.'
## Warning: Expecting numeric in D39891 / R39891C4: got 'n.a.'
## Warning: Expecting numeric in D39892 / R39892C4: got 'n.a.'
## Warning: Expecting numeric in D39893 / R39893C4: got 'n.a.'
## Warning: Expecting numeric in D39894 / R39894C4: got 'n.a.'
## Warning: Expecting numeric in D39895 / R39895C4: got 'n.a.'
## Warning: Expecting numeric in D39896 / R39896C4: got 'n.a.'
## Warning: Expecting numeric in D39897 / R39897C4: got 'n.a.'
## Warning: Expecting numeric in D39898 / R39898C4: got 'n.a.'
## Warning: Expecting numeric in D39899 / R39899C4: got 'n.a.'
## Warning: Expecting numeric in D39900 / R39900C4: got 'n.a.'
## Warning: Expecting numeric in D39901 / R39901C4: got 'n.a.'
## Warning: Expecting numeric in D39902 / R39902C4: got 'n.a.'
## Warning: Expecting numeric in D39903 / R39903C4: got 'n.a.'
## Warning: Expecting numeric in D39904 / R39904C4: got 'n.a.'
## Warning: Expecting numeric in D39905 / R39905C4: got 'n.a.'
## Warning: Expecting numeric in D39906 / R39906C4: got 'n.a.'
## Warning: Expecting numeric in D39907 / R39907C4: got 'n.a.'
## Warning: Expecting numeric in D39908 / R39908C4: got 'n.a.'
## Warning: Expecting numeric in D39909 / R39909C4: got 'n.a.'
## Warning: Expecting numeric in D39910 / R39910C4: got 'n.a.'
## Warning: Expecting numeric in D39911 / R39911C4: got 'n.a.'
## Warning: Expecting numeric in D39912 / R39912C4: got 'n.a.'
## Warning: Expecting numeric in D39913 / R39913C4: got 'n.a.'
## Warning: Expecting numeric in D39914 / R39914C4: got 'n.a.'
## Warning: Expecting numeric in D39915 / R39915C4: got 'n.a.'
## Warning: Expecting numeric in D39916 / R39916C4: got 'n.a.'
## Warning: Expecting numeric in D39917 / R39917C4: got 'n.a.'
## Warning: Expecting numeric in D39918 / R39918C4: got 'n.a.'
## Warning: Expecting numeric in D39919 / R39919C4: got 'n.a.'
## Warning: Expecting numeric in D39920 / R39920C4: got 'n.a.'
## Warning: Expecting numeric in D39921 / R39921C4: got 'n.a.'
## Warning: Expecting numeric in D39922 / R39922C4: got 'n.a.'
## Warning: Expecting numeric in D39923 / R39923C4: got 'n.a.'
## Warning: Expecting numeric in D39924 / R39924C4: got 'n.a.'
## Warning: Expecting numeric in D39925 / R39925C4: got 'n.a.'
## Warning: Expecting numeric in D39926 / R39926C4: got 'n.a.'
## Warning: Expecting numeric in D39927 / R39927C4: got 'n.a.'
## Warning: Expecting numeric in D39928 / R39928C4: got 'n.a.'
## Warning: Expecting numeric in D39929 / R39929C4: got 'n.a.'
## Warning: Expecting numeric in D39930 / R39930C4: got 'n.a.'
## Warning: Expecting numeric in D39931 / R39931C4: got 'n.a.'
## Warning: Expecting numeric in D39932 / R39932C4: got 'n.a.'
## Warning: Expecting numeric in D39933 / R39933C4: got 'n.a.'
## Warning: Expecting numeric in D39934 / R39934C4: got 'n.a.'
## Warning: Expecting numeric in D39935 / R39935C4: got 'n.a.'
## Warning: Expecting numeric in D39936 / R39936C4: got 'n.a.'
## Warning: Expecting numeric in D39937 / R39937C4: got 'n.a.'
## Warning: Expecting numeric in D39938 / R39938C4: got 'n.a.'
## Warning: Expecting numeric in D39939 / R39939C4: got 'n.a.'
## Warning: Expecting numeric in D39940 / R39940C4: got 'n.a.'
## Warning: Expecting numeric in D39941 / R39941C4: got 'n.a.'
## Warning: Expecting numeric in D39942 / R39942C4: got 'n.a.'
## Warning: Expecting numeric in D39943 / R39943C4: got 'n.a.'
## Warning: Expecting numeric in D39944 / R39944C4: got 'n.a.'
## Warning: Expecting numeric in D39945 / R39945C4: got 'n.a.'
## Warning: Expecting numeric in D39946 / R39946C4: got 'n.a.'
## Warning: Expecting numeric in D39947 / R39947C4: got 'n.a.'
## Warning: Expecting numeric in D39948 / R39948C4: got 'n.a.'
## Warning: Expecting numeric in D39949 / R39949C4: got 'n.a.'
## Warning: Expecting numeric in D39950 / R39950C4: got 'n.a.'
## Warning: Expecting numeric in D39951 / R39951C4: got 'n.a.'
## Warning: Expecting numeric in D39952 / R39952C4: got 'n.a.'
## Warning: Expecting numeric in D39953 / R39953C4: got 'n.a.'
## Warning: Expecting numeric in D39954 / R39954C4: got 'n.a.'
## Warning: Expecting numeric in D39955 / R39955C4: got 'n.a.'
## Warning: Expecting numeric in D39956 / R39956C4: got 'n.a.'
## Warning: Expecting numeric in D39957 / R39957C4: got 'n.a.'
## Warning: Expecting numeric in D39958 / R39958C4: got 'n.a.'
## Warning: Expecting numeric in D39959 / R39959C4: got 'n.a.'
## Warning: Expecting numeric in D39960 / R39960C4: got 'n.a.'
## Warning: Expecting numeric in D39961 / R39961C4: got 'n.a.'
## Warning: Expecting numeric in D39962 / R39962C4: got 'n.a.'
## Warning: Expecting numeric in D39963 / R39963C4: got 'n.a.'
## Warning: Expecting numeric in D39964 / R39964C4: got 'n.a.'
## Warning: Expecting numeric in D39965 / R39965C4: got 'n.a.'
## Warning: Expecting numeric in D39966 / R39966C4: got 'n.a.'
## Warning: Expecting numeric in D39967 / R39967C4: got 'n.a.'
## Warning: Expecting numeric in D39968 / R39968C4: got 'n.a.'
## Warning: Expecting numeric in D39969 / R39969C4: got 'n.a.'
## Warning: Expecting numeric in D39970 / R39970C4: got 'n.a.'
## Warning: Expecting numeric in D39971 / R39971C4: got 'n.a.'
## Warning: Expecting numeric in D39972 / R39972C4: got 'n.a.'
## Warning: Expecting numeric in D39973 / R39973C4: got 'n.a.'
## Warning: Expecting numeric in D39974 / R39974C4: got 'n.a.'
## Warning: Expecting numeric in D39975 / R39975C4: got 'n.a.'
## Warning: Expecting numeric in D39976 / R39976C4: got 'n.a.'
## Warning: Expecting numeric in D39977 / R39977C4: got 'n.a.'
## Warning: Expecting numeric in D39978 / R39978C4: got 'n.a.'
## Warning: Expecting numeric in D39979 / R39979C4: got 'n.a.'
## Warning: Expecting numeric in D39980 / R39980C4: got 'n.a.'
## Warning: Expecting numeric in D39981 / R39981C4: got 'n.a.'
## Warning: Expecting numeric in D39982 / R39982C4: got 'n.a.'
## Warning: Expecting numeric in D39983 / R39983C4: got 'n.a.'
## Warning: Expecting numeric in D39984 / R39984C4: got 'n.a.'
## Warning: Expecting numeric in D39985 / R39985C4: got 'n.a.'
## Warning: Expecting numeric in D39986 / R39986C4: got 'n.a.'
## Warning: Expecting numeric in D39987 / R39987C4: got 'n.a.'
## Warning: Expecting numeric in D39988 / R39988C4: got 'n.a.'
## Warning: Expecting numeric in D39989 / R39989C4: got 'n.a.'
## Warning: Expecting numeric in D39990 / R39990C4: got 'n.a.'
## Warning: Expecting numeric in D39991 / R39991C4: got 'n.a.'
## Warning: Expecting numeric in D39992 / R39992C4: got 'n.a.'
## Warning: Expecting numeric in D39993 / R39993C4: got 'n.a.'
## Warning: Expecting numeric in D39994 / R39994C4: got 'n.a.'
## Warning: Expecting numeric in D39995 / R39995C4: got 'n.a.'
## Warning: Expecting numeric in D39996 / R39996C4: got 'n.a.'
## Warning: Expecting numeric in D39997 / R39997C4: got 'n.a.'
## Warning: Expecting numeric in D39998 / R39998C4: got 'n.a.'
## Warning: Expecting numeric in D39999 / R39999C4: got 'n.a.'
## Warning: Expecting numeric in D40000 / R40000C4: got 'n.a.'
## Warning: Expecting numeric in D40001 / R40001C4: got 'n.a.'
## Warning: Expecting numeric in D40002 / R40002C4: got 'n.a.'
## Warning: Expecting numeric in D40003 / R40003C4: got 'n.a.'
## Warning: Expecting numeric in D40004 / R40004C4: got 'n.a.'
## Warning: Expecting numeric in D40005 / R40005C4: got 'n.a.'
## Warning: Expecting numeric in D40006 / R40006C4: got 'n.a.'
## Warning: Expecting numeric in D40007 / R40007C4: got 'n.a.'
## Warning: Expecting numeric in D40008 / R40008C4: got 'n.a.'
## Warning: Expecting numeric in D40009 / R40009C4: got 'n.a.'
## Warning: Expecting numeric in D40010 / R40010C4: got 'n.a.'
## Warning: Expecting numeric in D40011 / R40011C4: got 'n.a.'
## Warning: Expecting numeric in D40012 / R40012C4: got 'n.a.'
## Warning: Expecting numeric in D40013 / R40013C4: got 'n.a.'
## Warning: Expecting numeric in D40014 / R40014C4: got 'n.a.'
## Warning: Expecting numeric in D40015 / R40015C4: got 'n.a.'
## Warning: Expecting numeric in D40016 / R40016C4: got 'n.a.'
## Warning: Expecting numeric in D40017 / R40017C4: got 'n.a.'
## Warning: Expecting numeric in D40018 / R40018C4: got 'n.a.'
## Warning: Expecting numeric in D40019 / R40019C4: got 'n.a.'
## Warning: Expecting numeric in D40020 / R40020C4: got 'n.a.'
## Warning: Expecting numeric in D40021 / R40021C4: got 'n.a.'
## Warning: Expecting numeric in D40022 / R40022C4: got 'n.a.'
## Warning: Expecting numeric in D40023 / R40023C4: got 'n.a.'
## Warning: Expecting numeric in D40024 / R40024C4: got 'n.a.'
## Warning: Expecting numeric in D40025 / R40025C4: got 'n.a.'
## Warning: Expecting numeric in D40026 / R40026C4: got 'n.a.'
## Warning: Expecting numeric in D40027 / R40027C4: got 'n.a.'
## Warning: Expecting numeric in D40028 / R40028C4: got 'n.a.'
## Warning: Expecting numeric in D40029 / R40029C4: got 'n.a.'
## Warning: Expecting numeric in D40030 / R40030C4: got 'n.a.'
## Warning: Expecting numeric in D40031 / R40031C4: got 'n.a.'
## Warning: Expecting numeric in D40032 / R40032C4: got 'n.a.'
## Warning: Expecting numeric in D40033 / R40033C4: got 'n.a.'
## Warning: Expecting numeric in D40034 / R40034C4: got 'n.a.'
## Warning: Expecting numeric in D40035 / R40035C4: got 'n.a.'
## Warning: Expecting numeric in D40036 / R40036C4: got 'n.a.'
## Warning: Expecting numeric in D40037 / R40037C4: got 'n.a.'
## Warning: Expecting numeric in D40038 / R40038C4: got 'n.a.'
## Warning: Expecting numeric in D40039 / R40039C4: got 'n.a.'
## Warning: Expecting numeric in D40040 / R40040C4: got 'n.a.'
## Warning: Expecting numeric in D40041 / R40041C4: got 'n.a.'
## Warning: Expecting numeric in D40042 / R40042C4: got 'n.a.'
## Warning: Expecting numeric in D40043 / R40043C4: got 'n.a.'
## Warning: Expecting numeric in D40044 / R40044C4: got 'n.a.'
## Warning: Expecting numeric in D40045 / R40045C4: got 'n.a.'
## Warning: Expecting numeric in D40046 / R40046C4: got 'n.a.'
## Warning: Expecting numeric in D40047 / R40047C4: got 'n.a.'
## Warning: Expecting numeric in D40048 / R40048C4: got 'n.a.'
## Warning: Expecting numeric in D40049 / R40049C4: got 'n.a.'
## Warning: Expecting numeric in D40050 / R40050C4: got 'n.a.'
## Warning: Expecting numeric in D40051 / R40051C4: got 'n.a.'
## Warning: Expecting numeric in D40052 / R40052C4: got 'n.a.'
## Warning: Expecting numeric in D40053 / R40053C4: got 'n.a.'
## Warning: Expecting numeric in D40054 / R40054C4: got 'n.a.'
## Warning: Expecting numeric in D40055 / R40055C4: got 'n.a.'
## Warning: Expecting numeric in D40056 / R40056C4: got 'n.a.'
## Warning: Expecting numeric in D40057 / R40057C4: got 'n.a.'
## Warning: Expecting numeric in D40058 / R40058C4: got 'n.a.'
## Warning: Expecting numeric in D40059 / R40059C4: got 'n.a.'
## Warning: Expecting numeric in D40060 / R40060C4: got 'n.a.'
## Warning: Expecting numeric in D40061 / R40061C4: got 'n.a.'
## Warning: Expecting numeric in D40062 / R40062C4: got 'n.a.'
## Warning: Expecting numeric in D40063 / R40063C4: got 'n.a.'
## Warning: Expecting numeric in D40064 / R40064C4: got 'n.a.'
## Warning: Expecting numeric in D40065 / R40065C4: got 'n.a.'
## Warning: Expecting numeric in D40066 / R40066C4: got 'n.a.'
## Warning: Expecting numeric in D40067 / R40067C4: got 'n.a.'
## Warning: Expecting numeric in D40068 / R40068C4: got 'n.a.'
## Warning: Expecting numeric in D40069 / R40069C4: got 'n.a.'
## Warning: Expecting numeric in D40070 / R40070C4: got 'n.a.'
## Warning: Expecting numeric in D40071 / R40071C4: got 'n.a.'
## Warning: Expecting numeric in D40072 / R40072C4: got 'n.a.'
## Warning: Expecting numeric in D40073 / R40073C4: got 'n.a.'
## Warning: Expecting numeric in D40074 / R40074C4: got 'n.a.'
## Warning: Expecting numeric in D40075 / R40075C4: got 'n.a.'
## Warning: Expecting numeric in D40076 / R40076C4: got 'n.a.'
## Warning: Expecting numeric in D40077 / R40077C4: got 'n.a.'
## Warning: Expecting numeric in D40078 / R40078C4: got 'n.a.'
## Warning: Expecting numeric in D40079 / R40079C4: got 'n.a.'
## Warning: Expecting numeric in D40080 / R40080C4: got 'n.a.'
## Warning: Expecting numeric in D40081 / R40081C4: got 'n.a.'
## Warning: Expecting numeric in D40082 / R40082C4: got 'n.a.'
## Warning: Expecting numeric in D40083 / R40083C4: got 'n.a.'
## Warning: Expecting numeric in D40084 / R40084C4: got 'n.a.'
## Warning: Expecting numeric in D40085 / R40085C4: got 'n.a.'
## Warning: Expecting numeric in D40086 / R40086C4: got 'n.a.'
## Warning: Expecting numeric in D40087 / R40087C4: got 'n.a.'
## Warning: Expecting numeric in D40088 / R40088C4: got 'n.a.'
## Warning: Expecting numeric in D40089 / R40089C4: got 'n.a.'
## Warning: Expecting numeric in D40090 / R40090C4: got 'n.a.'
## Warning: Expecting numeric in D40091 / R40091C4: got 'n.a.'
## Warning: Expecting numeric in D40092 / R40092C4: got 'n.a.'
## Warning: Expecting numeric in D40093 / R40093C4: got 'n.a.'
## Warning: Expecting numeric in D40094 / R40094C4: got 'n.a.'
## Warning: Expecting numeric in D40095 / R40095C4: got 'n.a.'
## Warning: Expecting numeric in D40096 / R40096C4: got 'n.a.'
## Warning: Expecting numeric in D40097 / R40097C4: got 'n.a.'
## Warning: Expecting numeric in D40098 / R40098C4: got 'n.a.'
## Warning: Expecting numeric in D40099 / R40099C4: got 'n.a.'
## Warning: Expecting numeric in D40100 / R40100C4: got 'n.a.'
## Warning: Expecting numeric in D40101 / R40101C4: got 'n.a.'
## Warning: Expecting numeric in D40102 / R40102C4: got 'n.a.'
## Warning: Expecting numeric in D40103 / R40103C4: got 'n.a.'
## Warning: Expecting numeric in D40104 / R40104C4: got 'n.a.'
## Warning: Expecting numeric in D40105 / R40105C4: got 'n.a.'
## Warning: Expecting numeric in D40106 / R40106C4: got 'n.a.'
## Warning: Expecting numeric in D40107 / R40107C4: got 'n.a.'
## Warning: Expecting numeric in D40108 / R40108C4: got 'n.a.'
## Warning: Expecting numeric in D40109 / R40109C4: got 'n.a.'
## Warning: Expecting numeric in D40110 / R40110C4: got 'n.a.'
## Warning: Expecting numeric in D40111 / R40111C4: got 'n.a.'
## Warning: Expecting numeric in D40112 / R40112C4: got 'n.a.'
## Warning: Expecting numeric in D40113 / R40113C4: got 'n.a.'
## Warning: Expecting numeric in D40114 / R40114C4: got 'n.a.'
## Warning: Expecting numeric in D40115 / R40115C4: got 'n.a.'
## Warning: Expecting numeric in D40116 / R40116C4: got 'n.a.'
## Warning: Expecting numeric in D40117 / R40117C4: got 'n.a.'
## Warning: Expecting numeric in D40118 / R40118C4: got 'n.a.'
## Warning: Expecting numeric in D40119 / R40119C4: got 'n.a.'
## Warning: Expecting numeric in D40120 / R40120C4: got 'n.a.'
## Warning: Expecting numeric in D40121 / R40121C4: got 'n.a.'
## Warning: Expecting numeric in D40122 / R40122C4: got 'n.a.'
## Warning: Expecting numeric in D40123 / R40123C4: got 'n.a.'
## Warning: Expecting numeric in D40124 / R40124C4: got 'n.a.'
## Warning: Expecting numeric in D40125 / R40125C4: got 'n.a.'
## Warning: Expecting numeric in D40126 / R40126C4: got 'n.a.'
## Warning: Expecting numeric in D40127 / R40127C4: got 'n.a.'
## Warning: Expecting numeric in D40128 / R40128C4: got 'n.a.'
## Warning: Expecting numeric in D40129 / R40129C4: got 'n.a.'
## Warning: Expecting numeric in D40130 / R40130C4: got 'n.a.'
## Warning: Expecting numeric in D40131 / R40131C4: got 'n.a.'
## Warning: Expecting numeric in D40132 / R40132C4: got 'n.a.'
## Warning: Expecting numeric in D40133 / R40133C4: got 'n.a.'
## Warning: Expecting numeric in D40134 / R40134C4: got 'n.a.'
## Warning: Expecting numeric in D40135 / R40135C4: got 'n.a.'
## Warning: Expecting numeric in D40136 / R40136C4: got 'n.a.'
## Warning: Expecting numeric in D40137 / R40137C4: got 'n.a.'
## Warning: Expecting numeric in D40138 / R40138C4: got 'n.a.'
## Warning: Expecting numeric in D40139 / R40139C4: got 'n.a.'
## Warning: Expecting numeric in D40140 / R40140C4: got 'n.a.'
## Warning: Expecting numeric in D40141 / R40141C4: got 'n.a.'
## Warning: Expecting numeric in D40142 / R40142C4: got 'n.a.'
## Warning: Expecting numeric in D40143 / R40143C4: got 'n.a.'
## Warning: Expecting numeric in D40144 / R40144C4: got 'n.a.'
## Warning: Expecting numeric in D40145 / R40145C4: got 'n.a.'
## Warning: Expecting numeric in D40146 / R40146C4: got 'n.a.'
## Warning: Expecting numeric in D40147 / R40147C4: got 'n.a.'
## Warning: Expecting numeric in D40148 / R40148C4: got 'n.a.'
## Warning: Expecting numeric in D40149 / R40149C4: got 'n.a.'
## Warning: Expecting numeric in D40150 / R40150C4: got 'n.a.'
## Warning: Expecting numeric in D40151 / R40151C4: got 'n.a.'
## Warning: Expecting numeric in D40152 / R40152C4: got 'n.a.'
## Warning: Expecting numeric in D40153 / R40153C4: got 'n.a.'
## Warning: Expecting numeric in D40154 / R40154C4: got 'n.a.'
## Warning: Expecting numeric in D40155 / R40155C4: got 'n.a.'
## Warning: Expecting numeric in D40156 / R40156C4: got 'n.a.'
## Warning: Expecting numeric in D40157 / R40157C4: got 'n.a.'
## Warning: Expecting numeric in D40158 / R40158C4: got 'n.a.'
## Warning: Expecting numeric in D40159 / R40159C4: got 'n.a.'
## Warning: Expecting numeric in D40160 / R40160C4: got 'n.a.'
## Warning: Expecting numeric in D40161 / R40161C4: got 'n.a.'
## Warning: Expecting numeric in D40162 / R40162C4: got 'n.a.'
## Warning: Expecting numeric in D40163 / R40163C4: got 'n.a.'
## Warning: Expecting numeric in D40164 / R40164C4: got 'n.a.'
## Warning: Expecting numeric in D40165 / R40165C4: got 'n.a.'
## Warning: Expecting numeric in D40166 / R40166C4: got 'n.a.'
## Warning: Expecting numeric in D40167 / R40167C4: got 'n.a.'
## Warning: Expecting numeric in D40168 / R40168C4: got 'n.a.'
## Warning: Expecting numeric in D40169 / R40169C4: got 'n.a.'
## Warning: Expecting numeric in D40170 / R40170C4: got 'n.a.'
## Warning: Expecting numeric in D40171 / R40171C4: got 'n.a.'
## Warning: Expecting numeric in D40172 / R40172C4: got 'n.a.'
## Warning: Expecting numeric in D40173 / R40173C4: got 'n.a.'
## Warning: Expecting numeric in D40174 / R40174C4: got 'n.a.'
## Warning: Expecting numeric in D40175 / R40175C4: got 'n.a.'
## Warning: Expecting numeric in D40176 / R40176C4: got 'n.a.'
## Warning: Expecting numeric in D40177 / R40177C4: got 'n.a.'
## Warning: Expecting numeric in D40178 / R40178C4: got 'n.a.'
## Warning: Expecting numeric in D40179 / R40179C4: got 'n.a.'
## Warning: Expecting numeric in D40180 / R40180C4: got 'n.a.'
## Warning: Expecting numeric in D40181 / R40181C4: got 'n.a.'
## Warning: Expecting numeric in D40182 / R40182C4: got 'n.a.'
## Warning: Expecting numeric in D40183 / R40183C4: got 'n.a.'
## Warning: Expecting numeric in D40184 / R40184C4: got 'n.a.'
## Warning: Expecting numeric in D40185 / R40185C4: got 'n.a.'
## Warning: Expecting numeric in D40186 / R40186C4: got 'n.a.'
## Warning: Expecting numeric in D40187 / R40187C4: got 'n.a.'
## Warning: Expecting numeric in D40188 / R40188C4: got 'n.a.'
## Warning: Expecting numeric in D40189 / R40189C4: got 'n.a.'
## Warning: Expecting numeric in D40190 / R40190C4: got 'n.a.'
## Warning: Expecting numeric in D40191 / R40191C4: got 'n.a.'
## Warning: Expecting numeric in D40192 / R40192C4: got 'n.a.'
## Warning: Expecting numeric in D40193 / R40193C4: got 'n.a.'
## Warning: Expecting numeric in D40194 / R40194C4: got 'n.a.'
## Warning: Expecting numeric in D40195 / R40195C4: got 'n.a.'
## Warning: Expecting numeric in D40196 / R40196C4: got 'n.a.'
## Warning: Expecting numeric in D40197 / R40197C4: got 'n.a.'
## Warning: Expecting numeric in D40198 / R40198C4: got 'n.a.'
## Warning: Expecting numeric in D40199 / R40199C4: got 'n.a.'
## Warning: Expecting numeric in D40200 / R40200C4: got 'n.a.'
## Warning: Expecting numeric in D40201 / R40201C4: got 'n.a.'
## Warning: Expecting numeric in D40202 / R40202C4: got 'n.a.'
## Warning: Expecting numeric in D40203 / R40203C4: got 'n.a.'
## Warning: Expecting numeric in D40204 / R40204C4: got 'n.a.'
## Warning: Expecting numeric in D40205 / R40205C4: got 'n.a.'
## Warning: Expecting numeric in D40206 / R40206C4: got 'n.a.'
## Warning: Expecting numeric in D40207 / R40207C4: got 'n.a.'
## Warning: Expecting numeric in D40208 / R40208C4: got 'n.a.'
## Warning: Expecting numeric in D40209 / R40209C4: got 'n.a.'
## Warning: Expecting numeric in D40210 / R40210C4: got 'n.a.'
## Warning: Expecting numeric in D40211 / R40211C4: got 'n.a.'
## Warning: Expecting numeric in D40212 / R40212C4: got 'n.a.'
## Warning: Expecting numeric in D40213 / R40213C4: got 'n.a.'
## Warning: Expecting numeric in D40214 / R40214C4: got 'n.a.'
## Warning: Expecting numeric in D40215 / R40215C4: got 'n.a.'
## Warning: Expecting numeric in D40216 / R40216C4: got 'n.a.'
## Warning: Expecting numeric in D40217 / R40217C4: got 'n.a.'
## Warning: Expecting numeric in D40218 / R40218C4: got 'n.a.'
## Warning: Expecting numeric in D40219 / R40219C4: got 'n.a.'
## Warning: Expecting numeric in D40220 / R40220C4: got 'n.a.'
## Warning: Expecting numeric in D40221 / R40221C4: got 'n.a.'
## Warning: Expecting numeric in D40222 / R40222C4: got 'n.a.'
## Warning: Expecting numeric in D40223 / R40223C4: got 'n.a.'
## Warning: Expecting numeric in D40224 / R40224C4: got 'n.a.'
## Warning: Expecting numeric in D40225 / R40225C4: got 'n.a.'
## Warning: Expecting numeric in D40226 / R40226C4: got 'n.a.'
## Warning: Expecting numeric in D40227 / R40227C4: got 'n.a.'
## Warning: Expecting numeric in D40228 / R40228C4: got 'n.a.'
## Warning: Expecting numeric in D40229 / R40229C4: got 'n.a.'
## Warning: Expecting numeric in D40230 / R40230C4: got 'n.a.'
## Warning: Expecting numeric in D40231 / R40231C4: got 'n.a.'
## Warning: Expecting numeric in D40232 / R40232C4: got 'n.a.'
## Warning: Expecting numeric in D40233 / R40233C4: got 'n.a.'
## Warning: Expecting numeric in D40234 / R40234C4: got 'n.a.'
## Warning: Expecting numeric in D40235 / R40235C4: got 'n.a.'
## Warning: Expecting numeric in D40236 / R40236C4: got 'n.a.'
## Warning: Expecting numeric in D40237 / R40237C4: got 'n.a.'
## Warning: Expecting numeric in D40238 / R40238C4: got 'n.a.'
## Warning: Expecting numeric in D40239 / R40239C4: got 'n.a.'
## Warning: Expecting numeric in D40240 / R40240C4: got 'n.a.'
## Warning: Expecting numeric in D40241 / R40241C4: got 'n.a.'
## Warning: Expecting numeric in D40242 / R40242C4: got 'n.a.'
## Warning: Expecting numeric in D40243 / R40243C4: got 'n.a.'
## Warning: Expecting numeric in D40244 / R40244C4: got 'n.a.'
## Warning: Expecting numeric in D40245 / R40245C4: got 'n.a.'
## Warning: Expecting numeric in D40246 / R40246C4: got 'n.a.'
## Warning: Expecting numeric in D40247 / R40247C4: got 'n.a.'
## Warning: Expecting numeric in D40248 / R40248C4: got 'n.a.'
## Warning: Expecting numeric in D40249 / R40249C4: got 'n.a.'
## Warning: Expecting numeric in D40250 / R40250C4: got 'n.a.'
## Warning: Expecting numeric in D40251 / R40251C4: got 'n.a.'
## Warning: Expecting numeric in D40252 / R40252C4: got 'n.a.'
## Warning: Expecting numeric in D40253 / R40253C4: got 'n.a.'
## Warning: Expecting numeric in D40254 / R40254C4: got 'n.a.'
## Warning: Expecting numeric in D40255 / R40255C4: got 'n.a.'
## Warning: Expecting numeric in D40256 / R40256C4: got 'n.a.'
## Warning: Expecting numeric in D40257 / R40257C4: got 'n.a.'
## Warning: Expecting numeric in D40258 / R40258C4: got 'n.a.'
## Warning: Expecting numeric in D40259 / R40259C4: got 'n.a.'
## Warning: Expecting numeric in D40260 / R40260C4: got 'n.a.'
## Warning: Expecting numeric in D40261 / R40261C4: got 'n.a.'
## Warning: Expecting numeric in D40262 / R40262C4: got 'n.a.'
## Warning: Expecting numeric in D40263 / R40263C4: got 'n.a.'
## Warning: Expecting numeric in D40264 / R40264C4: got 'n.a.'
## Warning: Expecting numeric in D40265 / R40265C4: got 'n.a.'
## Warning: Expecting numeric in D40266 / R40266C4: got 'n.a.'
## Warning: Expecting numeric in D40267 / R40267C4: got 'n.a.'
## Warning: Expecting numeric in D40268 / R40268C4: got 'n.a.'
## Warning: Expecting numeric in D40269 / R40269C4: got 'n.a.'
## Warning: Expecting numeric in D40270 / R40270C4: got 'n.a.'
## Warning: Expecting numeric in D40271 / R40271C4: got 'n.a.'
## Warning: Expecting numeric in D40272 / R40272C4: got 'n.a.'
## Warning: Expecting numeric in D40273 / R40273C4: got 'n.a.'
## Warning: Expecting numeric in D40274 / R40274C4: got 'n.a.'
## Warning: Expecting numeric in D40275 / R40275C4: got 'n.a.'
## Warning: Expecting numeric in D40276 / R40276C4: got 'n.a.'
## Warning: Expecting numeric in D40277 / R40277C4: got 'n.a.'
## Warning: Expecting numeric in D40278 / R40278C4: got 'n.a.'
## Warning: Expecting numeric in D40279 / R40279C4: got 'n.a.'
## Warning: Expecting numeric in D40280 / R40280C4: got 'n.a.'
## Warning: Expecting numeric in D40281 / R40281C4: got 'n.a.'
## Warning: Expecting numeric in D40282 / R40282C4: got 'n.a.'
## Warning: Expecting numeric in D40283 / R40283C4: got 'n.a.'
## Warning: Expecting numeric in D40284 / R40284C4: got 'n.a.'
## Warning: Expecting numeric in D40285 / R40285C4: got 'n.a.'
## Warning: Expecting numeric in D40286 / R40286C4: got 'n.a.'
## Warning: Expecting numeric in D40287 / R40287C4: got 'n.a.'
## Warning: Expecting numeric in D40288 / R40288C4: got 'n.a.'
## Warning: Expecting numeric in D40289 / R40289C4: got 'n.a.'
## Warning: Expecting numeric in D40290 / R40290C4: got 'n.a.'
## Warning: Expecting numeric in D40291 / R40291C4: got 'n.a.'
## Warning: Expecting numeric in D40292 / R40292C4: got 'n.a.'
## Warning: Expecting numeric in D40293 / R40293C4: got 'n.a.'
## Warning: Expecting numeric in D40294 / R40294C4: got 'n.a.'
## Warning: Expecting numeric in D40295 / R40295C4: got 'n.a.'
## Warning: Expecting numeric in D40296 / R40296C4: got 'n.a.'
## Warning: Expecting numeric in D40297 / R40297C4: got 'n.a.'
## Warning: Expecting numeric in D40298 / R40298C4: got 'n.a.'
## Warning: Expecting numeric in D40299 / R40299C4: got 'n.a.'
## Warning: Expecting numeric in D40300 / R40300C4: got 'n.a.'
## Warning: Expecting numeric in D40301 / R40301C4: got 'n.a.'
## Warning: Expecting numeric in D40302 / R40302C4: got 'n.a.'
## Warning: Expecting numeric in D40303 / R40303C4: got 'n.a.'
## Warning: Expecting numeric in D40304 / R40304C4: got 'n.a.'
## Warning: Expecting numeric in D40305 / R40305C4: got 'n.a.'
## Warning: Expecting numeric in D40306 / R40306C4: got 'n.a.'
## Warning: Expecting numeric in D40307 / R40307C4: got 'n.a.'
## Warning: Expecting numeric in D40308 / R40308C4: got 'n.a.'
## Warning: Expecting numeric in D40309 / R40309C4: got 'n.a.'
## Warning: Expecting numeric in D40310 / R40310C4: got 'n.a.'
## Warning: Expecting numeric in D40311 / R40311C4: got 'n.a.'
## Warning: Expecting numeric in D40312 / R40312C4: got 'n.a.'
## Warning: Expecting numeric in D40313 / R40313C4: got 'n.a.'
## Warning: Expecting numeric in D40314 / R40314C4: got 'n.a.'
## Warning: Expecting numeric in D40315 / R40315C4: got 'n.a.'
## Warning: Expecting numeric in D40316 / R40316C4: got 'n.a.'
## Warning: Expecting numeric in D40317 / R40317C4: got 'n.a.'
## Warning: Expecting numeric in D40318 / R40318C4: got 'n.a.'
## Warning: Expecting numeric in D40319 / R40319C4: got 'n.a.'
## Warning: Expecting numeric in D40320 / R40320C4: got 'n.a.'
## Warning: Expecting numeric in D40321 / R40321C4: got 'n.a.'
## Warning: Expecting numeric in D40322 / R40322C4: got 'n.a.'
## Warning: Expecting numeric in D40323 / R40323C4: got 'n.a.'
## Warning: Expecting numeric in D40324 / R40324C4: got 'n.a.'
## Warning: Expecting numeric in D40325 / R40325C4: got 'n.a.'
## Warning: Expecting numeric in D40326 / R40326C4: got 'n.a.'
## Warning: Expecting numeric in D40327 / R40327C4: got 'n.a.'
## Warning: Expecting numeric in D40328 / R40328C4: got 'n.a.'
## Warning: Expecting numeric in D40329 / R40329C4: got 'n.a.'
## Warning: Expecting numeric in D40330 / R40330C4: got 'n.a.'
## Warning: Expecting numeric in D40331 / R40331C4: got 'n.a.'
## Warning: Expecting numeric in D40332 / R40332C4: got 'n.a.'
## Warning: Expecting numeric in D40333 / R40333C4: got 'n.a.'
## Warning: Expecting numeric in D40334 / R40334C4: got 'n.a.'
## Warning: Expecting numeric in D40335 / R40335C4: got 'n.a.'
## Warning: Expecting numeric in D40336 / R40336C4: got 'n.a.'
## Warning: Expecting numeric in D40337 / R40337C4: got 'n.a.'
## Warning: Expecting numeric in D40338 / R40338C4: got 'n.a.'
## Warning: Expecting numeric in D40339 / R40339C4: got 'n.a.'
## Warning: Expecting numeric in D40340 / R40340C4: got 'n.a.'
## Warning: Expecting numeric in D40341 / R40341C4: got 'n.a.'
## Warning: Expecting numeric in D40342 / R40342C4: got 'n.a.'
## Warning: Expecting numeric in D40343 / R40343C4: got 'n.a.'
## Warning: Expecting numeric in D40344 / R40344C4: got 'n.a.'
## Warning: Expecting numeric in D40345 / R40345C4: got 'n.a.'
## Warning: Expecting numeric in D40346 / R40346C4: got 'n.a.'
## Warning: Expecting numeric in D40347 / R40347C4: got 'n.a.'
## Warning: Expecting numeric in D40348 / R40348C4: got 'n.a.'
## Warning: Expecting numeric in D40349 / R40349C4: got 'n.a.'
## Warning: Expecting numeric in D40350 / R40350C4: got 'n.a.'
## Warning: Expecting numeric in D40351 / R40351C4: got 'n.a.'
## Warning: Expecting numeric in D40352 / R40352C4: got 'n.a.'
## Warning: Expecting numeric in D40353 / R40353C4: got 'n.a.'
## Warning: Expecting numeric in D40354 / R40354C4: got 'n.a.'
## Warning: Expecting numeric in D40355 / R40355C4: got 'n.a.'
## Warning: Expecting numeric in D40356 / R40356C4: got 'n.a.'
## Warning: Expecting numeric in D40357 / R40357C4: got 'n.a.'
## Warning: Expecting numeric in D40358 / R40358C4: got 'n.a.'
## Warning: Expecting numeric in D40359 / R40359C4: got 'n.a.'
## Warning: Expecting numeric in D40360 / R40360C4: got 'n.a.'
## Warning: Expecting numeric in D40361 / R40361C4: got 'n.a.'
## Warning: Expecting numeric in D40362 / R40362C4: got 'n.a.'
## Warning: Expecting numeric in D40363 / R40363C4: got 'n.a.'
## Warning: Expecting numeric in D40364 / R40364C4: got 'n.a.'
## Warning: Expecting numeric in D40365 / R40365C4: got 'n.a.'
## Warning: Expecting numeric in D40366 / R40366C4: got 'n.a.'
## Warning: Expecting numeric in D40367 / R40367C4: got 'n.a.'
## Warning: Expecting numeric in D40368 / R40368C4: got 'n.a.'
## Warning: Expecting numeric in D40369 / R40369C4: got 'n.a.'
## Warning: Expecting numeric in D40370 / R40370C4: got 'n.a.'
## Warning: Expecting numeric in D40371 / R40371C4: got 'n.a.'
## Warning: Expecting numeric in D40372 / R40372C4: got 'n.a.'
## Warning: Expecting numeric in D40373 / R40373C4: got 'n.a.'
## Warning: Expecting numeric in D40374 / R40374C4: got 'n.a.'
## Warning: Expecting numeric in D40375 / R40375C4: got 'n.a.'
## Warning: Expecting numeric in D40376 / R40376C4: got 'n.a.'
## Warning: Expecting numeric in D40377 / R40377C4: got 'n.a.'
## Warning: Expecting numeric in D40378 / R40378C4: got 'n.a.'
## Warning: Expecting numeric in D40379 / R40379C4: got 'n.a.'
## Warning: Expecting numeric in D40380 / R40380C4: got 'n.a.'
## Warning: Expecting numeric in D40381 / R40381C4: got 'n.a.'
## Warning: Expecting numeric in D40382 / R40382C4: got 'n.a.'
## Warning: Expecting numeric in D40383 / R40383C4: got 'n.a.'
## Warning: Expecting numeric in D40384 / R40384C4: got 'n.a.'
## Warning: Expecting numeric in D40385 / R40385C4: got 'n.a.'
## Warning: Expecting numeric in D40386 / R40386C4: got 'n.a.'
## Warning: Expecting numeric in D40387 / R40387C4: got 'n.a.'
## Warning: Expecting numeric in D40388 / R40388C4: got 'n.a.'
## Warning: Expecting numeric in D40389 / R40389C4: got 'n.a.'
## Warning: Expecting numeric in D40390 / R40390C4: got 'n.a.'
## Warning: Expecting numeric in D40391 / R40391C4: got 'n.a.'
## Warning: Expecting numeric in D40392 / R40392C4: got 'n.a.'
## Warning: Expecting numeric in D40393 / R40393C4: got 'n.a.'
## Warning: Expecting numeric in D40394 / R40394C4: got 'n.a.'
## Warning: Expecting numeric in D40395 / R40395C4: got 'n.a.'
## Warning: Expecting numeric in D40396 / R40396C4: got 'n.a.'
## Warning: Expecting numeric in D40397 / R40397C4: got 'n.a.'
## Warning: Expecting numeric in D40398 / R40398C4: got 'n.a.'
## Warning: Expecting numeric in D40399 / R40399C4: got 'n.a.'
## Warning: Expecting numeric in D40400 / R40400C4: got 'n.a.'
## Warning: Expecting numeric in D40401 / R40401C4: got 'n.a.'
## Warning: Expecting numeric in D40402 / R40402C4: got 'n.a.'
## Warning: Expecting numeric in D40403 / R40403C4: got 'n.a.'
## Warning: Expecting numeric in D40404 / R40404C4: got 'n.a.'
## Warning: Expecting numeric in D40405 / R40405C4: got 'n.a.'
## Warning: Expecting numeric in D40406 / R40406C4: got 'n.a.'
## Warning: Expecting numeric in D40407 / R40407C4: got 'n.a.'
## Warning: Expecting numeric in D40408 / R40408C4: got 'n.a.'
## Warning: Expecting numeric in D40409 / R40409C4: got 'n.a.'
## Warning: Expecting numeric in D40410 / R40410C4: got 'n.a.'
## Warning: Expecting numeric in D40411 / R40411C4: got 'n.a.'
## Warning: Expecting numeric in D40412 / R40412C4: got 'n.a.'
## Warning: Expecting numeric in D40413 / R40413C4: got 'n.a.'
## Warning: Expecting numeric in D40414 / R40414C4: got 'n.a.'
## Warning: Expecting numeric in D40415 / R40415C4: got 'n.a.'
## Warning: Expecting numeric in D40416 / R40416C4: got 'n.a.'
## Warning: Expecting numeric in D40417 / R40417C4: got 'n.a.'
## Warning: Expecting numeric in D40418 / R40418C4: got 'n.a.'
## Warning: Expecting numeric in D40419 / R40419C4: got 'n.a.'
## Warning: Expecting numeric in D40420 / R40420C4: got 'n.a.'
## Warning: Expecting numeric in D40421 / R40421C4: got 'n.a.'
## Warning: Expecting numeric in D40422 / R40422C4: got 'n.a.'
## Warning: Expecting numeric in D40423 / R40423C4: got 'n.a.'
## Warning: Expecting numeric in D40424 / R40424C4: got 'n.a.'
## Warning: Expecting numeric in D40425 / R40425C4: got 'n.a.'
## Warning: Expecting numeric in D40426 / R40426C4: got 'n.a.'
## Warning: Expecting numeric in D40427 / R40427C4: got 'n.a.'
## Warning: Expecting numeric in D40428 / R40428C4: got 'n.a.'
## Warning: Expecting numeric in D40429 / R40429C4: got 'n.a.'
## Warning: Expecting numeric in D40430 / R40430C4: got 'n.a.'
## Warning: Expecting numeric in D40431 / R40431C4: got 'n.a.'
## Warning: Expecting numeric in D40432 / R40432C4: got 'n.a.'
## Warning: Expecting numeric in D40433 / R40433C4: got 'n.a.'
## Warning: Expecting numeric in D40434 / R40434C4: got 'n.a.'
## Warning: Expecting numeric in D40435 / R40435C4: got 'n.a.'
## Warning: Expecting numeric in D40436 / R40436C4: got 'n.a.'
## Warning: Expecting numeric in D40437 / R40437C4: got 'n.a.'
## Warning: Expecting numeric in D40438 / R40438C4: got 'n.a.'
## Warning: Expecting numeric in D40439 / R40439C4: got 'n.a.'
## Warning: Expecting numeric in D40440 / R40440C4: got 'n.a.'
## Warning: Expecting numeric in D40441 / R40441C4: got 'n.a.'
## Warning: Expecting numeric in D40442 / R40442C4: got 'n.a.'
## Warning: Expecting numeric in D40443 / R40443C4: got 'n.a.'
## Warning: Expecting numeric in D40444 / R40444C4: got 'n.a.'
## Warning: Expecting numeric in D40445 / R40445C4: got 'n.a.'
## Warning: Expecting numeric in D40446 / R40446C4: got 'n.a.'
## Warning: Expecting numeric in D40447 / R40447C4: got 'n.a.'
## Warning: Expecting numeric in D40448 / R40448C4: got 'n.a.'
## Warning: Expecting numeric in D40449 / R40449C4: got 'n.a.'
## Warning: Expecting numeric in D40450 / R40450C4: got 'n.a.'
## Warning: Expecting numeric in D40451 / R40451C4: got 'n.a.'
## Warning: Expecting numeric in D40452 / R40452C4: got 'n.a.'
## Warning: Expecting numeric in D40453 / R40453C4: got 'n.a.'
## Warning: Expecting numeric in D40454 / R40454C4: got 'n.a.'
## Warning: Expecting numeric in D40455 / R40455C4: got 'n.a.'
## Warning: Expecting numeric in D40456 / R40456C4: got 'n.a.'
## Warning: Expecting numeric in D40457 / R40457C4: got 'n.a.'
## Warning: Expecting numeric in D40458 / R40458C4: got 'n.a.'
## Warning: Expecting numeric in D40459 / R40459C4: got 'n.a.'
## Warning: Expecting numeric in D40460 / R40460C4: got 'n.a.'
## Warning: Expecting numeric in D40461 / R40461C4: got 'n.a.'
## Warning: Expecting numeric in D40462 / R40462C4: got 'n.a.'
## Warning: Expecting numeric in D40463 / R40463C4: got 'n.a.'
## Warning: Expecting numeric in D40464 / R40464C4: got 'n.a.'
## Warning: Expecting numeric in D40465 / R40465C4: got 'n.a.'
## Warning: Expecting numeric in D40466 / R40466C4: got 'n.a.'
## Warning: Expecting numeric in D40467 / R40467C4: got 'n.a.'
## Warning: Expecting numeric in D40468 / R40468C4: got 'n.a.'
## Warning: Expecting numeric in D40469 / R40469C4: got 'n.a.'
## Warning: Expecting numeric in D40470 / R40470C4: got 'n.a.'
## Warning: Expecting numeric in D40471 / R40471C4: got 'n.a.'
## Warning: Expecting numeric in D40472 / R40472C4: got 'n.a.'
## Warning: Expecting numeric in D40473 / R40473C4: got 'n.a.'
## Warning: Expecting numeric in D40474 / R40474C4: got 'n.a.'
## Warning: Expecting numeric in D40475 / R40475C4: got 'n.a.'
## Warning: Expecting numeric in D40476 / R40476C4: got 'n.a.'
## Warning: Expecting numeric in D40477 / R40477C4: got 'n.a.'
## Warning: Expecting numeric in D40478 / R40478C4: got 'n.a.'
## Warning: Expecting numeric in D40479 / R40479C4: got 'n.a.'
## Warning: Expecting numeric in D40480 / R40480C4: got 'n.a.'
## Warning: Expecting numeric in D40481 / R40481C4: got 'n.a.'
## Warning: Expecting numeric in D40482 / R40482C4: got 'n.a.'
## Warning: Expecting numeric in D40483 / R40483C4: got 'n.a.'
## Warning: Expecting numeric in D40484 / R40484C4: got 'n.a.'
## Warning: Expecting numeric in D40485 / R40485C4: got 'n.a.'
## Warning: Expecting numeric in D40486 / R40486C4: got 'n.a.'
## Warning: Expecting numeric in D40487 / R40487C4: got 'n.a.'
## Warning: Expecting numeric in D40488 / R40488C4: got 'n.a.'
## Warning: Expecting numeric in D40489 / R40489C4: got 'n.a.'
## Warning: Expecting numeric in D40490 / R40490C4: got 'n.a.'
## Warning: Expecting numeric in D40491 / R40491C4: got 'n.a.'
## Warning: Expecting numeric in D40492 / R40492C4: got 'n.a.'
## Warning: Expecting numeric in D40493 / R40493C4: got 'n.a.'
## Warning: Expecting numeric in D40494 / R40494C4: got 'n.a.'
## Warning: Expecting numeric in D40495 / R40495C4: got 'n.a.'
## Warning: Expecting numeric in D40496 / R40496C4: got 'n.a.'
## Warning: Expecting numeric in D40497 / R40497C4: got 'n.a.'
## Warning: Expecting numeric in D40498 / R40498C4: got 'n.a.'
## Warning: Expecting numeric in D40499 / R40499C4: got 'n.a.'
## Warning: Expecting numeric in D40500 / R40500C4: got 'n.a.'
## Warning: Expecting numeric in D40501 / R40501C4: got 'n.a.'
## Warning: Expecting numeric in D40502 / R40502C4: got 'n.a.'
## Warning: Expecting numeric in D40503 / R40503C4: got 'n.a.'
## Warning: Expecting numeric in D40504 / R40504C4: got 'n.a.'
## Warning: Expecting numeric in D40505 / R40505C4: got 'n.a.'
## Warning: Expecting numeric in D40506 / R40506C4: got 'n.a.'
## Warning: Expecting numeric in D40507 / R40507C4: got 'n.a.'
## Warning: Expecting numeric in D40508 / R40508C4: got 'n.a.'
## Warning: Expecting numeric in D40509 / R40509C4: got 'n.a.'
## Warning: Expecting numeric in D40510 / R40510C4: got 'n.a.'
## Warning: Expecting numeric in D40511 / R40511C4: got 'n.a.'
## Warning: Expecting numeric in D40512 / R40512C4: got 'n.a.'
## Warning: Expecting numeric in D40513 / R40513C4: got 'n.a.'
## Warning: Expecting numeric in D40514 / R40514C4: got 'n.a.'
## Warning: Expecting numeric in D40515 / R40515C4: got 'n.a.'
## Warning: Expecting numeric in D40516 / R40516C4: got 'n.a.'
## Warning: Expecting numeric in D40517 / R40517C4: got 'n.a.'
## Warning: Expecting numeric in D40518 / R40518C4: got 'n.a.'
## Warning: Expecting numeric in D40519 / R40519C4: got 'n.a.'
## Warning: Expecting numeric in D40520 / R40520C4: got 'n.a.'
## Warning: Expecting numeric in D40521 / R40521C4: got 'n.a.'
## Warning: Expecting numeric in D40522 / R40522C4: got 'n.a.'
## Warning: Expecting numeric in D40523 / R40523C4: got 'n.a.'
## Warning: Expecting numeric in D40524 / R40524C4: got 'n.a.'
## Warning: Expecting numeric in D40525 / R40525C4: got 'n.a.'
## Warning: Expecting numeric in D40526 / R40526C4: got 'n.a.'
## Warning: Expecting numeric in D40527 / R40527C4: got 'n.a.'
## Warning: Expecting numeric in D40528 / R40528C4: got 'n.a.'
## Warning: Expecting numeric in D40529 / R40529C4: got 'n.a.'
## Warning: Expecting numeric in D40530 / R40530C4: got 'n.a.'
## Warning: Expecting numeric in D40531 / R40531C4: got 'n.a.'
## Warning: Expecting numeric in D40532 / R40532C4: got 'n.a.'
## Warning: Expecting numeric in D40533 / R40533C4: got 'n.a.'
## Warning: Expecting numeric in D40534 / R40534C4: got 'n.a.'
## Warning: Expecting numeric in D40535 / R40535C4: got 'n.a.'
## Warning: Expecting numeric in D40536 / R40536C4: got 'n.a.'
## Warning: Expecting numeric in D40537 / R40537C4: got 'n.a.'
## Warning: Expecting numeric in D40538 / R40538C4: got 'n.a.'
## Warning: Expecting numeric in D40539 / R40539C4: got 'n.a.'
## Warning: Expecting numeric in D40540 / R40540C4: got 'n.a.'
## Warning: Expecting numeric in D40541 / R40541C4: got 'n.a.'
## Warning: Expecting numeric in D40542 / R40542C4: got 'n.a.'
## Warning: Expecting numeric in D40543 / R40543C4: got 'n.a.'
## Warning: Expecting numeric in D40544 / R40544C4: got 'n.a.'
## Warning: Expecting numeric in D40545 / R40545C4: got 'n.a.'
## Warning: Expecting numeric in D40546 / R40546C4: got 'n.a.'
## Warning: Expecting numeric in D40547 / R40547C4: got 'n.a.'
## Warning: Expecting numeric in D40548 / R40548C4: got 'n.a.'
## Warning: Expecting numeric in D40549 / R40549C4: got 'n.a.'
## Warning: Expecting numeric in D40550 / R40550C4: got 'n.a.'
## Warning: Expecting numeric in D40551 / R40551C4: got 'n.a.'
## Warning: Expecting numeric in D40552 / R40552C4: got 'n.a.'
## Warning: Expecting numeric in D40553 / R40553C4: got 'n.a.'
## Warning: Expecting numeric in D40554 / R40554C4: got 'n.a.'
## Warning: Expecting numeric in D40555 / R40555C4: got 'n.a.'
## Warning: Expecting numeric in D40556 / R40556C4: got 'n.a.'
## Warning: Expecting numeric in D40557 / R40557C4: got 'n.a.'
## Warning: Expecting numeric in D40558 / R40558C4: got 'n.a.'
## Warning: Expecting numeric in D40559 / R40559C4: got 'n.a.'
## Warning: Expecting numeric in D40560 / R40560C4: got 'n.a.'
## Warning: Expecting numeric in D40561 / R40561C4: got 'n.a.'
## Warning: Expecting numeric in D40562 / R40562C4: got 'n.a.'
## Warning: Expecting numeric in D40563 / R40563C4: got 'n.a.'
## Warning: Expecting numeric in D40564 / R40564C4: got 'n.a.'
## Warning: Expecting numeric in D40565 / R40565C4: got 'n.a.'
## Warning: Expecting numeric in D40566 / R40566C4: got 'n.a.'
## Warning: Expecting numeric in D40567 / R40567C4: got 'n.a.'
## Warning: Expecting numeric in D40568 / R40568C4: got 'n.a.'
## Warning: Expecting numeric in D40569 / R40569C4: got 'n.a.'
## Warning: Expecting numeric in D40570 / R40570C4: got 'n.a.'
## Warning: Expecting numeric in D40571 / R40571C4: got 'n.a.'
## Warning: Expecting numeric in D40572 / R40572C4: got 'n.a.'
## Warning: Expecting numeric in D40573 / R40573C4: got 'n.a.'
## Warning: Expecting numeric in D40574 / R40574C4: got 'n.a.'
## Warning: Expecting numeric in D40575 / R40575C4: got 'n.a.'
## Warning: Expecting numeric in D40576 / R40576C4: got 'n.a.'
## Warning: Expecting numeric in D40577 / R40577C4: got 'n.a.'
## Warning: Expecting numeric in D40578 / R40578C4: got 'n.a.'
## Warning: Expecting numeric in D40579 / R40579C4: got 'n.a.'
## Warning: Expecting numeric in D40580 / R40580C4: got 'n.a.'
## Warning: Expecting numeric in D40581 / R40581C4: got 'n.a.'
## Warning: Expecting numeric in D40582 / R40582C4: got 'n.a.'
## Warning: Expecting numeric in D40583 / R40583C4: got 'n.a.'
## Warning: Expecting numeric in D40584 / R40584C4: got 'n.a.'
## Warning: Expecting numeric in D40585 / R40585C4: got 'n.a.'
## Warning: Expecting numeric in D40586 / R40586C4: got 'n.a.'
## Warning: Expecting numeric in D40587 / R40587C4: got 'n.a.'
## Warning: Expecting numeric in D40588 / R40588C4: got 'n.a.'
## Warning: Expecting numeric in D40589 / R40589C4: got 'n.a.'
## Warning: Expecting numeric in D40590 / R40590C4: got 'n.a.'
## Warning: Expecting numeric in D40591 / R40591C4: got 'n.a.'
## Warning: Expecting numeric in D40592 / R40592C4: got 'n.a.'
## Warning: Expecting numeric in D40593 / R40593C4: got 'n.a.'
## Warning: Expecting numeric in D40594 / R40594C4: got 'n.a.'
## Warning: Expecting numeric in D40595 / R40595C4: got 'n.a.'
## Warning: Expecting numeric in D40596 / R40596C4: got 'n.a.'
## Warning: Expecting numeric in D40597 / R40597C4: got 'n.a.'
## Warning: Expecting numeric in D40598 / R40598C4: got 'n.a.'
## Warning: Expecting numeric in D40599 / R40599C4: got 'n.a.'
## Warning: Expecting numeric in D40600 / R40600C4: got 'n.a.'
## Warning: Expecting numeric in D40601 / R40601C4: got 'n.a.'
## Warning: Expecting numeric in D40602 / R40602C4: got 'n.a.'
## Warning: Expecting numeric in D40603 / R40603C4: got 'n.a.'
## Warning: Expecting numeric in D40604 / R40604C4: got 'n.a.'
## Warning: Expecting numeric in D40605 / R40605C4: got 'n.a.'
## Warning: Expecting numeric in D40606 / R40606C4: got 'n.a.'
## Warning: Expecting numeric in D40607 / R40607C4: got 'n.a.'
## Warning: Expecting numeric in D40608 / R40608C4: got 'n.a.'
## Warning: Expecting numeric in D40609 / R40609C4: got 'n.a.'
## Warning: Expecting numeric in D40610 / R40610C4: got 'n.a.'
## Warning: Expecting numeric in D40611 / R40611C4: got 'n.a.'
## Warning: Expecting numeric in D40612 / R40612C4: got 'n.a.'
## Warning: Expecting numeric in D40613 / R40613C4: got 'n.a.'
## Warning: Expecting numeric in D40614 / R40614C4: got 'n.a.'
## Warning: Expecting numeric in D40615 / R40615C4: got 'n.a.'
## Warning: Expecting numeric in D40616 / R40616C4: got 'n.a.'
## Warning: Expecting numeric in D40617 / R40617C4: got 'n.a.'
## Warning: Expecting numeric in D40618 / R40618C4: got 'n.a.'
## Warning: Expecting numeric in D40619 / R40619C4: got 'n.a.'
## Warning: Expecting numeric in D40620 / R40620C4: got 'n.a.'
## Warning: Expecting numeric in D40621 / R40621C4: got 'n.a.'
## Warning: Expecting numeric in D40622 / R40622C4: got 'n.a.'
## Warning: Expecting numeric in D40623 / R40623C4: got 'n.a.'
## Warning: Expecting numeric in D40624 / R40624C4: got 'n.a.'
## Warning: Expecting numeric in D40625 / R40625C4: got 'n.a.'
## Warning: Expecting numeric in D40626 / R40626C4: got 'n.a.'
## Warning: Expecting numeric in D40627 / R40627C4: got 'n.a.'
## Warning: Expecting numeric in D40628 / R40628C4: got 'n.a.'
## Warning: Expecting numeric in D40629 / R40629C4: got 'n.a.'
## Warning: Expecting numeric in D40630 / R40630C4: got 'n.a.'
## Warning: Expecting numeric in D40631 / R40631C4: got 'n.a.'
## Warning: Expecting numeric in D40632 / R40632C4: got 'n.a.'
## Warning: Expecting numeric in D40633 / R40633C4: got 'n.a.'
## Warning: Expecting numeric in D40634 / R40634C4: got 'n.a.'
## Warning: Expecting numeric in D40635 / R40635C4: got 'n.a.'
## Warning: Expecting numeric in D40636 / R40636C4: got 'n.a.'
## Warning: Expecting numeric in D40637 / R40637C4: got 'n.a.'
## Warning: Expecting numeric in D40638 / R40638C4: got 'n.a.'
## Warning: Expecting numeric in D40639 / R40639C4: got 'n.a.'
## Warning: Expecting numeric in D40640 / R40640C4: got 'n.a.'
## Warning: Expecting numeric in D40641 / R40641C4: got 'n.a.'
## Warning: Expecting numeric in D40642 / R40642C4: got 'n.a.'
## Warning: Expecting numeric in D40643 / R40643C4: got 'n.a.'
## Warning: Expecting numeric in D40644 / R40644C4: got 'n.a.'
## Warning: Expecting numeric in D40645 / R40645C4: got 'n.a.'
## Warning: Expecting numeric in D40646 / R40646C4: got 'n.a.'
## Warning: Expecting numeric in D40647 / R40647C4: got 'n.a.'
## Warning: Expecting numeric in D40648 / R40648C4: got 'n.a.'
## Warning: Expecting numeric in D40649 / R40649C4: got 'n.a.'
## Warning: Expecting numeric in D40650 / R40650C4: got 'n.a.'
## Warning: Expecting numeric in D40651 / R40651C4: got 'n.a.'
## Warning: Expecting numeric in D40652 / R40652C4: got 'n.a.'
## Warning: Expecting numeric in D40653 / R40653C4: got 'n.a.'
## Warning: Expecting numeric in D40654 / R40654C4: got 'n.a.'
## Warning: Expecting numeric in D40655 / R40655C4: got 'n.a.'
## Warning: Expecting numeric in D40656 / R40656C4: got 'n.a.'
## Warning: Expecting numeric in D40657 / R40657C4: got 'n.a.'
## Warning: Expecting numeric in D40658 / R40658C4: got 'n.a.'
## Warning: Expecting numeric in D40659 / R40659C4: got 'n.a.'
## Warning: Expecting numeric in D40660 / R40660C4: got 'n.a.'
## Warning: Expecting numeric in D40661 / R40661C4: got 'n.a.'
## Warning: Expecting numeric in D40662 / R40662C4: got 'n.a.'
## Warning: Expecting numeric in D40663 / R40663C4: got 'n.a.'
## Warning: Expecting numeric in D40664 / R40664C4: got 'n.a.'
## Warning: Expecting numeric in D40665 / R40665C4: got 'n.a.'
## Warning: Expecting numeric in D40666 / R40666C4: got 'n.a.'
## Warning: Expecting numeric in D40667 / R40667C4: got 'n.a.'
## Warning: Expecting numeric in D40668 / R40668C4: got 'n.a.'
## Warning: Expecting numeric in D40669 / R40669C4: got 'n.a.'
## Warning: Expecting numeric in D40670 / R40670C4: got 'n.a.'
## Warning: Expecting numeric in D40671 / R40671C4: got 'n.a.'
## Warning: Expecting numeric in D40672 / R40672C4: got 'n.a.'
## Warning: Expecting numeric in D40673 / R40673C4: got 'n.a.'
## Warning: Expecting numeric in D40674 / R40674C4: got 'n.a.'
## Warning: Expecting numeric in D40675 / R40675C4: got 'n.a.'
## Warning: Expecting numeric in D40676 / R40676C4: got 'n.a.'
## Warning: Expecting numeric in D40677 / R40677C4: got 'n.a.'
## Warning: Expecting numeric in D40678 / R40678C4: got 'n.a.'
## Warning: Expecting numeric in D40679 / R40679C4: got 'n.a.'
## Warning: Expecting numeric in D40680 / R40680C4: got 'n.a.'
## Warning: Expecting numeric in D40681 / R40681C4: got 'n.a.'
## Warning: Expecting numeric in D40682 / R40682C4: got 'n.a.'
## Warning: Expecting numeric in D40683 / R40683C4: got 'n.a.'
## Warning: Expecting numeric in D40684 / R40684C4: got 'n.a.'
## Warning: Expecting numeric in D40685 / R40685C4: got 'n.a.'
## Warning: Expecting numeric in D40686 / R40686C4: got 'n.a.'
## Warning: Expecting numeric in D40687 / R40687C4: got 'n.a.'
## Warning: Expecting numeric in D40688 / R40688C4: got 'n.a.'
## Warning: Expecting numeric in D40689 / R40689C4: got 'n.a.'
## Warning: Expecting numeric in D40690 / R40690C4: got 'n.a.'
## Warning: Expecting numeric in D40691 / R40691C4: got 'n.a.'
## Warning: Expecting numeric in D40692 / R40692C4: got 'n.a.'
## Warning: Expecting numeric in D40693 / R40693C4: got 'n.a.'
## Warning: Expecting numeric in D40694 / R40694C4: got 'n.a.'
## Warning: Expecting numeric in D40695 / R40695C4: got 'n.a.'
## Warning: Expecting numeric in D40696 / R40696C4: got 'n.a.'
## Warning: Expecting numeric in D40697 / R40697C4: got 'n.a.'
## Warning: Expecting numeric in D40698 / R40698C4: got 'n.a.'
## Warning: Expecting numeric in D40699 / R40699C4: got 'n.a.'
## Warning: Expecting numeric in D40700 / R40700C4: got 'n.a.'
## Warning: Expecting numeric in D40701 / R40701C4: got 'n.a.'
## Warning: Expecting numeric in D40702 / R40702C4: got 'n.a.'
## Warning: Expecting numeric in D40703 / R40703C4: got 'n.a.'
## Warning: Expecting numeric in D40704 / R40704C4: got 'n.a.'
## Warning: Expecting numeric in D40705 / R40705C4: got 'n.a.'
## Warning: Expecting numeric in D40706 / R40706C4: got 'n.a.'
## Warning: Expecting numeric in D40707 / R40707C4: got 'n.a.'
## Warning: Expecting numeric in D40708 / R40708C4: got 'n.a.'
## Warning: Expecting numeric in D40709 / R40709C4: got 'n.a.'
## Warning: Expecting numeric in D40710 / R40710C4: got 'n.a.'
## Warning: Expecting numeric in D40711 / R40711C4: got 'n.a.'
## Warning: Expecting numeric in D40712 / R40712C4: got 'n.a.'
## Warning: Expecting numeric in D40713 / R40713C4: got 'n.a.'
## Warning: Expecting numeric in D40714 / R40714C4: got 'n.a.'
## Warning: Expecting numeric in D40715 / R40715C4: got 'n.a.'
## Warning: Expecting numeric in D40716 / R40716C4: got 'n.a.'
## Warning: Expecting numeric in D40717 / R40717C4: got 'n.a.'
## Warning: Expecting numeric in D40718 / R40718C4: got 'n.a.'
## Warning: Expecting numeric in D40719 / R40719C4: got 'n.a.'
## Warning: Expecting numeric in D40720 / R40720C4: got 'n.a.'
## Warning: Expecting numeric in D40721 / R40721C4: got 'n.a.'
## Warning: Expecting numeric in D40722 / R40722C4: got 'n.a.'
## Warning: Expecting numeric in D40723 / R40723C4: got 'n.a.'
## Warning: Expecting numeric in D40724 / R40724C4: got 'n.a.'
## Warning: Expecting numeric in D40725 / R40725C4: got 'n.a.'
## Warning: Expecting numeric in D40726 / R40726C4: got 'n.a.'
## Warning: Expecting numeric in D40727 / R40727C4: got 'n.a.'
## Warning: Expecting numeric in D40728 / R40728C4: got 'n.a.'
## Warning: Expecting numeric in D40729 / R40729C4: got 'n.a.'
## Warning: Expecting numeric in D40730 / R40730C4: got 'n.a.'
## Warning: Expecting numeric in D40731 / R40731C4: got 'n.a.'
## Warning: Expecting numeric in D40732 / R40732C4: got 'n.a.'
## Warning: Expecting numeric in D40733 / R40733C4: got 'n.a.'
## Warning: Expecting numeric in D40734 / R40734C4: got 'n.a.'
## Warning: Expecting numeric in D40735 / R40735C4: got 'n.a.'
## Warning: Expecting numeric in D40736 / R40736C4: got 'n.a.'
## Warning: Expecting numeric in D40737 / R40737C4: got 'n.a.'
## Warning: Expecting numeric in D40738 / R40738C4: got 'n.a.'
## Warning: Expecting numeric in D40739 / R40739C4: got 'n.a.'
## Warning: Expecting numeric in D40740 / R40740C4: got 'n.a.'
## Warning: Expecting numeric in D40741 / R40741C4: got 'n.a.'
## Warning: Expecting numeric in D40742 / R40742C4: got 'n.a.'
## Warning: Expecting numeric in D40743 / R40743C4: got 'n.a.'
## Warning: Expecting numeric in D40744 / R40744C4: got 'n.a.'
## Warning: Expecting numeric in D40745 / R40745C4: got 'n.a.'
## Warning: Expecting numeric in D40746 / R40746C4: got 'n.a.'
## Warning: Expecting numeric in D40747 / R40747C4: got 'n.a.'
## Warning: Expecting numeric in D40748 / R40748C4: got 'n.a.'
## Warning: Expecting numeric in D40749 / R40749C4: got 'n.a.'
## Warning: Expecting numeric in D40750 / R40750C4: got 'n.a.'
## Warning: Expecting numeric in D40751 / R40751C4: got 'n.a.'
## Warning: Expecting numeric in D40752 / R40752C4: got 'n.a.'
## Warning: Expecting numeric in D40753 / R40753C4: got 'n.a.'
## Warning: Expecting numeric in D40754 / R40754C4: got 'n.a.'
## Warning: Expecting numeric in D40755 / R40755C4: got 'n.a.'
## Warning: Expecting numeric in D40756 / R40756C4: got 'n.a.'
## Warning: Expecting numeric in D40757 / R40757C4: got 'n.a.'
## Warning: Expecting numeric in D40758 / R40758C4: got 'n.a.'
## Warning: Expecting numeric in D40759 / R40759C4: got 'n.a.'
## Warning: Expecting numeric in D40760 / R40760C4: got 'n.a.'
## Warning: Expecting numeric in D40761 / R40761C4: got 'n.a.'
## Warning: Expecting numeric in D40762 / R40762C4: got 'n.a.'
## Warning: Expecting numeric in D40763 / R40763C4: got 'n.a.'
## Warning: Expecting numeric in D40764 / R40764C4: got 'n.a.'
## Warning: Expecting numeric in D40765 / R40765C4: got 'n.a.'
## Warning: Expecting numeric in D40766 / R40766C4: got 'n.a.'
## Warning: Expecting numeric in D40767 / R40767C4: got 'n.a.'
## Warning: Expecting numeric in D40768 / R40768C4: got 'n.a.'
## Warning: Expecting numeric in D40769 / R40769C4: got 'n.a.'
## Warning: Expecting numeric in D40770 / R40770C4: got 'n.a.'
## Warning: Expecting numeric in D40771 / R40771C4: got 'n.a.'
## Warning: Expecting numeric in D40772 / R40772C4: got 'n.a.'
## Warning: Expecting numeric in D40773 / R40773C4: got 'n.a.'
## Warning: Expecting numeric in D40774 / R40774C4: got 'n.a.'
## Warning: Expecting numeric in D40775 / R40775C4: got 'n.a.'
## Warning: Expecting numeric in D40776 / R40776C4: got 'n.a.'
## Warning: Expecting numeric in D40777 / R40777C4: got 'n.a.'
## Warning: Expecting numeric in D40778 / R40778C4: got 'n.a.'
## Warning: Expecting numeric in D40779 / R40779C4: got 'n.a.'
## Warning: Expecting numeric in D40780 / R40780C4: got 'n.a.'
## Warning: Expecting numeric in D40781 / R40781C4: got 'n.a.'
## Warning: Expecting numeric in D40782 / R40782C4: got 'n.a.'
## Warning: Expecting numeric in D40783 / R40783C4: got 'n.a.'
## Warning: Expecting numeric in D40784 / R40784C4: got 'n.a.'
## Warning: Expecting numeric in D40785 / R40785C4: got 'n.a.'
## Warning: Expecting numeric in D40786 / R40786C4: got 'n.a.'
## Warning: Expecting numeric in D40787 / R40787C4: got 'n.a.'
## Warning: Expecting numeric in D40788 / R40788C4: got 'n.a.'
## Warning: Expecting numeric in D40789 / R40789C4: got 'n.a.'
## Warning: Expecting numeric in D40790 / R40790C4: got 'n.a.'
## Warning: Expecting numeric in D40791 / R40791C4: got 'n.a.'
## Warning: Expecting numeric in D40792 / R40792C4: got 'n.a.'
## Warning: Expecting numeric in D40793 / R40793C4: got 'n.a.'
## Warning: Expecting numeric in D40794 / R40794C4: got 'n.a.'
## Warning: Expecting numeric in D40795 / R40795C4: got 'n.a.'
## Warning: Expecting numeric in D40796 / R40796C4: got 'n.a.'
## Warning: Expecting numeric in D40797 / R40797C4: got 'n.a.'
## Warning: Expecting numeric in D40798 / R40798C4: got 'n.a.'
## Warning: Expecting numeric in D40799 / R40799C4: got 'n.a.'
## Warning: Expecting numeric in D40800 / R40800C4: got 'n.a.'
## Warning: Expecting numeric in D40801 / R40801C4: got 'n.a.'
## Warning: Expecting numeric in D40802 / R40802C4: got 'n.a.'
## Warning: Expecting numeric in D40803 / R40803C4: got 'n.a.'
## Warning: Expecting numeric in D40804 / R40804C4: got 'n.a.'
## Warning: Expecting numeric in D40805 / R40805C4: got 'n.a.'
## Warning: Expecting numeric in D40806 / R40806C4: got 'n.a.'
## Warning: Expecting numeric in D40807 / R40807C4: got 'n.a.'
## Warning: Expecting numeric in D40808 / R40808C4: got 'n.a.'
## Warning: Expecting numeric in D40809 / R40809C4: got 'n.a.'
## Warning: Expecting numeric in D40810 / R40810C4: got 'n.a.'
## Warning: Expecting numeric in D40811 / R40811C4: got 'n.a.'
## Warning: Expecting numeric in D40812 / R40812C4: got 'n.a.'
## Warning: Expecting numeric in D40813 / R40813C4: got 'n.a.'
## Warning: Expecting numeric in D40814 / R40814C4: got 'n.a.'
## Warning: Expecting numeric in D40815 / R40815C4: got 'n.a.'
## Warning: Expecting numeric in D40816 / R40816C4: got 'n.a.'
## Warning: Expecting numeric in D40817 / R40817C4: got 'n.a.'
## Warning: Expecting numeric in D40818 / R40818C4: got 'n.a.'
## Warning: Expecting numeric in D40819 / R40819C4: got 'n.a.'
## Warning: Expecting numeric in D40820 / R40820C4: got 'n.a.'
## Warning: Expecting numeric in D40821 / R40821C4: got 'n.a.'
## Warning: Expecting numeric in D40822 / R40822C4: got 'n.a.'
## Warning: Expecting numeric in D40823 / R40823C4: got 'n.a.'
## Warning: Expecting numeric in D40824 / R40824C4: got 'n.a.'
## Warning: Expecting numeric in D40825 / R40825C4: got 'n.a.'
## Warning: Expecting numeric in D40826 / R40826C4: got 'n.a.'
## Warning: Expecting numeric in D40827 / R40827C4: got 'n.a.'
## Warning: Expecting numeric in D40828 / R40828C4: got 'n.a.'
## Warning: Expecting numeric in D40829 / R40829C4: got 'n.a.'
## Warning: Expecting numeric in D40830 / R40830C4: got 'n.a.'
## Warning: Expecting numeric in D40831 / R40831C4: got 'n.a.'
## Warning: Expecting numeric in D40832 / R40832C4: got 'n.a.'
## Warning: Expecting numeric in D40833 / R40833C4: got 'n.a.'
## Warning: Expecting numeric in D40834 / R40834C4: got 'n.a.'
## Warning: Expecting numeric in D40835 / R40835C4: got 'n.a.'
## Warning: Expecting numeric in D40836 / R40836C4: got 'n.a.'
## Warning: Expecting numeric in D40837 / R40837C4: got 'n.a.'
## Warning: Expecting numeric in D40838 / R40838C4: got 'n.a.'
## Warning: Expecting numeric in D40839 / R40839C4: got 'n.a.'
## Warning: Expecting numeric in D40840 / R40840C4: got 'n.a.'
## Warning: Expecting numeric in D40841 / R40841C4: got 'n.a.'
## Warning: Expecting numeric in D40842 / R40842C4: got 'n.a.'
## Warning: Expecting numeric in D40843 / R40843C4: got 'n.a.'
## Warning: Expecting numeric in D40844 / R40844C4: got 'n.a.'
## Warning: Expecting numeric in D40845 / R40845C4: got 'n.a.'
## Warning: Expecting numeric in D40846 / R40846C4: got 'n.a.'
## Warning: Expecting numeric in D40847 / R40847C4: got 'n.a.'
## Warning: Expecting numeric in D40848 / R40848C4: got 'n.a.'
## Warning: Expecting numeric in D40849 / R40849C4: got 'n.a.'
## Warning: Expecting numeric in D40850 / R40850C4: got 'n.a.'
## Warning: Expecting numeric in D40851 / R40851C4: got 'n.a.'
## Warning: Expecting numeric in D40852 / R40852C4: got 'n.a.'
## Warning: Expecting numeric in D40853 / R40853C4: got 'n.a.'
## Warning: Expecting numeric in D40854 / R40854C4: got 'n.a.'
## Warning: Expecting numeric in D40855 / R40855C4: got 'n.a.'
## Warning: Expecting numeric in D40856 / R40856C4: got 'n.a.'
## Warning: Expecting numeric in D40857 / R40857C4: got 'n.a.'
## Warning: Expecting numeric in D40858 / R40858C4: got 'n.a.'
## Warning: Expecting numeric in D40859 / R40859C4: got 'n.a.'
## Warning: Expecting numeric in D40860 / R40860C4: got 'n.a.'
## Warning: Expecting numeric in D40861 / R40861C4: got 'n.a.'
## Warning: Expecting numeric in D40862 / R40862C4: got 'n.a.'
## Warning: Expecting numeric in D40863 / R40863C4: got 'n.a.'
## Warning: Expecting numeric in D40864 / R40864C4: got 'n.a.'
## Warning: Expecting numeric in D40865 / R40865C4: got 'n.a.'
## Warning: Expecting numeric in D40866 / R40866C4: got 'n.a.'
## Warning: Expecting numeric in D40867 / R40867C4: got 'n.a.'
## Warning: Expecting numeric in D40868 / R40868C4: got 'n.a.'
## Warning: Expecting numeric in D40869 / R40869C4: got 'n.a.'
## Warning: Expecting numeric in D40870 / R40870C4: got 'n.a.'
## Warning: Expecting numeric in D40871 / R40871C4: got 'n.a.'
## Warning: Expecting numeric in D40872 / R40872C4: got 'n.a.'
## Warning: Expecting numeric in D40873 / R40873C4: got 'n.a.'
## Warning: Expecting numeric in D40874 / R40874C4: got 'n.a.'
## Warning: Expecting numeric in D40875 / R40875C4: got 'n.a.'
## Warning: Expecting numeric in D40876 / R40876C4: got 'n.a.'
## Warning: Expecting numeric in D40877 / R40877C4: got 'n.a.'
## Warning: Expecting numeric in D40878 / R40878C4: got 'n.a.'
## Warning: Expecting numeric in D40879 / R40879C4: got 'n.a.'
## Warning: Expecting numeric in D40880 / R40880C4: got 'n.a.'
## Warning: Expecting numeric in D40881 / R40881C4: got 'n.a.'
## Warning: Expecting numeric in D40882 / R40882C4: got 'n.a.'
## Warning: Expecting numeric in D40883 / R40883C4: got 'n.a.'
## Warning: Expecting numeric in D40884 / R40884C4: got 'n.a.'
## Warning: Expecting numeric in D40885 / R40885C4: got 'n.a.'
## Warning: Expecting numeric in D40886 / R40886C4: got 'n.a.'
## Warning: Expecting numeric in D40887 / R40887C4: got 'n.a.'
## Warning: Expecting numeric in D40888 / R40888C4: got 'n.a.'
## Warning: Expecting numeric in D40889 / R40889C4: got 'n.a.'
## Warning: Expecting numeric in D40890 / R40890C4: got 'n.a.'
## Warning: Expecting numeric in D40891 / R40891C4: got 'n.a.'
## Warning: Expecting numeric in D40892 / R40892C4: got 'n.a.'
## Warning: Expecting numeric in D40893 / R40893C4: got 'n.a.'
## Warning: Expecting numeric in D40894 / R40894C4: got 'n.a.'
## Warning: Expecting numeric in D40895 / R40895C4: got 'n.a.'
## Warning: Expecting numeric in D40896 / R40896C4: got 'n.a.'
## Warning: Expecting numeric in D40897 / R40897C4: got 'n.a.'
## Warning: Expecting numeric in D40898 / R40898C4: got 'n.a.'
## Warning: Expecting numeric in D40899 / R40899C4: got 'n.a.'
## Warning: Expecting numeric in D40900 / R40900C4: got 'n.a.'
## Warning: Expecting numeric in D40901 / R40901C4: got 'n.a.'
## Warning: Expecting numeric in D40902 / R40902C4: got 'n.a.'
## Warning: Expecting numeric in D40903 / R40903C4: got 'n.a.'
## Warning: Expecting numeric in D40904 / R40904C4: got 'n.a.'
## Warning: Expecting numeric in D40905 / R40905C4: got 'n.a.'
## Warning: Expecting numeric in D40906 / R40906C4: got 'n.a.'
## Warning: Expecting numeric in D40907 / R40907C4: got 'n.a.'
## Warning: Expecting numeric in D40908 / R40908C4: got 'n.a.'
## Warning: Expecting numeric in D40909 / R40909C4: got 'n.a.'
## Warning: Expecting numeric in D40910 / R40910C4: got 'n.a.'
## Warning: Expecting numeric in D40911 / R40911C4: got 'n.a.'
## Warning: Expecting numeric in D40912 / R40912C4: got 'n.a.'
## Warning: Expecting numeric in D40913 / R40913C4: got 'n.a.'
## Warning: Expecting numeric in D40914 / R40914C4: got 'n.a.'
## Warning: Expecting numeric in D40915 / R40915C4: got 'n.a.'
## Warning: Expecting numeric in D40916 / R40916C4: got 'n.a.'
## Warning: Expecting numeric in D40917 / R40917C4: got 'n.a.'
## Warning: Expecting numeric in D40918 / R40918C4: got 'n.a.'
## Warning: Expecting numeric in D40919 / R40919C4: got 'n.a.'
## Warning: Expecting numeric in D40920 / R40920C4: got 'n.a.'
## Warning: Expecting numeric in D40921 / R40921C4: got 'n.a.'
## Warning: Expecting numeric in D40922 / R40922C4: got 'n.a.'
## Warning: Expecting numeric in D40923 / R40923C4: got 'n.a.'
## Warning: Expecting numeric in D40924 / R40924C4: got 'n.a.'
## Warning: Expecting numeric in D40925 / R40925C4: got 'n.a.'
## Warning: Expecting numeric in D40926 / R40926C4: got 'n.a.'
## Warning: Expecting numeric in D40927 / R40927C4: got 'n.a.'
## Warning: Expecting numeric in D40928 / R40928C4: got 'n.a.'
## Warning: Expecting numeric in D40929 / R40929C4: got 'n.a.'
## Warning: Expecting numeric in D40930 / R40930C4: got 'n.a.'
## Warning: Expecting numeric in D40931 / R40931C4: got 'n.a.'
## Warning: Expecting numeric in D40932 / R40932C4: got 'n.a.'
## Warning: Expecting numeric in D40933 / R40933C4: got 'n.a.'
## Warning: Expecting numeric in D40934 / R40934C4: got 'n.a.'
## Warning: Expecting numeric in D40935 / R40935C4: got 'n.a.'
## Warning: Expecting numeric in D40936 / R40936C4: got 'n.a.'
## Warning: Expecting numeric in D40937 / R40937C4: got 'n.a.'
## Warning: Expecting numeric in D40938 / R40938C4: got 'n.a.'
## Warning: Expecting numeric in D40939 / R40939C4: got 'n.a.'
## Warning: Expecting numeric in D40940 / R40940C4: got 'n.a.'
## Warning: Expecting numeric in D40941 / R40941C4: got 'n.a.'
## Warning: Expecting numeric in D40942 / R40942C4: got 'n.a.'
## Warning: Expecting numeric in D40943 / R40943C4: got 'n.a.'
## Warning: Expecting numeric in D40944 / R40944C4: got 'n.a.'
## Warning: Expecting numeric in D40945 / R40945C4: got 'n.a.'
## Warning: Expecting numeric in D40946 / R40946C4: got 'n.a.'
## Warning: Expecting numeric in D40947 / R40947C4: got 'n.a.'
## Warning: Expecting numeric in D40948 / R40948C4: got 'n.a.'
## Warning: Expecting numeric in D40949 / R40949C4: got 'n.a.'
## Warning: Expecting numeric in D40950 / R40950C4: got 'n.a.'
## Warning: Expecting numeric in D40951 / R40951C4: got 'n.a.'
## Warning: Expecting numeric in D40952 / R40952C4: got 'n.a.'
## Warning: Expecting numeric in D40953 / R40953C4: got 'n.a.'
## Warning: Expecting numeric in D40954 / R40954C4: got 'n.a.'
## Warning: Expecting numeric in D40955 / R40955C4: got 'n.a.'
## Warning: Expecting numeric in D40956 / R40956C4: got 'n.a.'
## Warning: Expecting numeric in D40957 / R40957C4: got 'n.a.'
## Warning: Expecting numeric in D40958 / R40958C4: got 'n.a.'
## Warning: Expecting numeric in D40959 / R40959C4: got 'n.a.'
## Warning: Expecting numeric in D40960 / R40960C4: got 'n.a.'
## Warning: Expecting numeric in D40961 / R40961C4: got 'n.a.'
## Warning: Expecting numeric in D40962 / R40962C4: got 'n.a.'
## Warning: Expecting numeric in D40963 / R40963C4: got 'n.a.'
## Warning: Expecting numeric in D40964 / R40964C4: got 'n.a.'
## Warning: Expecting numeric in D40965 / R40965C4: got 'n.a.'
## Warning: Expecting numeric in D40966 / R40966C4: got 'n.a.'
## Warning: Expecting numeric in D40967 / R40967C4: got 'n.a.'
## Warning: Expecting numeric in D40968 / R40968C4: got 'n.a.'
## Warning: Expecting numeric in D40969 / R40969C4: got 'n.a.'
## Warning: Expecting numeric in D40970 / R40970C4: got 'n.a.'
## Warning: Expecting numeric in D40971 / R40971C4: got 'n.a.'
## Warning: Expecting numeric in D40972 / R40972C4: got 'n.a.'
## Warning: Expecting numeric in D40973 / R40973C4: got 'n.a.'
## Warning: Expecting numeric in D40974 / R40974C4: got 'n.a.'
## Warning: Expecting numeric in D40975 / R40975C4: got 'n.a.'
## Warning: Expecting numeric in D40976 / R40976C4: got 'n.a.'
## Warning: Expecting numeric in D40977 / R40977C4: got 'n.a.'
## Warning: Expecting numeric in D40978 / R40978C4: got 'n.a.'
## Warning: Expecting numeric in D40979 / R40979C4: got 'n.a.'
## Warning: Expecting numeric in D40980 / R40980C4: got 'n.a.'
## Warning: Expecting numeric in D40981 / R40981C4: got 'n.a.'
## Warning: Expecting numeric in D40982 / R40982C4: got 'n.a.'
## Warning: Expecting numeric in D40983 / R40983C4: got 'n.a.'
## Warning: Expecting numeric in D40984 / R40984C4: got 'n.a.'
## Warning: Expecting numeric in D40985 / R40985C4: got 'n.a.'
## Warning: Expecting numeric in D40986 / R40986C4: got 'n.a.'
## Warning: Expecting numeric in D40987 / R40987C4: got 'n.a.'
## Warning: Expecting numeric in D40988 / R40988C4: got 'n.a.'
## Warning: Expecting numeric in D40989 / R40989C4: got 'n.a.'
## Warning: Expecting numeric in D40990 / R40990C4: got 'n.a.'
## Warning: Expecting numeric in D40991 / R40991C4: got 'n.a.'
## Warning: Expecting numeric in D40992 / R40992C4: got 'n.a.'
## Warning: Expecting numeric in D40993 / R40993C4: got 'n.a.'
## Warning: Expecting numeric in D40994 / R40994C4: got 'n.a.'
## Warning: Expecting numeric in D40995 / R40995C4: got 'n.a.'
## Warning: Expecting numeric in D40996 / R40996C4: got 'n.a.'
## Warning: Expecting numeric in D40997 / R40997C4: got 'n.a.'
## Warning: Expecting numeric in D40998 / R40998C4: got 'n.a.'
## Warning: Expecting numeric in D40999 / R40999C4: got 'n.a.'
## Warning: Expecting numeric in D41000 / R41000C4: got 'n.a.'
## Warning: Expecting numeric in D41001 / R41001C4: got 'n.a.'
## Warning: Expecting numeric in D41002 / R41002C4: got 'n.a.'
## Warning: Expecting numeric in D41003 / R41003C4: got 'n.a.'
## Warning: Expecting numeric in D41004 / R41004C4: got 'n.a.'
## Warning: Expecting numeric in D41005 / R41005C4: got 'n.a.'
## Warning: Expecting numeric in D41006 / R41006C4: got 'n.a.'
## Warning: Expecting numeric in D41007 / R41007C4: got 'n.a.'
## Warning: Expecting numeric in D41008 / R41008C4: got 'n.a.'
## Warning: Expecting numeric in D41009 / R41009C4: got 'n.a.'
## Warning: Expecting numeric in D41010 / R41010C4: got 'n.a.'
## Warning: Expecting numeric in D41011 / R41011C4: got 'n.a.'
## Warning: Expecting numeric in D41012 / R41012C4: got 'n.a.'
## Warning: Expecting numeric in D41013 / R41013C4: got 'n.a.'
## Warning: Expecting numeric in D41014 / R41014C4: got 'n.a.'
## Warning: Expecting numeric in D41015 / R41015C4: got 'n.a.'
## Warning: Expecting numeric in D41016 / R41016C4: got 'n.a.'
## Warning: Expecting numeric in D41017 / R41017C4: got 'n.a.'
## Warning: Expecting numeric in D41018 / R41018C4: got 'n.a.'
## Warning: Expecting numeric in D41019 / R41019C4: got 'n.a.'
## Warning: Expecting numeric in D41020 / R41020C4: got 'n.a.'
## Warning: Expecting numeric in D41021 / R41021C4: got 'n.a.'
## Warning: Expecting numeric in D41022 / R41022C4: got 'n.a.'
## Warning: Expecting numeric in D41023 / R41023C4: got 'n.a.'
## Warning: Expecting numeric in D41024 / R41024C4: got 'n.a.'
## Warning: Expecting numeric in D41025 / R41025C4: got 'n.a.'
## Warning: Expecting numeric in D41026 / R41026C4: got 'n.a.'
## Warning: Expecting numeric in D41027 / R41027C4: got 'n.a.'
## Warning: Expecting numeric in D41028 / R41028C4: got 'n.a.'
## Warning: Expecting numeric in D41029 / R41029C4: got 'n.a.'
## Warning: Expecting numeric in D41030 / R41030C4: got 'n.a.'
## Warning: Expecting numeric in D41031 / R41031C4: got 'n.a.'
## Warning: Expecting numeric in D41032 / R41032C4: got 'n.a.'
## Warning: Expecting numeric in D41033 / R41033C4: got 'n.a.'
## Warning: Expecting numeric in D41034 / R41034C4: got 'n.a.'
## Warning: Expecting numeric in D41035 / R41035C4: got 'n.a.'
## Warning: Expecting numeric in D41036 / R41036C4: got 'n.a.'
## Warning: Expecting numeric in D41037 / R41037C4: got 'n.a.'
## Warning: Expecting numeric in D41038 / R41038C4: got 'n.a.'
## Warning: Expecting numeric in D41039 / R41039C4: got 'n.a.'
## Warning: Expecting numeric in D41040 / R41040C4: got 'n.a.'
## Warning: Expecting numeric in D41041 / R41041C4: got 'n.a.'
## Warning: Expecting numeric in D41042 / R41042C4: got 'n.a.'
## Warning: Expecting numeric in D41043 / R41043C4: got 'n.a.'
## Warning: Expecting numeric in D41044 / R41044C4: got 'n.a.'
## Warning: Expecting numeric in D41045 / R41045C4: got 'n.a.'
## Warning: Expecting numeric in D41046 / R41046C4: got 'n.a.'
## Warning: Expecting numeric in D41047 / R41047C4: got 'n.a.'
## Warning: Expecting numeric in D41048 / R41048C4: got 'n.a.'
## Warning: Expecting numeric in D41049 / R41049C4: got 'n.a.'
## Warning: Expecting numeric in D41050 / R41050C4: got 'n.a.'
## Warning: Expecting numeric in D41051 / R41051C4: got 'n.a.'
## Warning: Expecting numeric in D41052 / R41052C4: got 'n.a.'
## Warning: Expecting numeric in D41053 / R41053C4: got 'n.a.'
## Warning: Expecting numeric in D41054 / R41054C4: got 'n.a.'
## Warning: Expecting numeric in D41055 / R41055C4: got 'n.a.'
## Warning: Expecting numeric in D41056 / R41056C4: got 'n.a.'
## Warning: Expecting numeric in D41057 / R41057C4: got 'n.a.'
## Warning: Expecting numeric in D41058 / R41058C4: got 'n.a.'
## Warning: Expecting numeric in D41059 / R41059C4: got 'n.a.'
## Warning: Expecting numeric in D41060 / R41060C4: got 'n.a.'
## Warning: Expecting numeric in D41061 / R41061C4: got 'n.a.'
## Warning: Expecting numeric in D41062 / R41062C4: got 'n.a.'
## Warning: Expecting numeric in D41063 / R41063C4: got 'n.a.'
## Warning: Expecting numeric in D41064 / R41064C4: got 'n.a.'
## Warning: Expecting numeric in D41065 / R41065C4: got 'n.a.'
## Warning: Expecting numeric in D41066 / R41066C4: got 'n.a.'
## Warning: Expecting numeric in D41067 / R41067C4: got 'n.a.'
## Warning: Expecting numeric in D41068 / R41068C4: got 'n.a.'
## Warning: Expecting numeric in D41069 / R41069C4: got 'n.a.'
## Warning: Expecting numeric in D41070 / R41070C4: got 'n.a.'
## Warning: Expecting numeric in D41071 / R41071C4: got 'n.a.'
## Warning: Expecting numeric in D41072 / R41072C4: got 'n.a.'
## Warning: Expecting numeric in D41073 / R41073C4: got 'n.a.'
## Warning: Expecting numeric in D41074 / R41074C4: got 'n.a.'
## Warning: Expecting numeric in D41075 / R41075C4: got 'n.a.'
## Warning: Expecting numeric in D41076 / R41076C4: got 'n.a.'
## Warning: Expecting numeric in D41077 / R41077C4: got 'n.a.'
## Warning: Expecting numeric in D41078 / R41078C4: got 'n.a.'
## Warning: Expecting numeric in D41079 / R41079C4: got 'n.a.'
## Warning: Expecting numeric in D41080 / R41080C4: got 'n.a.'
## Warning: Expecting numeric in D41081 / R41081C4: got 'n.a.'
## Warning: Expecting numeric in D41082 / R41082C4: got 'n.a.'
## Warning: Expecting numeric in D41083 / R41083C4: got 'n.a.'
## Warning: Expecting numeric in D41084 / R41084C4: got 'n.a.'
## Warning: Expecting numeric in D41085 / R41085C4: got 'n.a.'
## Warning: Expecting numeric in D41086 / R41086C4: got 'n.a.'
## Warning: Expecting numeric in D41087 / R41087C4: got 'n.a.'
## Warning: Expecting numeric in D41088 / R41088C4: got 'n.a.'
## Warning: Expecting numeric in D41089 / R41089C4: got 'n.a.'
## Warning: Expecting numeric in D41090 / R41090C4: got 'n.a.'
## Warning: Expecting numeric in D41091 / R41091C4: got 'n.a.'
## Warning: Expecting numeric in D41092 / R41092C4: got 'n.a.'
## Warning: Expecting numeric in D41093 / R41093C4: got 'n.a.'
## Warning: Expecting numeric in D41094 / R41094C4: got 'n.a.'
## Warning: Expecting numeric in D41095 / R41095C4: got 'n.a.'
## Warning: Expecting numeric in D41096 / R41096C4: got 'n.a.'
## Warning: Expecting numeric in D41097 / R41097C4: got 'n.a.'
## Warning: Expecting numeric in D41098 / R41098C4: got 'n.a.'
## Warning: Expecting numeric in D41099 / R41099C4: got 'n.a.'
## Warning: Expecting numeric in D41100 / R41100C4: got 'n.a.'
## Warning: Expecting numeric in D41101 / R41101C4: got 'n.a.'
## Warning: Expecting numeric in D41102 / R41102C4: got 'n.a.'
## Warning: Expecting numeric in D41103 / R41103C4: got 'n.a.'
## Warning: Expecting numeric in D41104 / R41104C4: got 'n.a.'
## Warning: Expecting numeric in D41105 / R41105C4: got 'n.a.'
## Warning: Expecting numeric in D41106 / R41106C4: got 'n.a.'
## Warning: Expecting numeric in D41107 / R41107C4: got 'n.a.'
## Warning: Expecting numeric in D41108 / R41108C4: got 'n.a.'
## Warning: Expecting numeric in D41109 / R41109C4: got 'n.a.'
## Warning: Expecting numeric in D41110 / R41110C4: got 'n.a.'
## Warning: Expecting numeric in D41111 / R41111C4: got 'n.a.'
## Warning: Expecting numeric in D41112 / R41112C4: got 'n.a.'
## Warning: Expecting numeric in D41113 / R41113C4: got 'n.a.'
## Warning: Expecting numeric in D41114 / R41114C4: got 'n.a.'
## Warning: Expecting numeric in D41115 / R41115C4: got 'n.a.'
## Warning: Expecting numeric in D41116 / R41116C4: got 'n.a.'
## Warning: Expecting numeric in D41117 / R41117C4: got 'n.a.'
## Warning: Expecting numeric in D41118 / R41118C4: got 'n.a.'
## Warning: Expecting numeric in D41119 / R41119C4: got 'n.a.'
## Warning: Expecting numeric in D41120 / R41120C4: got 'n.a.'
## Warning: Expecting numeric in D41121 / R41121C4: got 'n.a.'
## Warning: Expecting numeric in D41122 / R41122C4: got 'n.a.'
## Warning: Expecting numeric in D41123 / R41123C4: got 'n.a.'
## Warning: Expecting numeric in D41124 / R41124C4: got 'n.a.'
## Warning: Expecting numeric in D41125 / R41125C4: got 'n.a.'
## Warning: Expecting numeric in D41126 / R41126C4: got 'n.a.'
## Warning: Expecting numeric in D41127 / R41127C4: got 'n.a.'
## Warning: Expecting numeric in D41128 / R41128C4: got 'n.a.'
## Warning: Expecting numeric in D41129 / R41129C4: got 'n.a.'
## Warning: Expecting numeric in D41130 / R41130C4: got 'n.a.'
## Warning: Expecting numeric in D41131 / R41131C4: got 'n.a.'
## Warning: Expecting numeric in D41132 / R41132C4: got 'n.a.'
## Warning: Expecting numeric in D41133 / R41133C4: got 'n.a.'
## Warning: Expecting numeric in D41134 / R41134C4: got 'n.a.'
## Warning: Expecting numeric in D41135 / R41135C4: got 'n.a.'
## Warning: Expecting numeric in D41136 / R41136C4: got 'n.a.'
## Warning: Expecting numeric in D41137 / R41137C4: got 'n.a.'
## Warning: Expecting numeric in D41138 / R41138C4: got 'n.a.'
## Warning: Expecting numeric in D41139 / R41139C4: got 'n.a.'
## Warning: Expecting numeric in D41140 / R41140C4: got 'n.a.'
## Warning: Expecting numeric in D41141 / R41141C4: got 'n.a.'
## Warning: Expecting numeric in D41142 / R41142C4: got 'n.a.'
## Warning: Expecting numeric in D41143 / R41143C4: got 'n.a.'
## Warning: Expecting numeric in D41144 / R41144C4: got 'n.a.'
## Warning: Expecting numeric in D41145 / R41145C4: got 'n.a.'
## Warning: Expecting numeric in D41146 / R41146C4: got 'n.a.'
## Warning: Expecting numeric in D41147 / R41147C4: got 'n.a.'
## Warning: Expecting numeric in D41148 / R41148C4: got 'n.a.'
## Warning: Expecting numeric in D41149 / R41149C4: got 'n.a.'
## Warning: Expecting numeric in D41150 / R41150C4: got 'n.a.'
## Warning: Expecting numeric in D41151 / R41151C4: got 'n.a.'
## Warning: Expecting numeric in D41152 / R41152C4: got 'n.a.'
## Warning: Expecting numeric in D41153 / R41153C4: got 'n.a.'
## Warning: Expecting numeric in D41154 / R41154C4: got 'n.a.'
## Warning: Expecting numeric in D41155 / R41155C4: got 'n.a.'
## Warning: Expecting numeric in D41156 / R41156C4: got 'n.a.'
## Warning: Expecting numeric in D41157 / R41157C4: got 'n.a.'
## Warning: Expecting numeric in D41158 / R41158C4: got 'n.a.'
## Warning: Expecting numeric in D41159 / R41159C4: got 'n.a.'
## Warning: Expecting numeric in D41160 / R41160C4: got 'n.a.'
## Warning: Expecting numeric in D41161 / R41161C4: got 'n.a.'
## Warning: Expecting numeric in D41162 / R41162C4: got 'n.a.'
## Warning: Expecting numeric in D41163 / R41163C4: got 'n.a.'
## Warning: Expecting numeric in D41164 / R41164C4: got 'n.a.'
## Warning: Expecting numeric in D41165 / R41165C4: got 'n.a.'
## Warning: Expecting numeric in D41166 / R41166C4: got 'n.a.'
## Warning: Expecting numeric in D41167 / R41167C4: got 'n.a.'
## Warning: Expecting numeric in D41168 / R41168C4: got 'n.a.'
## Warning: Expecting numeric in D41169 / R41169C4: got 'n.a.'
## Warning: Expecting numeric in D41170 / R41170C4: got 'n.a.'
## Warning: Expecting numeric in D41171 / R41171C4: got 'n.a.'
## Warning: Expecting numeric in D41172 / R41172C4: got 'n.a.'
## Warning: Expecting numeric in D41173 / R41173C4: got 'n.a.'
## Warning: Expecting numeric in D41174 / R41174C4: got 'n.a.'
## Warning: Expecting numeric in D41175 / R41175C4: got 'n.a.'
## Warning: Expecting numeric in D41176 / R41176C4: got 'n.a.'
## Warning: Expecting numeric in D41177 / R41177C4: got 'n.a.'
## Warning: Expecting numeric in D41178 / R41178C4: got 'n.a.'
## Warning: Expecting numeric in D41179 / R41179C4: got 'n.a.'
## Warning: Expecting numeric in D41180 / R41180C4: got 'n.a.'
## Warning: Expecting numeric in D41181 / R41181C4: got 'n.a.'
## Warning: Expecting numeric in D41182 / R41182C4: got 'n.a.'
## Warning: Expecting numeric in D41183 / R41183C4: got 'n.a.'
## Warning: Expecting numeric in D41184 / R41184C4: got 'n.a.'
## Warning: Expecting numeric in D41185 / R41185C4: got 'n.a.'
## Warning: Expecting numeric in D41186 / R41186C4: got 'n.a.'
## Warning: Expecting numeric in D41187 / R41187C4: got 'n.a.'
## Warning: Expecting numeric in D41188 / R41188C4: got 'n.a.'
## Warning: Expecting numeric in D41189 / R41189C4: got 'n.a.'
## Warning: Expecting numeric in D41190 / R41190C4: got 'n.a.'
## Warning: Expecting numeric in D41191 / R41191C4: got 'n.a.'
## Warning: Expecting numeric in D41192 / R41192C4: got 'n.a.'
## Warning: Expecting numeric in D41193 / R41193C4: got 'n.a.'
## Warning: Expecting numeric in D41194 / R41194C4: got 'n.a.'
## Warning: Expecting numeric in D41195 / R41195C4: got 'n.a.'
## Warning: Expecting numeric in D41196 / R41196C4: got 'n.a.'
## Warning: Expecting numeric in D41197 / R41197C4: got 'n.a.'
## Warning: Expecting numeric in D41198 / R41198C4: got 'n.a.'
## Warning: Expecting numeric in D41199 / R41199C4: got 'n.a.'
## Warning: Expecting numeric in D41200 / R41200C4: got 'n.a.'
## Warning: Expecting numeric in D41201 / R41201C4: got 'n.a.'
## Warning: Expecting numeric in D41202 / R41202C4: got 'n.a.'
## Warning: Expecting numeric in D41203 / R41203C4: got 'n.a.'
## Warning: Expecting numeric in D41204 / R41204C4: got 'n.a.'
## Warning: Expecting numeric in D41205 / R41205C4: got 'n.a.'
## Warning: Expecting numeric in D41206 / R41206C4: got 'n.a.'
## Warning: Expecting numeric in D41207 / R41207C4: got 'n.a.'
## Warning: Expecting numeric in D41208 / R41208C4: got 'n.a.'
## Warning: Expecting numeric in D41209 / R41209C4: got 'n.a.'
## Warning: Expecting numeric in D41210 / R41210C4: got 'n.a.'
## Warning: Expecting numeric in D41211 / R41211C4: got 'n.a.'
## Warning: Expecting numeric in D41212 / R41212C4: got 'n.a.'
## Warning: Expecting numeric in D41213 / R41213C4: got 'n.a.'
## Warning: Expecting numeric in D41214 / R41214C4: got 'n.a.'
## Warning: Expecting numeric in D41215 / R41215C4: got 'n.a.'
## Warning: Expecting numeric in D41216 / R41216C4: got 'n.a.'
## Warning: Expecting numeric in D41217 / R41217C4: got 'n.a.'
## Warning: Expecting numeric in D41218 / R41218C4: got 'n.a.'
## Warning: Expecting numeric in D41219 / R41219C4: got 'n.a.'
## Warning: Expecting numeric in D41220 / R41220C4: got 'n.a.'
## Warning: Expecting numeric in D41221 / R41221C4: got 'n.a.'
## Warning: Expecting numeric in D41222 / R41222C4: got 'n.a.'
## Warning: Expecting numeric in D41223 / R41223C4: got 'n.a.'
## Warning: Expecting numeric in D41224 / R41224C4: got 'n.a.'
## Warning: Expecting numeric in D41225 / R41225C4: got 'n.a.'
## Warning: Expecting numeric in D41226 / R41226C4: got 'n.a.'
## Warning: Expecting numeric in D41227 / R41227C4: got 'n.a.'
## Warning: Expecting numeric in D41228 / R41228C4: got 'n.a.'
## Warning: Expecting numeric in D41229 / R41229C4: got 'n.a.'
## Warning: Expecting numeric in D41230 / R41230C4: got 'n.a.'
## Warning: Expecting numeric in D41231 / R41231C4: got 'n.a.'
## Warning: Expecting numeric in D41232 / R41232C4: got 'n.a.'
## Warning: Expecting numeric in D41233 / R41233C4: got 'n.a.'
## Warning: Expecting numeric in D41234 / R41234C4: got 'n.a.'
## Warning: Expecting numeric in D41235 / R41235C4: got 'n.a.'
## Warning: Expecting numeric in D41236 / R41236C4: got 'n.a.'
## Warning: Expecting numeric in D41237 / R41237C4: got 'n.a.'
## Warning: Expecting numeric in D41238 / R41238C4: got 'n.a.'
## Warning: Expecting numeric in D41239 / R41239C4: got 'n.a.'
## Warning: Expecting numeric in D41240 / R41240C4: got 'n.a.'
## Warning: Expecting numeric in D41241 / R41241C4: got 'n.a.'
## Warning: Expecting numeric in D41242 / R41242C4: got 'n.a.'
## Warning: Expecting numeric in D41243 / R41243C4: got 'n.a.'
## Warning: Expecting numeric in D41244 / R41244C4: got 'n.a.'
## Warning: Expecting numeric in D41245 / R41245C4: got 'n.a.'
## Warning: Expecting numeric in D41246 / R41246C4: got 'n.a.'
## Warning: Expecting numeric in D41247 / R41247C4: got 'n.a.'
## Warning: Expecting numeric in D41248 / R41248C4: got 'n.a.'
## Warning: Expecting numeric in D41249 / R41249C4: got 'n.a.'
## Warning: Expecting numeric in D41250 / R41250C4: got 'n.a.'
## Warning: Expecting numeric in D41251 / R41251C4: got 'n.a.'
## Warning: Expecting numeric in D41252 / R41252C4: got 'n.a.'
## Warning: Expecting numeric in D41253 / R41253C4: got 'n.a.'
## Warning: Expecting numeric in D41254 / R41254C4: got 'n.a.'
## Warning: Expecting numeric in D41255 / R41255C4: got 'n.a.'
## Warning: Expecting numeric in D41256 / R41256C4: got 'n.a.'
## Warning: Expecting numeric in D41257 / R41257C4: got 'n.a.'
## Warning: Expecting numeric in D41258 / R41258C4: got 'n.a.'
## Warning: Expecting numeric in D41259 / R41259C4: got 'n.a.'
## Warning: Expecting numeric in D41260 / R41260C4: got 'n.a.'
## Warning: Expecting numeric in D41261 / R41261C4: got 'n.a.'
## Warning: Expecting numeric in D41262 / R41262C4: got 'n.a.'
## Warning: Expecting numeric in D41263 / R41263C4: got 'n.a.'
## Warning: Expecting numeric in D41264 / R41264C4: got 'n.a.'
## Warning: Expecting numeric in D41265 / R41265C4: got 'n.a.'
## Warning: Expecting numeric in D41266 / R41266C4: got 'n.a.'
## Warning: Expecting numeric in D41267 / R41267C4: got 'n.a.'
## Warning: Expecting numeric in D41268 / R41268C4: got 'n.a.'
## Warning: Expecting numeric in D41269 / R41269C4: got 'n.a.'
## Warning: Expecting numeric in D41270 / R41270C4: got 'n.a.'
## Warning: Expecting numeric in D41271 / R41271C4: got 'n.a.'
## Warning: Expecting numeric in D41272 / R41272C4: got 'n.a.'
## Warning: Expecting numeric in D41273 / R41273C4: got 'n.a.'
## Warning: Expecting numeric in D41274 / R41274C4: got 'n.a.'
## Warning: Expecting numeric in D41275 / R41275C4: got 'n.a.'
## Warning: Expecting numeric in D41276 / R41276C4: got 'n.a.'
## Warning: Expecting numeric in D41277 / R41277C4: got 'n.a.'
## Warning: Expecting numeric in D41278 / R41278C4: got 'n.a.'
## Warning: Expecting numeric in D41279 / R41279C4: got 'n.a.'
## Warning: Expecting numeric in D41280 / R41280C4: got 'n.a.'
## Warning: Expecting numeric in D41281 / R41281C4: got 'n.a.'
## Warning: Expecting numeric in D41282 / R41282C4: got 'n.a.'
## Warning: Expecting numeric in D41283 / R41283C4: got 'n.a.'
## Warning: Expecting numeric in D41284 / R41284C4: got 'n.a.'
## Warning: Expecting numeric in D41285 / R41285C4: got 'n.a.'
## Warning: Expecting numeric in D41286 / R41286C4: got 'n.a.'
## Warning: Expecting numeric in D41287 / R41287C4: got 'n.a.'
## Warning: Expecting numeric in D41288 / R41288C4: got 'n.a.'
## Warning: Expecting numeric in D41289 / R41289C4: got 'n.a.'
## Warning: Expecting numeric in D41290 / R41290C4: got 'n.a.'
## Warning: Expecting numeric in D41291 / R41291C4: got 'n.a.'
## Warning: Expecting numeric in D41292 / R41292C4: got 'n.a.'
## Warning: Expecting numeric in D41293 / R41293C4: got 'n.a.'
## Warning: Expecting numeric in D41294 / R41294C4: got 'n.a.'
## Warning: Expecting numeric in D41295 / R41295C4: got 'n.a.'
## Warning: Expecting numeric in D41296 / R41296C4: got 'n.a.'
## Warning: Expecting numeric in D41297 / R41297C4: got 'n.a.'
## Warning: Expecting numeric in D41298 / R41298C4: got 'n.a.'
## Warning: Expecting numeric in D41299 / R41299C4: got 'n.a.'
## Warning: Expecting numeric in D41300 / R41300C4: got 'n.a.'
## Warning: Expecting numeric in D41301 / R41301C4: got 'n.a.'
## Warning: Expecting numeric in D41302 / R41302C4: got 'n.a.'
## Warning: Expecting numeric in D41303 / R41303C4: got 'n.a.'
## Warning: Expecting numeric in D41304 / R41304C4: got 'n.a.'
## Warning: Expecting numeric in D41305 / R41305C4: got 'n.a.'
## Warning: Expecting numeric in D41306 / R41306C4: got 'n.a.'
## Warning: Expecting numeric in D41307 / R41307C4: got 'n.a.'
## Warning: Expecting numeric in D41308 / R41308C4: got 'n.a.'
## Warning: Expecting numeric in D41309 / R41309C4: got 'n.a.'
## Warning: Expecting numeric in D41310 / R41310C4: got 'n.a.'
## Warning: Expecting numeric in D41311 / R41311C4: got 'n.a.'
## Warning: Expecting numeric in D41312 / R41312C4: got 'n.a.'
## Warning: Expecting numeric in D41313 / R41313C4: got 'n.a.'
## Warning: Expecting numeric in D41314 / R41314C4: got 'n.a.'
## Warning: Expecting numeric in D41315 / R41315C4: got 'n.a.'
## Warning: Expecting numeric in D41316 / R41316C4: got 'n.a.'
## Warning: Expecting numeric in D41317 / R41317C4: got 'n.a.'
## Warning: Expecting numeric in D41318 / R41318C4: got 'n.a.'
## Warning: Expecting numeric in D41319 / R41319C4: got 'n.a.'
## Warning: Expecting numeric in D41320 / R41320C4: got 'n.a.'
## Warning: Expecting numeric in D41321 / R41321C4: got 'n.a.'
## Warning: Expecting numeric in D41322 / R41322C4: got 'n.a.'
## Warning: Expecting numeric in D41323 / R41323C4: got 'n.a.'
## Warning: Expecting numeric in D41324 / R41324C4: got 'n.a.'
## Warning: Expecting numeric in D41325 / R41325C4: got 'n.a.'
## Warning: Expecting numeric in D41326 / R41326C4: got 'n.a.'
## Warning: Expecting numeric in D41327 / R41327C4: got 'n.a.'
## Warning: Expecting numeric in D41328 / R41328C4: got 'n.a.'
## Warning: Expecting numeric in D41329 / R41329C4: got 'n.a.'
## Warning: Expecting numeric in D41330 / R41330C4: got 'n.a.'
## Warning: Expecting numeric in D41331 / R41331C4: got 'n.a.'
## Warning: Expecting numeric in D41332 / R41332C4: got 'n.a.'
## Warning: Expecting numeric in D41333 / R41333C4: got 'n.a.'
## Warning: Expecting numeric in D41334 / R41334C4: got 'n.a.'
## Warning: Expecting numeric in D41335 / R41335C4: got 'n.a.'
## Warning: Expecting numeric in D41336 / R41336C4: got 'n.a.'
## Warning: Expecting numeric in D41337 / R41337C4: got 'n.a.'
## Warning: Expecting numeric in D41338 / R41338C4: got 'n.a.'
## Warning: Expecting numeric in D41339 / R41339C4: got 'n.a.'
## Warning: Expecting numeric in D41340 / R41340C4: got 'n.a.'
## Warning: Expecting numeric in D41341 / R41341C4: got 'n.a.'
## Warning: Expecting numeric in D41342 / R41342C4: got 'n.a.'
## Warning: Expecting numeric in D41343 / R41343C4: got 'n.a.'
## Warning: Expecting numeric in D41344 / R41344C4: got 'n.a.'
## Warning: Expecting numeric in D41345 / R41345C4: got 'n.a.'
## Warning: Expecting numeric in D41346 / R41346C4: got 'n.a.'
## Warning: Expecting numeric in D41347 / R41347C4: got 'n.a.'
## Warning: Expecting numeric in D41348 / R41348C4: got 'n.a.'
## Warning: Expecting numeric in D41349 / R41349C4: got 'n.a.'
## Warning: Expecting numeric in D41350 / R41350C4: got 'n.a.'
## Warning: Expecting numeric in D41351 / R41351C4: got 'n.a.'
## Warning: Expecting numeric in D41352 / R41352C4: got 'n.a.'
## Warning: Expecting numeric in D41353 / R41353C4: got 'n.a.'
## Warning: Expecting numeric in D41354 / R41354C4: got 'n.a.'
## Warning: Expecting numeric in D41355 / R41355C4: got 'n.a.'
## Warning: Expecting numeric in D41356 / R41356C4: got 'n.a.'
## Warning: Expecting numeric in D41357 / R41357C4: got 'n.a.'
## Warning: Expecting numeric in D41358 / R41358C4: got 'n.a.'
## Warning: Expecting numeric in D41359 / R41359C4: got 'n.a.'
## Warning: Expecting numeric in D41360 / R41360C4: got 'n.a.'
## Warning: Expecting numeric in D41361 / R41361C4: got 'n.a.'
## Warning: Expecting numeric in D41362 / R41362C4: got 'n.a.'
## Warning: Expecting numeric in D41363 / R41363C4: got 'n.a.'
## Warning: Expecting numeric in D41364 / R41364C4: got 'n.a.'
## Warning: Expecting numeric in D41365 / R41365C4: got 'n.a.'
## Warning: Expecting numeric in D41366 / R41366C4: got 'n.a.'
## Warning: Expecting numeric in D41367 / R41367C4: got 'n.a.'
## Warning: Expecting numeric in D41368 / R41368C4: got 'n.a.'
## Warning: Expecting numeric in D41369 / R41369C4: got 'n.a.'
## Warning: Expecting numeric in D41370 / R41370C4: got 'n.a.'
## Warning: Expecting numeric in D41371 / R41371C4: got 'n.a.'
## Warning: Expecting numeric in D41372 / R41372C4: got 'n.a.'
## Warning: Expecting numeric in D41373 / R41373C4: got 'n.a.'
## Warning: Expecting numeric in D41374 / R41374C4: got 'n.a.'
## Warning: Expecting numeric in D41375 / R41375C4: got 'n.a.'
## Warning: Expecting numeric in D41376 / R41376C4: got 'n.a.'
## Warning: Expecting numeric in D41377 / R41377C4: got 'n.a.'
## Warning: Expecting numeric in D41378 / R41378C4: got 'n.a.'
## Warning: Expecting numeric in D41379 / R41379C4: got 'n.a.'
## Warning: Expecting numeric in D41380 / R41380C4: got 'n.a.'
## Warning: Expecting numeric in D41381 / R41381C4: got 'n.a.'
## Warning: Expecting numeric in D41382 / R41382C4: got 'n.a.'
## Warning: Expecting numeric in D41383 / R41383C4: got 'n.a.'
## Warning: Expecting numeric in D41384 / R41384C4: got 'n.a.'
## Warning: Expecting numeric in D41385 / R41385C4: got 'n.a.'
## Warning: Expecting numeric in D41386 / R41386C4: got 'n.a.'
## Warning: Expecting numeric in D41387 / R41387C4: got 'n.a.'
## Warning: Expecting numeric in D41388 / R41388C4: got 'n.a.'
## Warning: Expecting numeric in D41389 / R41389C4: got 'n.a.'
## Warning: Expecting numeric in D41390 / R41390C4: got 'n.a.'
## Warning: Expecting numeric in D41391 / R41391C4: got 'n.a.'
## Warning: Expecting numeric in D41392 / R41392C4: got 'n.a.'
## Warning: Expecting numeric in D41393 / R41393C4: got 'n.a.'
## Warning: Expecting numeric in D41394 / R41394C4: got 'n.a.'
## Warning: Expecting numeric in D41395 / R41395C4: got 'n.a.'
## Warning: Expecting numeric in D41396 / R41396C4: got 'n.a.'
## Warning: Expecting numeric in D41397 / R41397C4: got 'n.a.'
## Warning: Expecting numeric in D41398 / R41398C4: got 'n.a.'
## Warning: Expecting numeric in D41399 / R41399C4: got 'n.a.'
## Warning: Expecting numeric in D41400 / R41400C4: got 'n.a.'
## Warning: Expecting numeric in D41401 / R41401C4: got 'n.a.'
## Warning: Expecting numeric in D41402 / R41402C4: got 'n.a.'
## Warning: Expecting numeric in D41403 / R41403C4: got 'n.a.'
## Warning: Expecting numeric in D41404 / R41404C4: got 'n.a.'
## Warning: Expecting numeric in D41405 / R41405C4: got 'n.a.'
## Warning: Expecting numeric in D41406 / R41406C4: got 'n.a.'
## Warning: Expecting numeric in D41407 / R41407C4: got 'n.a.'
## Warning: Expecting numeric in D41408 / R41408C4: got 'n.a.'
## Warning: Expecting numeric in D41409 / R41409C4: got 'n.a.'
## Warning: Expecting numeric in D41410 / R41410C4: got 'n.a.'
## Warning: Expecting numeric in D41411 / R41411C4: got 'n.a.'
## Warning: Expecting numeric in D41412 / R41412C4: got 'n.a.'
## Warning: Expecting numeric in D41413 / R41413C4: got 'n.a.'
## Warning: Expecting numeric in D41414 / R41414C4: got 'n.a.'
## Warning: Expecting numeric in D41415 / R41415C4: got 'n.a.'
## Warning: Expecting numeric in D41416 / R41416C4: got 'n.a.'
## Warning: Expecting numeric in D41417 / R41417C4: got 'n.a.'
## Warning: Expecting numeric in D41418 / R41418C4: got 'n.a.'
## Warning: Expecting numeric in D41419 / R41419C4: got 'n.a.'
## Warning: Expecting numeric in D41420 / R41420C4: got 'n.a.'
## Warning: Expecting numeric in D41421 / R41421C4: got 'n.a.'
## Warning: Expecting numeric in D41422 / R41422C4: got 'n.a.'
## Warning: Expecting numeric in D41423 / R41423C4: got 'n.a.'
## Warning: Expecting numeric in D41424 / R41424C4: got 'n.a.'
## Warning: Expecting numeric in D41425 / R41425C4: got 'n.a.'
## Warning: Expecting numeric in D41426 / R41426C4: got 'n.a.'
## Warning: Expecting numeric in D41427 / R41427C4: got 'n.a.'
## Warning: Expecting numeric in D41428 / R41428C4: got 'n.a.'
## Warning: Expecting numeric in D41429 / R41429C4: got 'n.a.'
## Warning: Expecting numeric in D41430 / R41430C4: got 'n.a.'
## Warning: Expecting numeric in D41431 / R41431C4: got 'n.a.'
## Warning: Expecting numeric in D41432 / R41432C4: got 'n.a.'
## Warning: Expecting numeric in D41433 / R41433C4: got 'n.a.'
## Warning: Expecting numeric in D41434 / R41434C4: got 'n.a.'
## Warning: Expecting numeric in D41435 / R41435C4: got 'n.a.'
## Warning: Expecting numeric in D41436 / R41436C4: got 'n.a.'
## Warning: Expecting numeric in D41437 / R41437C4: got 'n.a.'
## Warning: Expecting numeric in D41438 / R41438C4: got 'n.a.'
## Warning: Expecting numeric in D41439 / R41439C4: got 'n.a.'
## Warning: Expecting numeric in D41440 / R41440C4: got 'n.a.'
## Warning: Expecting numeric in D41441 / R41441C4: got 'n.a.'
## Warning: Expecting numeric in D41442 / R41442C4: got 'n.a.'
## Warning: Expecting numeric in D41443 / R41443C4: got 'n.a.'
## Warning: Expecting numeric in D41444 / R41444C4: got 'n.a.'
## Warning: Expecting numeric in D41445 / R41445C4: got 'n.a.'
## Warning: Expecting numeric in D41446 / R41446C4: got 'n.a.'
## Warning: Expecting numeric in D41447 / R41447C4: got 'n.a.'
## Warning: Expecting numeric in D41448 / R41448C4: got 'n.a.'
## Warning: Expecting numeric in D41449 / R41449C4: got 'n.a.'
## Warning: Expecting numeric in D41450 / R41450C4: got 'n.a.'
## Warning: Expecting numeric in D41451 / R41451C4: got 'n.a.'
## Warning: Expecting numeric in D41452 / R41452C4: got 'n.a.'
## Warning: Expecting numeric in D41453 / R41453C4: got 'n.a.'
## Warning: Expecting numeric in D41454 / R41454C4: got 'n.a.'
## Warning: Expecting numeric in D41455 / R41455C4: got 'n.a.'
## Warning: Expecting numeric in D41456 / R41456C4: got 'n.a.'
## Warning: Expecting numeric in D41457 / R41457C4: got 'n.a.'
## Warning: Expecting numeric in D41458 / R41458C4: got 'n.a.'
## Warning: Expecting numeric in D41459 / R41459C4: got 'n.a.'
## Warning: Expecting numeric in D41460 / R41460C4: got 'n.a.'
## Warning: Expecting numeric in D41461 / R41461C4: got 'n.a.'
## Warning: Expecting numeric in D41462 / R41462C4: got 'n.a.'
## Warning: Expecting numeric in D41463 / R41463C4: got 'n.a.'
## Warning: Expecting numeric in D41464 / R41464C4: got 'n.a.'
## Warning: Expecting numeric in D41465 / R41465C4: got 'n.a.'
## Warning: Expecting numeric in D41466 / R41466C4: got 'n.a.'
## Warning: Expecting numeric in D41467 / R41467C4: got 'n.a.'
## Warning: Expecting numeric in D41468 / R41468C4: got 'n.a.'
## Warning: Expecting numeric in D41469 / R41469C4: got 'n.a.'
## Warning: Expecting numeric in D41470 / R41470C4: got 'n.a.'
## Warning: Expecting numeric in D41471 / R41471C4: got 'n.a.'
## Warning: Expecting numeric in D41472 / R41472C4: got 'n.a.'
## Warning: Expecting numeric in D41473 / R41473C4: got 'n.a.'
## Warning: Expecting numeric in D41474 / R41474C4: got 'n.a.'
## Warning: Expecting numeric in D41475 / R41475C4: got 'n.a.'
## Warning: Expecting numeric in D41476 / R41476C4: got 'n.a.'
## Warning: Expecting numeric in D41477 / R41477C4: got 'n.a.'
## Warning: Expecting numeric in D41478 / R41478C4: got 'n.a.'
## Warning: Expecting numeric in D41479 / R41479C4: got 'n.a.'
## Warning: Expecting numeric in D41480 / R41480C4: got 'n.a.'
## Warning: Expecting numeric in D41481 / R41481C4: got 'n.a.'
## Warning: Expecting numeric in D41482 / R41482C4: got 'n.a.'
## Warning: Expecting numeric in D41483 / R41483C4: got 'n.a.'
## Warning: Expecting numeric in D41484 / R41484C4: got 'n.a.'
## Warning: Expecting numeric in D41485 / R41485C4: got 'n.a.'
## Warning: Expecting numeric in D41486 / R41486C4: got 'n.a.'
## Warning: Expecting numeric in D41487 / R41487C4: got 'n.a.'
## Warning: Expecting numeric in D41488 / R41488C4: got 'n.a.'
## Warning: Expecting numeric in D41489 / R41489C4: got 'n.a.'
## Warning: Expecting numeric in D41490 / R41490C4: got 'n.a.'
## Warning: Expecting numeric in D41491 / R41491C4: got 'n.a.'
## Warning: Expecting numeric in D41492 / R41492C4: got 'n.a.'
## Warning: Expecting numeric in D41493 / R41493C4: got 'n.a.'
## Warning: Expecting numeric in D41494 / R41494C4: got 'n.a.'
## Warning: Expecting numeric in D41495 / R41495C4: got 'n.a.'
## Warning: Expecting numeric in D41496 / R41496C4: got 'n.a.'
## Warning: Expecting numeric in D41497 / R41497C4: got 'n.a.'
## Warning: Expecting numeric in D41498 / R41498C4: got 'n.a.'
## Warning: Expecting numeric in D41499 / R41499C4: got 'n.a.'
## Warning: Expecting numeric in D41500 / R41500C4: got 'n.a.'
## Warning: Expecting numeric in D41501 / R41501C4: got 'n.a.'
## Warning: Expecting numeric in D41502 / R41502C4: got 'n.a.'
## Warning: Expecting numeric in D41503 / R41503C4: got 'n.a.'
## Warning: Expecting numeric in D41504 / R41504C4: got 'n.a.'
## Warning: Expecting numeric in D41505 / R41505C4: got 'n.a.'
## Warning: Expecting numeric in D41506 / R41506C4: got 'n.a.'
## Warning: Expecting numeric in D41507 / R41507C4: got 'n.a.'
## Warning: Expecting numeric in D41508 / R41508C4: got 'n.a.'
## Warning: Expecting numeric in D41509 / R41509C4: got 'n.a.'
## Warning: Expecting numeric in D41510 / R41510C4: got 'n.a.'
## Warning: Expecting numeric in D41511 / R41511C4: got 'n.a.'
## Warning: Expecting numeric in D41512 / R41512C4: got 'n.a.'
## Warning: Expecting numeric in D41513 / R41513C4: got 'n.a.'
## Warning: Expecting numeric in D41514 / R41514C4: got 'n.a.'
## Warning: Expecting numeric in D41515 / R41515C4: got 'n.a.'
## Warning: Expecting numeric in D41516 / R41516C4: got 'n.a.'
## Warning: Expecting numeric in D41517 / R41517C4: got 'n.a.'
## Warning: Expecting numeric in D41518 / R41518C4: got 'n.a.'
## Warning: Expecting numeric in D41519 / R41519C4: got 'n.a.'
## Warning: Expecting numeric in D41520 / R41520C4: got 'n.a.'
## Warning: Expecting numeric in D41521 / R41521C4: got 'n.a.'
## Warning: Expecting numeric in D41522 / R41522C4: got 'n.a.'
## Warning: Expecting numeric in D41523 / R41523C4: got 'n.a.'
## Warning: Expecting numeric in D41524 / R41524C4: got 'n.a.'
## Warning: Expecting numeric in D41525 / R41525C4: got 'n.a.'
## Warning: Expecting numeric in D41526 / R41526C4: got 'n.a.'
## Warning: Expecting numeric in D41527 / R41527C4: got 'n.a.'
## Warning: Expecting numeric in D41528 / R41528C4: got 'n.a.'
## Warning: Expecting numeric in D41529 / R41529C4: got 'n.a.'
## Warning: Expecting numeric in D41530 / R41530C4: got 'n.a.'
## Warning: Expecting numeric in D41531 / R41531C4: got 'n.a.'
## Warning: Expecting numeric in D41532 / R41532C4: got 'n.a.'
## Warning: Expecting numeric in D41533 / R41533C4: got 'n.a.'
## Warning: Expecting numeric in D41534 / R41534C4: got 'n.a.'
## Warning: Expecting numeric in D41535 / R41535C4: got 'n.a.'
## Warning: Expecting numeric in D41536 / R41536C4: got 'n.a.'
## Warning: Expecting numeric in D41537 / R41537C4: got 'n.a.'
## Warning: Expecting numeric in D41538 / R41538C4: got 'n.a.'
## Warning: Expecting numeric in D41539 / R41539C4: got 'n.a.'
## Warning: Expecting numeric in D41540 / R41540C4: got 'n.a.'
## Warning: Expecting numeric in D41541 / R41541C4: got 'n.a.'
## Warning: Expecting numeric in D41542 / R41542C4: got 'n.a.'
## Warning: Expecting numeric in D41543 / R41543C4: got 'n.a.'
## Warning: Expecting numeric in D41544 / R41544C4: got 'n.a.'
## Warning: Expecting numeric in D41545 / R41545C4: got 'n.a.'
## Warning: Expecting numeric in D41546 / R41546C4: got 'n.a.'
## Warning: Expecting numeric in D41547 / R41547C4: got 'n.a.'
## Warning: Expecting numeric in D41548 / R41548C4: got 'n.a.'
## Warning: Expecting numeric in D41549 / R41549C4: got 'n.a.'
## Warning: Expecting numeric in D41550 / R41550C4: got 'n.a.'
## Warning: Expecting numeric in D41551 / R41551C4: got 'n.a.'
## Warning: Expecting numeric in D41552 / R41552C4: got 'n.a.'
## Warning: Expecting numeric in D41553 / R41553C4: got 'n.a.'
## Warning: Expecting numeric in D41554 / R41554C4: got 'n.a.'
## Warning: Expecting numeric in D41555 / R41555C4: got 'n.a.'
## Warning: Expecting numeric in D41556 / R41556C4: got 'n.a.'
## Warning: Expecting numeric in D41557 / R41557C4: got 'n.a.'
## Warning: Expecting numeric in D41558 / R41558C4: got 'n.a.'
## Warning: Expecting numeric in D41559 / R41559C4: got 'n.a.'
## Warning: Expecting numeric in D41560 / R41560C4: got 'n.a.'
## Warning: Expecting numeric in D41561 / R41561C4: got 'n.a.'
## Warning: Expecting numeric in D41562 / R41562C4: got 'n.a.'
## Warning: Expecting numeric in D41563 / R41563C4: got 'n.a.'
## Warning: Expecting numeric in D41564 / R41564C4: got 'n.a.'
## Warning: Expecting numeric in D41565 / R41565C4: got 'n.a.'
## Warning: Expecting numeric in D41566 / R41566C4: got 'n.a.'
## Warning: Expecting numeric in D41567 / R41567C4: got 'n.a.'
## Warning: Expecting numeric in D41568 / R41568C4: got 'n.a.'
## Warning: Expecting numeric in D41569 / R41569C4: got 'n.a.'
## Warning: Expecting numeric in D41570 / R41570C4: got 'n.a.'
## Warning: Expecting numeric in D41571 / R41571C4: got 'n.a.'
## Warning: Expecting numeric in D41572 / R41572C4: got 'n.a.'
## Warning: Expecting numeric in D41573 / R41573C4: got 'n.a.'
## Warning: Expecting numeric in D41574 / R41574C4: got 'n.a.'
## Warning: Expecting numeric in D41575 / R41575C4: got 'n.a.'
## Warning: Expecting numeric in D41576 / R41576C4: got 'n.a.'
## Warning: Expecting numeric in D41577 / R41577C4: got 'n.a.'
## Warning: Expecting numeric in D41578 / R41578C4: got 'n.a.'
## Warning: Expecting numeric in D41579 / R41579C4: got 'n.a.'
## Warning: Expecting numeric in D41580 / R41580C4: got 'n.a.'
## Warning: Expecting numeric in D41581 / R41581C4: got 'n.a.'
## Warning: Expecting numeric in D41582 / R41582C4: got 'n.a.'
## Warning: Expecting numeric in D41583 / R41583C4: got 'n.a.'
## Warning: Expecting numeric in D41584 / R41584C4: got 'n.a.'
## Warning: Expecting numeric in D41585 / R41585C4: got 'n.a.'
## Warning: Expecting numeric in D41586 / R41586C4: got 'n.a.'
## Warning: Expecting numeric in D41587 / R41587C4: got 'n.a.'
## Warning: Expecting numeric in D41588 / R41588C4: got 'n.a.'
## Warning: Expecting numeric in D41589 / R41589C4: got 'n.a.'
## Warning: Expecting numeric in D41590 / R41590C4: got 'n.a.'
## Warning: Expecting numeric in D41591 / R41591C4: got 'n.a.'
## Warning: Expecting numeric in D41592 / R41592C4: got 'n.a.'
## Warning: Expecting numeric in D41593 / R41593C4: got 'n.a.'
## Warning: Expecting numeric in D41594 / R41594C4: got 'n.a.'
## Warning: Expecting numeric in D41595 / R41595C4: got 'n.a.'
## Warning: Expecting numeric in D41596 / R41596C4: got 'n.a.'
## Warning: Expecting numeric in D41597 / R41597C4: got 'n.a.'
## Warning: Expecting numeric in D41598 / R41598C4: got 'n.a.'
## Warning: Expecting numeric in D41599 / R41599C4: got 'n.a.'
## Warning: Expecting numeric in D41600 / R41600C4: got 'n.a.'
## Warning: Expecting numeric in D41601 / R41601C4: got 'n.a.'
## Warning: Expecting numeric in D41602 / R41602C4: got 'n.a.'
## Warning: Expecting numeric in D41603 / R41603C4: got 'n.a.'
## Warning: Expecting numeric in D41604 / R41604C4: got 'n.a.'
## Warning: Expecting numeric in D41605 / R41605C4: got 'n.a.'
## Warning: Expecting numeric in D41606 / R41606C4: got 'n.a.'
## Warning: Expecting numeric in D41607 / R41607C4: got 'n.a.'
## Warning: Expecting numeric in D41608 / R41608C4: got 'n.a.'
## Warning: Expecting numeric in D41609 / R41609C4: got 'n.a.'
## Warning: Expecting numeric in D41610 / R41610C4: got 'n.a.'
## Warning: Expecting numeric in D41611 / R41611C4: got 'n.a.'
## Warning: Expecting numeric in D41612 / R41612C4: got 'n.a.'
## Warning: Expecting numeric in D41613 / R41613C4: got 'n.a.'
## Warning: Expecting numeric in D41614 / R41614C4: got 'n.a.'
## Warning: Expecting numeric in D41615 / R41615C4: got 'n.a.'
## Warning: Expecting numeric in D41616 / R41616C4: got 'n.a.'
## Warning: Expecting numeric in D41617 / R41617C4: got 'n.a.'
## Warning: Expecting numeric in D41618 / R41618C4: got 'n.a.'
## Warning: Expecting numeric in D41619 / R41619C4: got 'n.a.'
## Warning: Expecting numeric in D41620 / R41620C4: got 'n.a.'
## Warning: Expecting numeric in D41621 / R41621C4: got 'n.a.'
## Warning: Expecting numeric in D41622 / R41622C4: got 'n.a.'
## Warning: Expecting numeric in D41623 / R41623C4: got 'n.a.'
## Warning: Expecting numeric in D41624 / R41624C4: got 'n.a.'
## Warning: Expecting numeric in D41625 / R41625C4: got 'n.a.'
## Warning: Expecting numeric in D41626 / R41626C4: got 'n.a.'
## Warning: Expecting numeric in D41627 / R41627C4: got 'n.a.'
## Warning: Expecting numeric in D41628 / R41628C4: got 'n.a.'
## Warning: Expecting numeric in D41629 / R41629C4: got 'n.a.'
## Warning: Expecting numeric in D41630 / R41630C4: got 'n.a.'
## Warning: Expecting numeric in D41631 / R41631C4: got 'n.a.'
## Warning: Expecting numeric in D41632 / R41632C4: got 'n.a.'
## Warning: Expecting numeric in D41633 / R41633C4: got 'n.a.'
## Warning: Expecting numeric in D41634 / R41634C4: got 'n.a.'
## Warning: Expecting numeric in D41635 / R41635C4: got 'n.a.'
## Warning: Expecting numeric in D41636 / R41636C4: got 'n.a.'
## Warning: Expecting numeric in D41637 / R41637C4: got 'n.a.'
## Warning: Expecting numeric in D41638 / R41638C4: got 'n.a.'
## Warning: Expecting numeric in D41639 / R41639C4: got 'n.a.'
## Warning: Expecting numeric in D41640 / R41640C4: got 'n.a.'
## Warning: Expecting numeric in D41641 / R41641C4: got 'n.a.'
## Warning: Expecting numeric in D41642 / R41642C4: got 'n.a.'
## Warning: Expecting numeric in D41643 / R41643C4: got 'n.a.'
## Warning: Expecting numeric in D41644 / R41644C4: got 'n.a.'
## Warning: Expecting numeric in D41645 / R41645C4: got 'n.a.'
## Warning: Expecting numeric in D41646 / R41646C4: got 'n.a.'
## Warning: Expecting numeric in D41647 / R41647C4: got 'n.a.'
## Warning: Expecting numeric in D41648 / R41648C4: got 'n.a.'
## Warning: Expecting numeric in D41649 / R41649C4: got 'n.a.'
## Warning: Expecting numeric in D41650 / R41650C4: got 'n.a.'
## Warning: Expecting numeric in D41651 / R41651C4: got 'n.a.'
## Warning: Expecting numeric in D41652 / R41652C4: got 'n.a.'
## Warning: Expecting numeric in D41653 / R41653C4: got 'n.a.'
## Warning: Expecting numeric in D41654 / R41654C4: got 'n.a.'
## Warning: Expecting numeric in D41655 / R41655C4: got 'n.a.'
## Warning: Expecting numeric in D41656 / R41656C4: got 'n.a.'
## Warning: Expecting numeric in D41657 / R41657C4: got 'n.a.'
## Warning: Expecting numeric in D41658 / R41658C4: got 'n.a.'
## Warning: Expecting numeric in D41659 / R41659C4: got 'n.a.'
## Warning: Expecting numeric in D41660 / R41660C4: got 'n.a.'
## Warning: Expecting numeric in D41661 / R41661C4: got 'n.a.'
## Warning: Expecting numeric in D41662 / R41662C4: got 'n.a.'
## Warning: Expecting numeric in D41663 / R41663C4: got 'n.a.'
## Warning: Expecting numeric in D41664 / R41664C4: got 'n.a.'
## Warning: Expecting numeric in D41665 / R41665C4: got 'n.a.'
## Warning: Expecting numeric in D41666 / R41666C4: got 'n.a.'
## Warning: Expecting numeric in D41667 / R41667C4: got 'n.a.'
## Warning: Expecting numeric in D41668 / R41668C4: got 'n.a.'
## Warning: Expecting numeric in D41669 / R41669C4: got 'n.a.'
## Warning: Expecting numeric in D41670 / R41670C4: got 'n.a.'
## Warning: Expecting numeric in D41671 / R41671C4: got 'n.a.'
## Warning: Expecting numeric in D41672 / R41672C4: got 'n.a.'
## Warning: Expecting numeric in D41673 / R41673C4: got 'n.a.'
## Warning: Expecting numeric in D41674 / R41674C4: got 'n.a.'
## Warning: Expecting numeric in D41675 / R41675C4: got 'n.a.'
## Warning: Expecting numeric in D41676 / R41676C4: got 'n.a.'
## Warning: Expecting numeric in D41677 / R41677C4: got 'n.a.'
## Warning: Expecting numeric in D41678 / R41678C4: got 'n.a.'
## Warning: Expecting numeric in D41679 / R41679C4: got 'n.a.'
## Warning: Expecting numeric in D41680 / R41680C4: got 'n.a.'
## Warning: Expecting numeric in D41681 / R41681C4: got 'n.a.'
## Warning: Expecting numeric in D41682 / R41682C4: got 'n.a.'
## Warning: Expecting numeric in D41683 / R41683C4: got 'n.a.'
## Warning: Expecting numeric in D41684 / R41684C4: got 'n.a.'
## Warning: Expecting numeric in D41685 / R41685C4: got 'n.a.'
## Warning: Expecting numeric in D41686 / R41686C4: got 'n.a.'
## Warning: Expecting numeric in D41687 / R41687C4: got 'n.a.'
## Warning: Expecting numeric in D41688 / R41688C4: got 'n.a.'
## Warning: Expecting numeric in D41689 / R41689C4: got 'n.a.'
## Warning: Expecting numeric in D41690 / R41690C4: got 'n.a.'
## Warning: Expecting numeric in D41691 / R41691C4: got 'n.a.'
## Warning: Expecting numeric in D41692 / R41692C4: got 'n.a.'
## Warning: Expecting numeric in D41693 / R41693C4: got 'n.a.'
## Warning: Expecting numeric in D41694 / R41694C4: got 'n.a.'
## Warning: Expecting numeric in D41695 / R41695C4: got 'n.a.'
## Warning: Expecting numeric in D41696 / R41696C4: got 'n.a.'
## Warning: Expecting numeric in D41697 / R41697C4: got 'n.a.'
## Warning: Expecting numeric in D41698 / R41698C4: got 'n.a.'
## Warning: Expecting numeric in D41699 / R41699C4: got 'n.a.'
## Warning: Expecting numeric in D41700 / R41700C4: got 'n.a.'
## Warning: Expecting numeric in D41701 / R41701C4: got 'n.a.'
## Warning: Expecting numeric in D41702 / R41702C4: got 'n.a.'
## Warning: Expecting numeric in D41703 / R41703C4: got 'n.a.'
## Warning: Expecting numeric in D41704 / R41704C4: got 'n.a.'
## Warning: Expecting numeric in D41705 / R41705C4: got 'n.a.'
## Warning: Expecting numeric in D41706 / R41706C4: got 'n.a.'
## Warning: Expecting numeric in D41707 / R41707C4: got 'n.a.'
## Warning: Expecting numeric in D41708 / R41708C4: got 'n.a.'
## Warning: Expecting numeric in D41709 / R41709C4: got 'n.a.'
## Warning: Expecting numeric in D41710 / R41710C4: got 'n.a.'
## Warning: Expecting numeric in D41711 / R41711C4: got 'n.a.'
## Warning: Expecting numeric in D41712 / R41712C4: got 'n.a.'
## Warning: Expecting numeric in D41713 / R41713C4: got 'n.a.'
## Warning: Expecting numeric in D41714 / R41714C4: got 'n.a.'
## Warning: Expecting numeric in D41715 / R41715C4: got 'n.a.'
## Warning: Expecting numeric in D41716 / R41716C4: got 'n.a.'
## Warning: Expecting numeric in D41717 / R41717C4: got 'n.a.'
## Warning: Expecting numeric in D41718 / R41718C4: got 'n.a.'
## Warning: Expecting numeric in D41719 / R41719C4: got 'n.a.'
## Warning: Expecting numeric in D41720 / R41720C4: got 'n.a.'
## Warning: Expecting numeric in D41721 / R41721C4: got 'n.a.'
## Warning: Expecting numeric in D41722 / R41722C4: got 'n.a.'
## Warning: Expecting numeric in D41723 / R41723C4: got 'n.a.'
## Warning: Expecting numeric in D41724 / R41724C4: got 'n.a.'
## Warning: Expecting numeric in D41725 / R41725C4: got 'n.a.'
## Warning: Expecting numeric in D41726 / R41726C4: got 'n.a.'
## Warning: Expecting numeric in D41727 / R41727C4: got 'n.a.'
## Warning: Expecting numeric in D41728 / R41728C4: got 'n.a.'
## Warning: Expecting numeric in D41729 / R41729C4: got 'n.a.'
## Warning: Expecting numeric in D41730 / R41730C4: got 'n.a.'
## Warning: Expecting numeric in D41731 / R41731C4: got 'n.a.'
## Warning: Expecting numeric in D41732 / R41732C4: got 'n.a.'
## Warning: Expecting numeric in D41733 / R41733C4: got 'n.a.'
## Warning: Expecting numeric in D41734 / R41734C4: got 'n.a.'
## Warning: Expecting numeric in D41735 / R41735C4: got 'n.a.'
## Warning: Expecting numeric in D41736 / R41736C4: got 'n.a.'
## Warning: Expecting numeric in D41737 / R41737C4: got 'n.a.'
## Warning: Expecting numeric in D41738 / R41738C4: got 'n.a.'
## Warning: Expecting numeric in D41739 / R41739C4: got 'n.a.'
## Warning: Expecting numeric in D41740 / R41740C4: got 'n.a.'
## Warning: Expecting numeric in D41741 / R41741C4: got 'n.a.'
## Warning: Expecting numeric in D41742 / R41742C4: got 'n.a.'
## Warning: Expecting numeric in D41743 / R41743C4: got 'n.a.'
## Warning: Expecting numeric in D41744 / R41744C4: got 'n.a.'
## Warning: Expecting numeric in D41745 / R41745C4: got 'n.a.'
## Warning: Expecting numeric in D41746 / R41746C4: got 'n.a.'
## Warning: Expecting numeric in D41747 / R41747C4: got 'n.a.'
## Warning: Expecting numeric in D41748 / R41748C4: got 'n.a.'
## Warning: Expecting numeric in D41749 / R41749C4: got 'n.a.'
## Warning: Expecting numeric in D41750 / R41750C4: got 'n.a.'
## Warning: Expecting numeric in D41751 / R41751C4: got 'n.a.'
## Warning: Expecting numeric in D41752 / R41752C4: got 'n.a.'
## Warning: Expecting numeric in D41753 / R41753C4: got 'n.a.'
## Warning: Expecting numeric in D41754 / R41754C4: got 'n.a.'
## Warning: Expecting numeric in D41755 / R41755C4: got 'n.a.'
## Warning: Expecting numeric in D41756 / R41756C4: got 'n.a.'
## Warning: Expecting numeric in D41757 / R41757C4: got 'n.a.'
## Warning: Expecting numeric in D41758 / R41758C4: got 'n.a.'
## Warning: Expecting numeric in D41759 / R41759C4: got 'n.a.'
## Warning: Expecting numeric in D41760 / R41760C4: got 'n.a.'
## Warning: Expecting numeric in D41761 / R41761C4: got 'n.a.'
## Warning: Expecting numeric in D41762 / R41762C4: got 'n.a.'
## Warning: Expecting numeric in D41763 / R41763C4: got 'n.a.'
## Warning: Expecting numeric in D41764 / R41764C4: got 'n.a.'
## Warning: Expecting numeric in D41765 / R41765C4: got 'n.a.'
## Warning: Expecting numeric in D41766 / R41766C4: got 'n.a.'
## Warning: Expecting numeric in D41767 / R41767C4: got 'n.a.'
## Warning: Expecting numeric in D41768 / R41768C4: got 'n.a.'
## Warning: Expecting numeric in D41769 / R41769C4: got 'n.a.'
## Warning: Expecting numeric in D41770 / R41770C4: got 'n.a.'
## Warning: Expecting numeric in D41771 / R41771C4: got 'n.a.'
## Warning: Expecting numeric in D41772 / R41772C4: got 'n.a.'
## Warning: Expecting numeric in D41773 / R41773C4: got 'n.a.'
## Warning: Expecting numeric in D41774 / R41774C4: got 'n.a.'
## Warning: Expecting numeric in D41775 / R41775C4: got 'n.a.'
## Warning: Expecting numeric in D41776 / R41776C4: got 'n.a.'
## Warning: Expecting numeric in D41777 / R41777C4: got 'n.a.'
## Warning: Expecting numeric in D41778 / R41778C4: got 'n.a.'
## Warning: Expecting numeric in D41779 / R41779C4: got 'n.a.'
## Warning: Expecting numeric in D41780 / R41780C4: got 'n.a.'
## Warning: Expecting numeric in D41781 / R41781C4: got 'n.a.'
## Warning: Expecting numeric in D41782 / R41782C4: got 'n.a.'
## Warning: Expecting numeric in D41783 / R41783C4: got 'n.a.'
## Warning: Expecting numeric in D41784 / R41784C4: got 'n.a.'
## Warning: Expecting numeric in D41785 / R41785C4: got 'n.a.'
## Warning: Expecting numeric in D41786 / R41786C4: got 'n.a.'
## Warning: Expecting numeric in D41787 / R41787C4: got 'n.a.'
## Warning: Expecting numeric in D41788 / R41788C4: got 'n.a.'
## Warning: Expecting numeric in D41789 / R41789C4: got 'n.a.'
## Warning: Expecting numeric in D41790 / R41790C4: got 'n.a.'
## Warning: Expecting numeric in D41791 / R41791C4: got 'n.a.'
## Warning: Expecting numeric in D41792 / R41792C4: got 'n.a.'
## Warning: Expecting numeric in D41793 / R41793C4: got 'n.a.'
## Warning: Expecting numeric in D41794 / R41794C4: got 'n.a.'
## Warning: Expecting numeric in D41795 / R41795C4: got 'n.a.'
## Warning: Expecting numeric in D41796 / R41796C4: got 'n.a.'
## Warning: Expecting numeric in D41797 / R41797C4: got 'n.a.'
## Warning: Expecting numeric in D41798 / R41798C4: got 'n.a.'
## Warning: Expecting numeric in D41799 / R41799C4: got 'n.a.'
## Warning: Expecting numeric in D41800 / R41800C4: got 'n.a.'
## Warning: Expecting numeric in D41801 / R41801C4: got 'n.a.'
## Warning: Expecting numeric in D41802 / R41802C4: got 'n.a.'
## Warning: Expecting numeric in D41803 / R41803C4: got 'n.a.'
## Warning: Expecting numeric in D41804 / R41804C4: got 'n.a.'
## Warning: Expecting numeric in D41805 / R41805C4: got 'n.a.'
## Warning: Expecting numeric in D41806 / R41806C4: got 'n.a.'
## Warning: Expecting numeric in D41807 / R41807C4: got 'n.a.'
## Warning: Expecting numeric in D41808 / R41808C4: got 'n.a.'
## Warning: Expecting numeric in D41809 / R41809C4: got 'n.a.'
## Warning: Expecting numeric in D41810 / R41810C4: got 'n.a.'
## Warning: Expecting numeric in D41811 / R41811C4: got 'n.a.'
## Warning: Expecting numeric in D41812 / R41812C4: got 'n.a.'
## Warning: Expecting numeric in D41813 / R41813C4: got 'n.a.'
## Warning: Expecting numeric in D41814 / R41814C4: got 'n.a.'
## Warning: Expecting numeric in D41815 / R41815C4: got 'n.a.'
## Warning: Expecting numeric in D41816 / R41816C4: got 'n.a.'
## Warning: Expecting numeric in D41817 / R41817C4: got 'n.a.'
## Warning: Expecting numeric in D41818 / R41818C4: got 'n.a.'
## Warning: Expecting numeric in D41819 / R41819C4: got 'n.a.'
## Warning: Expecting numeric in D41820 / R41820C4: got 'n.a.'
## Warning: Expecting numeric in D41821 / R41821C4: got 'n.a.'
## Warning: Expecting numeric in D41822 / R41822C4: got 'n.a.'
## Warning: Expecting numeric in D41823 / R41823C4: got 'n.a.'
## Warning: Expecting numeric in D41824 / R41824C4: got 'n.a.'
## Warning: Expecting numeric in D41825 / R41825C4: got 'n.a.'
## Warning: Expecting numeric in D41826 / R41826C4: got 'n.a.'
## Warning: Expecting numeric in D41827 / R41827C4: got 'n.a.'
## Warning: Expecting numeric in D41828 / R41828C4: got 'n.a.'
## Warning: Expecting numeric in D41829 / R41829C4: got 'n.a.'
## Warning: Expecting numeric in D41830 / R41830C4: got 'n.a.'
## Warning: Expecting numeric in D41831 / R41831C4: got 'n.a.'
## Warning: Expecting numeric in D41832 / R41832C4: got 'n.a.'
## Warning: Expecting numeric in D41833 / R41833C4: got 'n.a.'
## Warning: Expecting numeric in D41834 / R41834C4: got 'n.a.'
## Warning: Expecting numeric in D41835 / R41835C4: got 'n.a.'
## Warning: Expecting numeric in D41836 / R41836C4: got 'n.a.'
## Warning: Expecting numeric in D41837 / R41837C4: got 'n.a.'
## Warning: Expecting numeric in D41838 / R41838C4: got 'n.a.'
## Warning: Expecting numeric in D41839 / R41839C4: got 'n.a.'
## Warning: Expecting numeric in D41840 / R41840C4: got 'n.a.'
## Warning: Expecting numeric in D41841 / R41841C4: got 'n.a.'
## Warning: Expecting numeric in D41842 / R41842C4: got 'n.a.'
## Warning: Expecting numeric in D41843 / R41843C4: got 'n.a.'
## Warning: Expecting numeric in D41844 / R41844C4: got 'n.a.'
## Warning: Expecting numeric in D41845 / R41845C4: got 'n.a.'
## Warning: Expecting numeric in D41846 / R41846C4: got 'n.a.'
## Warning: Expecting numeric in D41847 / R41847C4: got 'n.a.'
## Warning: Expecting numeric in D41848 / R41848C4: got 'n.a.'
## Warning: Expecting numeric in D41849 / R41849C4: got 'n.a.'
## Warning: Expecting numeric in D41850 / R41850C4: got 'n.a.'
## Warning: Expecting numeric in D41851 / R41851C4: got 'n.a.'
## Warning: Expecting numeric in D41852 / R41852C4: got 'n.a.'
## Warning: Expecting numeric in D41853 / R41853C4: got 'n.a.'
## Warning: Expecting numeric in D41854 / R41854C4: got 'n.a.'
## Warning: Expecting numeric in D41855 / R41855C4: got 'n.a.'
## Warning: Expecting numeric in D41856 / R41856C4: got 'n.a.'
## Warning: Expecting numeric in D41857 / R41857C4: got 'n.a.'
## Warning: Expecting numeric in D41858 / R41858C4: got 'n.a.'
## Warning: Expecting numeric in D41859 / R41859C4: got 'n.a.'
## Warning: Expecting numeric in D41860 / R41860C4: got 'n.a.'
## Warning: Expecting numeric in D41861 / R41861C4: got 'n.a.'
## Warning: Expecting numeric in D41862 / R41862C4: got 'n.a.'
## Warning: Expecting numeric in D41863 / R41863C4: got 'n.a.'
## Warning: Expecting numeric in D41864 / R41864C4: got 'n.a.'
## Warning: Expecting numeric in D41865 / R41865C4: got 'n.a.'
## Warning: Expecting numeric in D41866 / R41866C4: got 'n.a.'
## Warning: Expecting numeric in D41867 / R41867C4: got 'n.a.'
## Warning: Expecting numeric in D41868 / R41868C4: got 'n.a.'
## Warning: Expecting numeric in D41869 / R41869C4: got 'n.a.'
## Warning: Expecting numeric in D41870 / R41870C4: got 'n.a.'
## Warning: Expecting numeric in D41871 / R41871C4: got 'n.a.'
## Warning: Expecting numeric in D41872 / R41872C4: got 'n.a.'
## Warning: Expecting numeric in D41873 / R41873C4: got 'n.a.'
## Warning: Expecting numeric in D41874 / R41874C4: got 'n.a.'
## Warning: Expecting numeric in D41875 / R41875C4: got 'n.a.'
## Warning: Expecting numeric in D41876 / R41876C4: got 'n.a.'
## Warning: Expecting numeric in D41877 / R41877C4: got 'n.a.'
## Warning: Expecting numeric in D41878 / R41878C4: got 'n.a.'
## Warning: Expecting numeric in D41879 / R41879C4: got 'n.a.'
## Warning: Expecting numeric in D41880 / R41880C4: got 'n.a.'
## Warning: Expecting numeric in D41881 / R41881C4: got 'n.a.'
## Warning: Expecting numeric in D41882 / R41882C4: got 'n.a.'
## Warning: Expecting numeric in D41883 / R41883C4: got 'n.a.'
## Warning: Expecting numeric in D41884 / R41884C4: got 'n.a.'
## Warning: Expecting numeric in D41885 / R41885C4: got 'n.a.'
## Warning: Expecting numeric in D41886 / R41886C4: got 'n.a.'
## Warning: Expecting numeric in D41887 / R41887C4: got 'n.a.'
## Warning: Expecting numeric in D41888 / R41888C4: got 'n.a.'
## Warning: Expecting numeric in D41889 / R41889C4: got 'n.a.'
## Warning: Expecting numeric in D41890 / R41890C4: got 'n.a.'
## Warning: Expecting numeric in D41891 / R41891C4: got 'n.a.'
## Warning: Expecting numeric in D41892 / R41892C4: got 'n.a.'
## Warning: Expecting numeric in D41893 / R41893C4: got 'n.a.'
## Warning: Expecting numeric in D41894 / R41894C4: got 'n.a.'
## Warning: Expecting numeric in D41895 / R41895C4: got 'n.a.'
## Warning: Expecting numeric in D41896 / R41896C4: got 'n.a.'
## Warning: Expecting numeric in D41897 / R41897C4: got 'n.a.'
## Warning: Expecting numeric in D41898 / R41898C4: got 'n.a.'
## Warning: Expecting numeric in D41899 / R41899C4: got 'n.a.'
## Warning: Expecting numeric in D41900 / R41900C4: got 'n.a.'
## Warning: Expecting numeric in D41901 / R41901C4: got 'n.a.'
## Warning: Expecting numeric in D41902 / R41902C4: got 'n.a.'
## Warning: Expecting numeric in D41903 / R41903C4: got 'n.a.'
## Warning: Expecting numeric in D41904 / R41904C4: got 'n.a.'
## Warning: Expecting numeric in D41905 / R41905C4: got 'n.a.'
## Warning: Expecting numeric in D41906 / R41906C4: got 'n.a.'
## Warning: Expecting numeric in D41907 / R41907C4: got 'n.a.'
## Warning: Expecting numeric in D41908 / R41908C4: got 'n.a.'
## Warning: Expecting numeric in D41909 / R41909C4: got 'n.a.'
## Warning: Expecting numeric in D41910 / R41910C4: got 'n.a.'
## Warning: Expecting numeric in D41911 / R41911C4: got 'n.a.'
## Warning: Expecting numeric in D41912 / R41912C4: got 'n.a.'
## Warning: Expecting numeric in D41913 / R41913C4: got 'n.a.'
## Warning: Expecting numeric in D41914 / R41914C4: got 'n.a.'
## Warning: Expecting numeric in D41915 / R41915C4: got 'n.a.'
## Warning: Expecting numeric in D41916 / R41916C4: got 'n.a.'
## Warning: Expecting numeric in D41917 / R41917C4: got 'n.a.'
## Warning: Expecting numeric in D41918 / R41918C4: got 'n.a.'
## Warning: Expecting numeric in D41919 / R41919C4: got 'n.a.'
## Warning: Expecting numeric in D41920 / R41920C4: got 'n.a.'
## Warning: Expecting numeric in D41921 / R41921C4: got 'n.a.'
## Warning: Expecting numeric in D41922 / R41922C4: got 'n.a.'
## Warning: Expecting numeric in D41923 / R41923C4: got 'n.a.'
## Warning: Expecting numeric in D41924 / R41924C4: got 'n.a.'
## Warning: Expecting numeric in D41925 / R41925C4: got 'n.a.'
## Warning: Expecting numeric in D41926 / R41926C4: got 'n.a.'
## Warning: Expecting numeric in D41927 / R41927C4: got 'n.a.'
## Warning: Expecting numeric in D41928 / R41928C4: got 'n.a.'
## Warning: Expecting numeric in D41929 / R41929C4: got 'n.a.'
## Warning: Expecting numeric in D41930 / R41930C4: got 'n.a.'
## Warning: Expecting numeric in D41931 / R41931C4: got 'n.a.'
## Warning: Expecting numeric in D41932 / R41932C4: got 'n.a.'
## Warning: Expecting numeric in D41933 / R41933C4: got 'n.a.'
## Warning: Expecting numeric in D41934 / R41934C4: got 'n.a.'
## Warning: Expecting numeric in D41935 / R41935C4: got 'n.a.'
## Warning: Expecting numeric in D41936 / R41936C4: got 'n.a.'
## Warning: Expecting numeric in D41937 / R41937C4: got 'n.a.'
## Warning: Expecting numeric in D41938 / R41938C4: got 'n.a.'
## Warning: Expecting numeric in D41939 / R41939C4: got 'n.a.'
## Warning: Expecting numeric in D41940 / R41940C4: got 'n.a.'
## Warning: Expecting numeric in D41941 / R41941C4: got 'n.a.'
## Warning: Expecting numeric in D41942 / R41942C4: got 'n.a.'
## Warning: Expecting numeric in D41943 / R41943C4: got 'n.a.'
## Warning: Expecting numeric in D41944 / R41944C4: got 'n.a.'
## Warning: Expecting numeric in D41945 / R41945C4: got 'n.a.'
## Warning: Expecting numeric in D41946 / R41946C4: got 'n.a.'
## Warning: Expecting numeric in D41947 / R41947C4: got 'n.a.'
## Warning: Expecting numeric in D41948 / R41948C4: got 'n.a.'
## Warning: Expecting numeric in D41949 / R41949C4: got 'n.a.'
## Warning: Expecting numeric in D41950 / R41950C4: got 'n.a.'
## Warning: Expecting numeric in D41951 / R41951C4: got 'n.a.'
## Warning: Expecting numeric in D41952 / R41952C4: got 'n.a.'
## Warning: Expecting numeric in D41953 / R41953C4: got 'n.a.'
## Warning: Expecting numeric in D41954 / R41954C4: got 'n.a.'
## Warning: Expecting numeric in D41955 / R41955C4: got 'n.a.'
## Warning: Expecting numeric in D41956 / R41956C4: got 'n.a.'
## Warning: Expecting numeric in D41957 / R41957C4: got 'n.a.'
## Warning: Expecting numeric in D41958 / R41958C4: got 'n.a.'
## Warning: Expecting numeric in D41959 / R41959C4: got 'n.a.'
## Warning: Expecting numeric in D41960 / R41960C4: got 'n.a.'
## Warning: Expecting numeric in D41961 / R41961C4: got 'n.a.'
## Warning: Expecting numeric in D41962 / R41962C4: got 'n.a.'
## Warning: Expecting numeric in D41963 / R41963C4: got 'n.a.'
## Warning: Expecting numeric in D41964 / R41964C4: got 'n.a.'
## Warning: Expecting numeric in D41965 / R41965C4: got 'n.a.'
## Warning: Expecting numeric in D41966 / R41966C4: got 'n.a.'
## Warning: Expecting numeric in D41967 / R41967C4: got 'n.a.'
## Warning: Expecting numeric in D41968 / R41968C4: got 'n.a.'
## Warning: Expecting numeric in D41969 / R41969C4: got 'n.a.'
## Warning: Expecting numeric in D41970 / R41970C4: got 'n.a.'
## Warning: Expecting numeric in D41971 / R41971C4: got 'n.a.'
## Warning: Expecting numeric in D41972 / R41972C4: got 'n.a.'
## Warning: Expecting numeric in D41973 / R41973C4: got 'n.a.'
## Warning: Expecting numeric in D41974 / R41974C4: got 'n.a.'
## Warning: Expecting numeric in D41975 / R41975C4: got 'n.a.'
## Warning: Expecting numeric in D41976 / R41976C4: got 'n.a.'
## Warning: Expecting numeric in D41977 / R41977C4: got 'n.a.'
## Warning: Expecting numeric in D41978 / R41978C4: got 'n.a.'
## Warning: Expecting numeric in D41979 / R41979C4: got 'n.a.'
## Warning: Expecting numeric in D41980 / R41980C4: got 'n.a.'
## Warning: Expecting numeric in D41981 / R41981C4: got 'n.a.'
## Warning: Expecting numeric in D41982 / R41982C4: got 'n.a.'
## Warning: Expecting numeric in D41983 / R41983C4: got 'n.a.'
## Warning: Expecting numeric in D41984 / R41984C4: got 'n.a.'
## Warning: Expecting numeric in D41985 / R41985C4: got 'n.a.'
## Warning: Expecting numeric in D41986 / R41986C4: got 'n.a.'
## Warning: Expecting numeric in D41987 / R41987C4: got 'n.a.'
## Warning: Expecting numeric in D41988 / R41988C4: got 'n.a.'
## Warning: Expecting numeric in D41989 / R41989C4: got 'n.a.'
## Warning: Expecting numeric in D41990 / R41990C4: got 'n.a.'
## Warning: Expecting numeric in D41991 / R41991C4: got 'n.a.'
## Warning: Expecting numeric in D41992 / R41992C4: got 'n.a.'
## Warning: Expecting numeric in D41993 / R41993C4: got 'n.a.'
## Warning: Expecting numeric in D41994 / R41994C4: got 'n.a.'
## Warning: Expecting numeric in D41995 / R41995C4: got 'n.a.'
## Warning: Expecting numeric in D41996 / R41996C4: got 'n.a.'
## Warning: Expecting numeric in D41997 / R41997C4: got 'n.a.'
## Warning: Expecting numeric in D41998 / R41998C4: got 'n.a.'
## Warning: Expecting numeric in D41999 / R41999C4: got 'n.a.'
## Warning: Expecting numeric in D42000 / R42000C4: got 'n.a.'
## Warning: Expecting numeric in D42001 / R42001C4: got 'n.a.'
## Warning: Expecting numeric in D42002 / R42002C4: got 'n.a.'
## Warning: Expecting numeric in D42003 / R42003C4: got 'n.a.'
## Warning: Expecting numeric in D42004 / R42004C4: got 'n.a.'
## Warning: Expecting numeric in D42005 / R42005C4: got 'n.a.'
## Warning: Expecting numeric in D42006 / R42006C4: got 'n.a.'
## Warning: Expecting numeric in D42007 / R42007C4: got 'n.a.'
## Warning: Expecting numeric in D42008 / R42008C4: got 'n.a.'
## Warning: Expecting numeric in D42009 / R42009C4: got 'n.a.'
## Warning: Expecting numeric in D42010 / R42010C4: got 'n.a.'
## Warning: Expecting numeric in D42011 / R42011C4: got 'n.a.'
## Warning: Expecting numeric in D42012 / R42012C4: got 'n.a.'
## Warning: Expecting numeric in D42013 / R42013C4: got 'n.a.'
## Warning: Expecting numeric in D42014 / R42014C4: got 'n.a.'
## Warning: Expecting numeric in D42015 / R42015C4: got 'n.a.'
## Warning: Expecting numeric in D42016 / R42016C4: got 'n.a.'
## Warning: Expecting numeric in D42017 / R42017C4: got 'n.a.'
## Warning: Expecting numeric in D42018 / R42018C4: got 'n.a.'
## Warning: Expecting numeric in D42019 / R42019C4: got 'n.a.'
## Warning: Expecting numeric in D42020 / R42020C4: got 'n.a.'
## Warning: Expecting numeric in D42021 / R42021C4: got 'n.a.'
## Warning: Expecting numeric in D42022 / R42022C4: got 'n.a.'
## Warning: Expecting numeric in D42023 / R42023C4: got 'n.a.'
## Warning: Expecting numeric in D42024 / R42024C4: got 'n.a.'
## Warning: Expecting numeric in D42025 / R42025C4: got 'n.a.'
## Warning: Expecting numeric in D42026 / R42026C4: got 'n.a.'
## Warning: Expecting numeric in D42027 / R42027C4: got 'n.a.'
## Warning: Expecting numeric in D42028 / R42028C4: got 'n.a.'
## Warning: Expecting numeric in D42029 / R42029C4: got 'n.a.'
## Warning: Expecting numeric in D42030 / R42030C4: got 'n.a.'
## Warning: Expecting numeric in D42031 / R42031C4: got 'n.a.'
## Warning: Expecting numeric in D42032 / R42032C4: got 'n.a.'
## Warning: Expecting numeric in D42033 / R42033C4: got 'n.a.'
## Warning: Expecting numeric in D42034 / R42034C4: got 'n.a.'
## Warning: Expecting numeric in D42035 / R42035C4: got 'n.a.'
## Warning: Expecting numeric in D42036 / R42036C4: got 'n.a.'
## Warning: Expecting numeric in D42037 / R42037C4: got 'n.a.'
## Warning: Expecting numeric in D42038 / R42038C4: got 'n.a.'
## Warning: Expecting numeric in D42039 / R42039C4: got 'n.a.'
## Warning: Expecting numeric in D42040 / R42040C4: got 'n.a.'
## Warning: Expecting numeric in D42041 / R42041C4: got 'n.a.'
## Warning: Expecting numeric in D42042 / R42042C4: got 'n.a.'
## Warning: Expecting numeric in D42043 / R42043C4: got 'n.a.'
## Warning: Expecting numeric in D42044 / R42044C4: got 'n.a.'
## Warning: Expecting numeric in D42045 / R42045C4: got 'n.a.'
## Warning: Expecting numeric in D42046 / R42046C4: got 'n.a.'
## Warning: Expecting numeric in D42047 / R42047C4: got 'n.a.'
## Warning: Expecting numeric in D42048 / R42048C4: got 'n.a.'
## Warning: Expecting numeric in D42049 / R42049C4: got 'n.a.'
## Warning: Expecting numeric in D42050 / R42050C4: got 'n.a.'
## Warning: Expecting numeric in D42051 / R42051C4: got 'n.a.'
## Warning: Expecting numeric in D42052 / R42052C4: got 'n.a.'
## Warning: Expecting numeric in D42053 / R42053C4: got 'n.a.'
## Warning: Expecting numeric in D42054 / R42054C4: got 'n.a.'
## Warning: Expecting numeric in D42055 / R42055C4: got 'n.a.'
## Warning: Expecting numeric in D42056 / R42056C4: got 'n.a.'
## Warning: Expecting numeric in D42057 / R42057C4: got 'n.a.'
## Warning: Expecting numeric in D42058 / R42058C4: got 'n.a.'
## Warning: Expecting numeric in D42059 / R42059C4: got 'n.a.'
## Warning: Expecting numeric in D42060 / R42060C4: got 'n.a.'
## Warning: Expecting numeric in D42061 / R42061C4: got 'n.a.'
## Warning: Expecting numeric in D42062 / R42062C4: got 'n.a.'
## Warning: Expecting numeric in D42063 / R42063C4: got 'n.a.'
## Warning: Expecting numeric in D42064 / R42064C4: got 'n.a.'
## Warning: Expecting numeric in D42065 / R42065C4: got 'n.a.'
## Warning: Expecting numeric in D42066 / R42066C4: got 'n.a.'
## Warning: Expecting numeric in D42067 / R42067C4: got 'n.a.'
## Warning: Expecting numeric in D42068 / R42068C4: got 'n.a.'
## Warning: Expecting numeric in D42069 / R42069C4: got 'n.a.'
## Warning: Expecting numeric in D42070 / R42070C4: got 'n.a.'
## Warning: Expecting numeric in D42071 / R42071C4: got 'n.a.'
## Warning: Expecting numeric in D42072 / R42072C4: got 'n.a.'
## Warning: Expecting numeric in D42073 / R42073C4: got 'n.a.'
## Warning: Expecting numeric in D42074 / R42074C4: got 'n.a.'
## Warning: Expecting numeric in D42075 / R42075C4: got 'n.a.'
## Warning: Expecting numeric in D42076 / R42076C4: got 'n.a.'
## Warning: Expecting numeric in D42077 / R42077C4: got 'n.a.'
## Warning: Expecting numeric in D42078 / R42078C4: got 'n.a.'
## Warning: Expecting numeric in D42079 / R42079C4: got 'n.a.'
## Warning: Expecting numeric in D42080 / R42080C4: got 'n.a.'
## Warning: Expecting numeric in D42081 / R42081C4: got 'n.a.'
## Warning: Expecting numeric in D42082 / R42082C4: got 'n.a.'
## Warning: Expecting numeric in D42083 / R42083C4: got 'n.a.'
## Warning: Expecting numeric in D42084 / R42084C4: got 'n.a.'
## Warning: Expecting numeric in D42085 / R42085C4: got 'n.a.'
## Warning: Expecting numeric in D42086 / R42086C4: got 'n.a.'
## Warning: Expecting numeric in D42087 / R42087C4: got 'n.a.'
## Warning: Expecting numeric in D42088 / R42088C4: got 'n.a.'
## Warning: Expecting numeric in D42089 / R42089C4: got 'n.a.'
## Warning: Expecting numeric in D42090 / R42090C4: got 'n.a.'
## Warning: Expecting numeric in D42091 / R42091C4: got 'n.a.'
## Warning: Expecting numeric in D42092 / R42092C4: got 'n.a.'
## Warning: Expecting numeric in D42093 / R42093C4: got 'n.a.'
## Warning: Expecting numeric in D42094 / R42094C4: got 'n.a.'
## Warning: Expecting numeric in D42095 / R42095C4: got 'n.a.'
## Warning: Expecting numeric in D42096 / R42096C4: got 'n.a.'
## Warning: Expecting numeric in D42097 / R42097C4: got 'n.a.'
## Warning: Expecting numeric in D42098 / R42098C4: got 'n.a.'
## Warning: Expecting numeric in D42099 / R42099C4: got 'n.a.'
## Warning: Expecting numeric in D42100 / R42100C4: got 'n.a.'
## Warning: Expecting numeric in D42101 / R42101C4: got 'n.a.'
## Warning: Expecting numeric in D42102 / R42102C4: got 'n.a.'
## Warning: Expecting numeric in D42103 / R42103C4: got 'n.a.'
## Warning: Expecting numeric in D42104 / R42104C4: got 'n.a.'
## Warning: Expecting numeric in D42105 / R42105C4: got 'n.a.'
## Warning: Expecting numeric in D42106 / R42106C4: got 'n.a.'
## Warning: Expecting numeric in D42107 / R42107C4: got 'n.a.'
## Warning: Expecting numeric in D42108 / R42108C4: got 'n.a.'
## Warning: Expecting numeric in D42109 / R42109C4: got 'n.a.'
## Warning: Expecting numeric in D42110 / R42110C4: got 'n.a.'
## Warning: Expecting numeric in D42111 / R42111C4: got 'n.a.'
## Warning: Expecting numeric in D42112 / R42112C4: got 'n.a.'
## Warning: Expecting numeric in D42113 / R42113C4: got 'n.a.'
## Warning: Expecting numeric in D42114 / R42114C4: got 'n.a.'
## Warning: Expecting numeric in D42115 / R42115C4: got 'n.a.'
## Warning: Expecting numeric in D42116 / R42116C4: got 'n.a.'
## Warning: Expecting numeric in D42117 / R42117C4: got 'n.a.'
## Warning: Expecting numeric in D42118 / R42118C4: got 'n.a.'
## Warning: Expecting numeric in D42119 / R42119C4: got 'n.a.'
## Warning: Expecting numeric in D42120 / R42120C4: got 'n.a.'
## Warning: Expecting numeric in D42121 / R42121C4: got 'n.a.'
## Warning: Expecting numeric in D42122 / R42122C4: got 'n.a.'
## Warning: Expecting numeric in D42123 / R42123C4: got 'n.a.'
## Warning: Expecting numeric in D42124 / R42124C4: got 'n.a.'
## Warning: Expecting numeric in D42125 / R42125C4: got 'n.a.'
## Warning: Expecting numeric in D42126 / R42126C4: got 'n.a.'
## Warning: Expecting numeric in D42127 / R42127C4: got 'n.a.'
## Warning: Expecting numeric in D42128 / R42128C4: got 'n.a.'
## Warning: Expecting numeric in D42129 / R42129C4: got 'n.a.'
## Warning: Expecting numeric in D42130 / R42130C4: got 'n.a.'
## Warning: Expecting numeric in D42131 / R42131C4: got 'n.a.'
## Warning: Expecting numeric in D42132 / R42132C4: got 'n.a.'
## Warning: Expecting numeric in D42133 / R42133C4: got 'n.a.'
## Warning: Expecting numeric in D42134 / R42134C4: got 'n.a.'
## Warning: Expecting numeric in D42135 / R42135C4: got 'n.a.'
## Warning: Expecting numeric in D42136 / R42136C4: got 'n.a.'
## Warning: Expecting numeric in D42137 / R42137C4: got 'n.a.'
## Warning: Expecting numeric in D42138 / R42138C4: got 'n.a.'
## Warning: Expecting numeric in D42139 / R42139C4: got 'n.a.'
## Warning: Expecting numeric in D42140 / R42140C4: got 'n.a.'
## Warning: Expecting numeric in D42141 / R42141C4: got 'n.a.'
## Warning: Expecting numeric in D42142 / R42142C4: got 'n.a.'
## Warning: Expecting numeric in D42143 / R42143C4: got 'n.a.'
## Warning: Expecting numeric in D42144 / R42144C4: got 'n.a.'
## Warning: Expecting numeric in D42145 / R42145C4: got 'n.a.'
## Warning: Expecting numeric in D42146 / R42146C4: got 'n.a.'
## Warning: Expecting numeric in D42147 / R42147C4: got 'n.a.'
## Warning: Expecting numeric in D42148 / R42148C4: got 'n.a.'
## Warning: Expecting numeric in D42149 / R42149C4: got 'n.a.'
## Warning: Expecting numeric in D42150 / R42150C4: got 'n.a.'
## Warning: Expecting numeric in D42151 / R42151C4: got 'n.a.'
## Warning: Expecting numeric in D42152 / R42152C4: got 'n.a.'
## Warning: Expecting numeric in D42153 / R42153C4: got 'n.a.'
## Warning: Expecting numeric in D42154 / R42154C4: got 'n.a.'
## Warning: Expecting numeric in D42155 / R42155C4: got 'n.a.'
## Warning: Expecting numeric in D42156 / R42156C4: got 'n.a.'
## Warning: Expecting numeric in D42157 / R42157C4: got 'n.a.'
## Warning: Expecting numeric in D42158 / R42158C4: got 'n.a.'
## Warning: Expecting numeric in D42159 / R42159C4: got 'n.a.'
## Warning: Expecting numeric in D42160 / R42160C4: got 'n.a.'
## Warning: Expecting numeric in D42161 / R42161C4: got 'n.a.'
## Warning: Expecting numeric in D42162 / R42162C4: got 'n.a.'
## Warning: Expecting numeric in D42163 / R42163C4: got 'n.a.'
## Warning: Expecting numeric in D42164 / R42164C4: got 'n.a.'
## Warning: Expecting numeric in D42165 / R42165C4: got 'n.a.'
## Warning: Expecting numeric in D42166 / R42166C4: got 'n.a.'
## Warning: Expecting numeric in D42167 / R42167C4: got 'n.a.'
## Warning: Expecting numeric in D42168 / R42168C4: got 'n.a.'
## Warning: Expecting numeric in D42169 / R42169C4: got 'n.a.'
## Warning: Expecting numeric in D42170 / R42170C4: got 'n.a.'
## Warning: Expecting numeric in D42171 / R42171C4: got 'n.a.'
## Warning: Expecting numeric in D42172 / R42172C4: got 'n.a.'
## Warning: Expecting numeric in D42173 / R42173C4: got 'n.a.'
## Warning: Expecting numeric in D42174 / R42174C4: got 'n.a.'
## Warning: Expecting numeric in D42175 / R42175C4: got 'n.a.'
## Warning: Expecting numeric in D42176 / R42176C4: got 'n.a.'
## Warning: Expecting numeric in D42177 / R42177C4: got 'n.a.'
## Warning: Expecting numeric in D42178 / R42178C4: got 'n.a.'
## Warning: Expecting numeric in D42179 / R42179C4: got 'n.a.'
## Warning: Expecting numeric in D42180 / R42180C4: got 'n.a.'
## Warning: Expecting numeric in D42181 / R42181C4: got 'n.a.'
## Warning: Expecting numeric in D42182 / R42182C4: got 'n.a.'
## Warning: Expecting numeric in D42183 / R42183C4: got 'n.a.'
## Warning: Expecting numeric in D42184 / R42184C4: got 'n.a.'
## Warning: Expecting numeric in D42185 / R42185C4: got 'n.a.'
## Warning: Expecting numeric in D42186 / R42186C4: got 'n.a.'
## Warning: Expecting numeric in D42187 / R42187C4: got 'n.a.'
## Warning: Expecting numeric in D42188 / R42188C4: got 'n.a.'
## Warning: Expecting numeric in D42189 / R42189C4: got 'n.a.'
## Warning: Expecting numeric in D42190 / R42190C4: got 'n.a.'
## Warning: Expecting numeric in D42191 / R42191C4: got 'n.a.'
## Warning: Expecting numeric in D42192 / R42192C4: got 'n.a.'
## Warning: Expecting numeric in D42193 / R42193C4: got 'n.a.'
## Warning: Expecting numeric in D42194 / R42194C4: got 'n.a.'
## Warning: Expecting numeric in D42195 / R42195C4: got 'n.a.'
## Warning: Expecting numeric in D42196 / R42196C4: got 'n.a.'
## Warning: Expecting numeric in D42197 / R42197C4: got 'n.a.'
## Warning: Expecting numeric in D42198 / R42198C4: got 'n.a.'
## Warning: Expecting numeric in D42199 / R42199C4: got 'n.a.'
## Warning: Expecting numeric in D42200 / R42200C4: got 'n.a.'
## Warning: Expecting numeric in D42201 / R42201C4: got 'n.a.'
## Warning: Expecting numeric in D42202 / R42202C4: got 'n.a.'
## Warning: Expecting numeric in D42203 / R42203C4: got 'n.a.'
## Warning: Expecting numeric in D42204 / R42204C4: got 'n.a.'
## Warning: Expecting numeric in D42205 / R42205C4: got 'n.a.'
## Warning: Expecting numeric in D42206 / R42206C4: got 'n.a.'
## Warning: Expecting numeric in D42207 / R42207C4: got 'n.a.'
## Warning: Expecting numeric in D42208 / R42208C4: got 'n.a.'
## Warning: Expecting numeric in D42209 / R42209C4: got 'n.a.'
## Warning: Expecting numeric in D42210 / R42210C4: got 'n.a.'
## Warning: Expecting numeric in D42211 / R42211C4: got 'n.a.'
## Warning: Expecting numeric in D42212 / R42212C4: got 'n.a.'
## Warning: Expecting numeric in D42213 / R42213C4: got 'n.a.'
## Warning: Expecting numeric in D42214 / R42214C4: got 'n.a.'
## Warning: Expecting numeric in D42215 / R42215C4: got 'n.a.'
## Warning: Expecting numeric in D42216 / R42216C4: got 'n.a.'
## Warning: Expecting numeric in D42217 / R42217C4: got 'n.a.'
## Warning: Expecting numeric in D42218 / R42218C4: got 'n.a.'
## Warning: Expecting numeric in D42219 / R42219C4: got 'n.a.'
## Warning: Expecting numeric in D42220 / R42220C4: got 'n.a.'
## Warning: Expecting numeric in D42221 / R42221C4: got 'n.a.'
## Warning: Expecting numeric in D42222 / R42222C4: got 'n.a.'
## Warning: Expecting numeric in D42223 / R42223C4: got 'n.a.'
## Warning: Expecting numeric in D42224 / R42224C4: got 'n.a.'
## Warning: Expecting numeric in D42225 / R42225C4: got 'n.a.'
## Warning: Expecting numeric in D42226 / R42226C4: got 'n.a.'
## Warning: Expecting numeric in D42227 / R42227C4: got 'n.a.'
## Warning: Expecting numeric in D42228 / R42228C4: got 'n.a.'
## Warning: Expecting numeric in D42229 / R42229C4: got 'n.a.'
## Warning: Expecting numeric in D42230 / R42230C4: got 'n.a.'
## Warning: Expecting numeric in D42231 / R42231C4: got 'n.a.'
## Warning: Expecting numeric in D42232 / R42232C4: got 'n.a.'
## Warning: Expecting numeric in D42233 / R42233C4: got 'n.a.'
## Warning: Expecting numeric in D42234 / R42234C4: got 'n.a.'
## Warning: Expecting numeric in D42235 / R42235C4: got 'n.a.'
## Warning: Expecting numeric in D42236 / R42236C4: got 'n.a.'
## Warning: Expecting numeric in D42237 / R42237C4: got 'n.a.'
## Warning: Expecting numeric in D42238 / R42238C4: got 'n.a.'
## Warning: Expecting numeric in D42239 / R42239C4: got 'n.a.'
## Warning: Expecting numeric in D42240 / R42240C4: got 'n.a.'
## Warning: Expecting numeric in D42241 / R42241C4: got 'n.a.'
## Warning: Expecting numeric in D42242 / R42242C4: got 'n.a.'
## Warning: Expecting numeric in D42243 / R42243C4: got 'n.a.'
## Warning: Expecting numeric in D42244 / R42244C4: got 'n.a.'
## Warning: Expecting numeric in D42245 / R42245C4: got 'n.a.'
## Warning: Expecting numeric in D42246 / R42246C4: got 'n.a.'
## Warning: Expecting numeric in D42247 / R42247C4: got 'n.a.'
## Warning: Expecting numeric in D42248 / R42248C4: got 'n.a.'
## Warning: Expecting numeric in D42249 / R42249C4: got 'n.a.'
## Warning: Expecting numeric in D42250 / R42250C4: got 'n.a.'
## Warning: Expecting numeric in D42251 / R42251C4: got 'n.a.'
## Warning: Expecting numeric in D42252 / R42252C4: got 'n.a.'
## Warning: Expecting numeric in D42253 / R42253C4: got 'n.a.'
## Warning: Expecting numeric in D42254 / R42254C4: got 'n.a.'
## Warning: Expecting numeric in D42255 / R42255C4: got 'n.a.'
## Warning: Expecting numeric in D42256 / R42256C4: got 'n.a.'
## Warning: Expecting numeric in D42257 / R42257C4: got 'n.a.'
## Warning: Expecting numeric in D42258 / R42258C4: got 'n.a.'
## Warning: Expecting numeric in D42259 / R42259C4: got 'n.a.'
## Warning: Expecting numeric in D42260 / R42260C4: got 'n.a.'
## Warning: Expecting numeric in D42261 / R42261C4: got 'n.a.'
## Warning: Expecting numeric in D42262 / R42262C4: got 'n.a.'
## Warning: Expecting numeric in D42263 / R42263C4: got 'n.a.'
## Warning: Expecting numeric in D42264 / R42264C4: got 'n.a.'
## Warning: Expecting numeric in D42265 / R42265C4: got 'n.a.'
## Warning: Expecting numeric in D42266 / R42266C4: got 'n.a.'
## Warning: Expecting numeric in D42267 / R42267C4: got 'n.a.'
## Warning: Expecting numeric in D42268 / R42268C4: got 'n.a.'
## Warning: Expecting numeric in D42269 / R42269C4: got 'n.a.'
## Warning: Expecting numeric in D42270 / R42270C4: got 'n.a.'
## Warning: Expecting numeric in D42271 / R42271C4: got 'n.a.'
## Warning: Expecting numeric in D42272 / R42272C4: got 'n.a.'
## Warning: Expecting numeric in D42273 / R42273C4: got 'n.a.'
## Warning: Expecting numeric in D42274 / R42274C4: got 'n.a.'
## Warning: Expecting numeric in D42275 / R42275C4: got 'n.a.'
## Warning: Expecting numeric in D42276 / R42276C4: got 'n.a.'
## Warning: Expecting numeric in D42277 / R42277C4: got 'n.a.'
## Warning: Expecting numeric in D42278 / R42278C4: got 'n.a.'
## Warning: Expecting numeric in D42279 / R42279C4: got 'n.a.'
## Warning: Expecting numeric in D42280 / R42280C4: got 'n.a.'
## Warning: Expecting numeric in D42281 / R42281C4: got 'n.a.'
## Warning: Expecting numeric in D42282 / R42282C4: got 'n.a.'
## Warning: Expecting numeric in D42283 / R42283C4: got 'n.a.'
## Warning: Expecting numeric in D42284 / R42284C4: got 'n.a.'
## Warning: Expecting numeric in D42285 / R42285C4: got 'n.a.'
## Warning: Expecting numeric in D42286 / R42286C4: got 'n.a.'
## Warning: Expecting numeric in D42287 / R42287C4: got 'n.a.'
## Warning: Expecting numeric in D42288 / R42288C4: got 'n.a.'
## Warning: Expecting numeric in D42289 / R42289C4: got 'n.a.'
## Warning: Expecting numeric in D42290 / R42290C4: got 'n.a.'
## Warning: Expecting numeric in D42291 / R42291C4: got 'n.a.'
## Warning: Expecting numeric in D42292 / R42292C4: got 'n.a.'
## Warning: Expecting numeric in D42293 / R42293C4: got 'n.a.'
## Warning: Expecting numeric in D42294 / R42294C4: got 'n.a.'
## Warning: Expecting numeric in D42295 / R42295C4: got 'n.a.'
## Warning: Expecting numeric in D42296 / R42296C4: got 'n.a.'
## Warning: Expecting numeric in D42297 / R42297C4: got 'n.a.'
## Warning: Expecting numeric in D42298 / R42298C4: got 'n.a.'
## Warning: Expecting numeric in D42299 / R42299C4: got 'n.a.'
## Warning: Expecting numeric in D42300 / R42300C4: got 'n.a.'
## Warning: Expecting numeric in D42301 / R42301C4: got 'n.a.'
## Warning: Expecting numeric in D42302 / R42302C4: got 'n.a.'
## Warning: Expecting numeric in D42303 / R42303C4: got 'n.a.'
## Warning: Expecting numeric in D42304 / R42304C4: got 'n.a.'
## Warning: Expecting numeric in D42305 / R42305C4: got 'n.a.'
## Warning: Expecting numeric in D42306 / R42306C4: got 'n.a.'
## Warning: Expecting numeric in D42307 / R42307C4: got 'n.a.'
## Warning: Expecting numeric in D42308 / R42308C4: got 'n.a.'
## Warning: Expecting numeric in D42309 / R42309C4: got 'n.a.'
## Warning: Expecting numeric in D42310 / R42310C4: got 'n.a.'
## Warning: Expecting numeric in D42311 / R42311C4: got 'n.a.'
## Warning: Expecting numeric in D42312 / R42312C4: got 'n.a.'
## Warning: Expecting numeric in D42313 / R42313C4: got 'n.a.'
## Warning: Expecting numeric in D42314 / R42314C4: got 'n.a.'
## Warning: Expecting numeric in D42315 / R42315C4: got 'n.a.'
## Warning: Expecting numeric in D42316 / R42316C4: got 'n.a.'
## Warning: Expecting numeric in D42317 / R42317C4: got 'n.a.'
## Warning: Expecting numeric in D42318 / R42318C4: got 'n.a.'
## Warning: Expecting numeric in D42319 / R42319C4: got 'n.a.'
## Warning: Expecting numeric in D42320 / R42320C4: got 'n.a.'
## Warning: Expecting numeric in D42321 / R42321C4: got 'n.a.'
## Warning: Expecting numeric in D42322 / R42322C4: got 'n.a.'
## Warning: Expecting numeric in D42323 / R42323C4: got 'n.a.'
## Warning: Expecting numeric in D42324 / R42324C4: got 'n.a.'
## Warning: Expecting numeric in D42325 / R42325C4: got 'n.a.'
## Warning: Expecting numeric in D42326 / R42326C4: got 'n.a.'
## Warning: Expecting numeric in D42327 / R42327C4: got 'n.a.'
## Warning: Expecting numeric in D42328 / R42328C4: got 'n.a.'
## Warning: Expecting numeric in D42329 / R42329C4: got 'n.a.'
## Warning: Expecting numeric in D42330 / R42330C4: got 'n.a.'
## Warning: Expecting numeric in D42331 / R42331C4: got 'n.a.'
## Warning: Expecting numeric in D42332 / R42332C4: got 'n.a.'
## Warning: Expecting numeric in D42333 / R42333C4: got 'n.a.'
## Warning: Expecting numeric in D42334 / R42334C4: got 'n.a.'
## Warning: Expecting numeric in D42335 / R42335C4: got 'n.a.'
## Warning: Expecting numeric in D42336 / R42336C4: got 'n.a.'
## Warning: Expecting numeric in D42337 / R42337C4: got 'n.a.'
## Warning: Expecting numeric in D42338 / R42338C4: got 'n.a.'
## Warning: Expecting numeric in D42339 / R42339C4: got 'n.a.'
## Warning: Expecting numeric in D42340 / R42340C4: got 'n.a.'
## Warning: Expecting numeric in D42341 / R42341C4: got 'n.a.'
## Warning: Expecting numeric in D42342 / R42342C4: got 'n.a.'
## Warning: Expecting numeric in D42343 / R42343C4: got 'n.a.'
## Warning: Expecting numeric in D42344 / R42344C4: got 'n.a.'
## Warning: Expecting numeric in D42345 / R42345C4: got 'n.a.'
## Warning: Expecting numeric in D42346 / R42346C4: got 'n.a.'
## Warning: Expecting numeric in D42347 / R42347C4: got 'n.a.'
## Warning: Expecting numeric in D42348 / R42348C4: got 'n.a.'
## Warning: Expecting numeric in D42349 / R42349C4: got 'n.a.'
## Warning: Expecting numeric in D42350 / R42350C4: got 'n.a.'
## Warning: Expecting numeric in D42351 / R42351C4: got 'n.a.'
## Warning: Expecting numeric in D42352 / R42352C4: got 'n.a.'
## Warning: Expecting numeric in D42353 / R42353C4: got 'n.a.'
## Warning: Expecting numeric in D42354 / R42354C4: got 'n.a.'
## Warning: Expecting numeric in D42355 / R42355C4: got 'n.a.'
## Warning: Expecting numeric in D42356 / R42356C4: got 'n.a.'
## Warning: Expecting numeric in D42357 / R42357C4: got 'n.a.'
## Warning: Expecting numeric in D42358 / R42358C4: got 'n.a.'
## Warning: Expecting numeric in D42359 / R42359C4: got 'n.a.'
## Warning: Expecting numeric in D42360 / R42360C4: got 'n.a.'
## Warning: Expecting numeric in D42361 / R42361C4: got 'n.a.'
## Warning: Expecting numeric in D42362 / R42362C4: got 'n.a.'
## Warning: Expecting numeric in D42363 / R42363C4: got 'n.a.'
## Warning: Expecting numeric in D42364 / R42364C4: got 'n.a.'
## Warning: Expecting numeric in D42365 / R42365C4: got 'n.a.'
## Warning: Expecting numeric in D42366 / R42366C4: got 'n.a.'
## Warning: Expecting numeric in D42367 / R42367C4: got 'n.a.'
## Warning: Expecting numeric in D42368 / R42368C4: got 'n.a.'
## Warning: Expecting numeric in D42369 / R42369C4: got 'n.a.'
## Warning: Expecting numeric in D42370 / R42370C4: got 'n.a.'
## Warning: Expecting numeric in D42371 / R42371C4: got 'n.a.'
## Warning: Expecting numeric in D42372 / R42372C4: got 'n.a.'
## Warning: Expecting numeric in D42373 / R42373C4: got 'n.a.'
## Warning: Expecting numeric in D42374 / R42374C4: got 'n.a.'
## Warning: Expecting numeric in D42375 / R42375C4: got 'n.a.'
## Warning: Expecting numeric in D42376 / R42376C4: got 'n.a.'
## Warning: Expecting numeric in D42377 / R42377C4: got 'n.a.'
## Warning: Expecting numeric in D42378 / R42378C4: got 'n.a.'
## Warning: Expecting numeric in D42379 / R42379C4: got 'n.a.'
## Warning: Expecting numeric in D42380 / R42380C4: got 'n.a.'
## Warning: Expecting numeric in D42381 / R42381C4: got 'n.a.'
## Warning: Expecting numeric in D42382 / R42382C4: got 'n.a.'
## Warning: Expecting numeric in D42383 / R42383C4: got 'n.a.'
## Warning: Expecting numeric in D42384 / R42384C4: got 'n.a.'
## Warning: Expecting numeric in D42385 / R42385C4: got 'n.a.'
## Warning: Expecting numeric in D42386 / R42386C4: got 'n.a.'
## Warning: Expecting numeric in D42387 / R42387C4: got 'n.a.'
## Warning: Expecting numeric in D42388 / R42388C4: got 'n.a.'
## Warning: Expecting numeric in D42389 / R42389C4: got 'n.a.'
## Warning: Expecting numeric in D42390 / R42390C4: got 'n.a.'
## Warning: Expecting numeric in D42391 / R42391C4: got 'n.a.'
## Warning: Expecting numeric in D42392 / R42392C4: got 'n.a.'
## Warning: Expecting numeric in D42393 / R42393C4: got 'n.a.'
## Warning: Expecting numeric in D42394 / R42394C4: got 'n.a.'
## Warning: Expecting numeric in D42395 / R42395C4: got 'n.a.'
## Warning: Expecting numeric in D42396 / R42396C4: got 'n.a.'
## Warning: Expecting numeric in D42397 / R42397C4: got 'n.a.'
## Warning: Expecting numeric in D42398 / R42398C4: got 'n.a.'
## Warning: Expecting numeric in D42399 / R42399C4: got 'n.a.'
## Warning: Expecting numeric in D42400 / R42400C4: got 'n.a.'
## Warning: Expecting numeric in D42401 / R42401C4: got 'n.a.'
## Warning: Expecting numeric in D42402 / R42402C4: got 'n.a.'
## Warning: Expecting numeric in D42403 / R42403C4: got 'n.a.'
## Warning: Expecting numeric in D42404 / R42404C4: got 'n.a.'
## Warning: Expecting numeric in D42405 / R42405C4: got 'n.a.'
## Warning: Expecting numeric in D42406 / R42406C4: got 'n.a.'
## Warning: Expecting numeric in D42407 / R42407C4: got 'n.a.'
## Warning: Expecting numeric in D42408 / R42408C4: got 'n.a.'
## Warning: Expecting numeric in D42409 / R42409C4: got 'n.a.'
## Warning: Expecting numeric in D42410 / R42410C4: got 'n.a.'
## Warning: Expecting numeric in D42411 / R42411C4: got 'n.a.'
## Warning: Expecting numeric in D42412 / R42412C4: got 'n.a.'
## Warning: Expecting numeric in D42413 / R42413C4: got 'n.a.'
## Warning: Expecting numeric in D42414 / R42414C4: got 'n.a.'
## Warning: Expecting numeric in D42415 / R42415C4: got 'n.a.'
## Warning: Expecting numeric in D42416 / R42416C4: got 'n.a.'
## Warning: Expecting numeric in D42417 / R42417C4: got 'n.a.'
## Warning: Expecting numeric in D42418 / R42418C4: got 'n.a.'
## Warning: Expecting numeric in D42419 / R42419C4: got 'n.a.'
## Warning: Expecting numeric in D42420 / R42420C4: got 'n.a.'
## Warning: Expecting numeric in D42421 / R42421C4: got 'n.a.'
## Warning: Expecting numeric in D42422 / R42422C4: got 'n.a.'
## Warning: Expecting numeric in D42423 / R42423C4: got 'n.a.'
## Warning: Expecting numeric in D42424 / R42424C4: got 'n.a.'
## Warning: Expecting numeric in D42425 / R42425C4: got 'n.a.'
## Warning: Expecting numeric in D42426 / R42426C4: got 'n.a.'
## Warning: Expecting numeric in D42427 / R42427C4: got 'n.a.'
## Warning: Expecting numeric in D42428 / R42428C4: got 'n.a.'
## Warning: Expecting numeric in D42429 / R42429C4: got 'n.a.'
## Warning: Expecting numeric in D42430 / R42430C4: got 'n.a.'
## Warning: Expecting numeric in D42431 / R42431C4: got 'n.a.'
## Warning: Expecting numeric in D42432 / R42432C4: got 'n.a.'
## Warning: Expecting numeric in D42433 / R42433C4: got 'n.a.'
## Warning: Expecting numeric in D42434 / R42434C4: got 'n.a.'
## Warning: Expecting numeric in D42435 / R42435C4: got 'n.a.'
## Warning: Expecting numeric in D42436 / R42436C4: got 'n.a.'
## Warning: Expecting numeric in D42437 / R42437C4: got 'n.a.'
## Warning: Expecting numeric in D42438 / R42438C4: got 'n.a.'
## Warning: Expecting numeric in D42439 / R42439C4: got 'n.a.'
## Warning: Expecting numeric in D42440 / R42440C4: got 'n.a.'
## Warning: Expecting numeric in D42441 / R42441C4: got 'n.a.'
## Warning: Expecting numeric in D42442 / R42442C4: got 'n.a.'
## Warning: Expecting numeric in D42443 / R42443C4: got 'n.a.'
## Warning: Expecting numeric in D42444 / R42444C4: got 'n.a.'
## Warning: Expecting numeric in D42445 / R42445C4: got 'n.a.'
## Warning: Expecting numeric in D42446 / R42446C4: got 'n.a.'
## Warning: Expecting numeric in D42447 / R42447C4: got 'n.a.'
## Warning: Expecting numeric in D42448 / R42448C4: got 'n.a.'
## Warning: Expecting numeric in D42449 / R42449C4: got 'n.a.'
## Warning: Expecting numeric in D42450 / R42450C4: got 'n.a.'
## Warning: Expecting numeric in D42451 / R42451C4: got 'n.a.'
## Warning: Expecting numeric in D42452 / R42452C4: got 'n.a.'
## Warning: Expecting numeric in D42453 / R42453C4: got 'n.a.'
## Warning: Expecting numeric in D42454 / R42454C4: got 'n.a.'
## Warning: Expecting numeric in D42455 / R42455C4: got 'n.a.'
## Warning: Expecting numeric in D42456 / R42456C4: got 'n.a.'
## Warning: Expecting numeric in D42457 / R42457C4: got 'n.a.'
## Warning: Expecting numeric in D42458 / R42458C4: got 'n.a.'
## Warning: Expecting numeric in D42459 / R42459C4: got 'n.a.'
## Warning: Expecting numeric in D42460 / R42460C4: got 'n.a.'
## Warning: Expecting numeric in D42461 / R42461C4: got 'n.a.'
## Warning: Expecting numeric in D42462 / R42462C4: got 'n.a.'
## Warning: Expecting numeric in D42463 / R42463C4: got 'n.a.'
## Warning: Expecting numeric in D42464 / R42464C4: got 'n.a.'
## Warning: Expecting numeric in D42465 / R42465C4: got 'n.a.'
## Warning: Expecting numeric in D42466 / R42466C4: got 'n.a.'
## Warning: Expecting numeric in D42467 / R42467C4: got 'n.a.'
## Warning: Expecting numeric in D42468 / R42468C4: got 'n.a.'
## Warning: Expecting numeric in D42469 / R42469C4: got 'n.a.'
## Warning: Expecting numeric in D42470 / R42470C4: got 'n.a.'
## Warning: Expecting numeric in D42471 / R42471C4: got 'n.a.'
## Warning: Expecting numeric in D42472 / R42472C4: got 'n.a.'
## Warning: Expecting numeric in D42473 / R42473C4: got 'n.a.'
## Warning: Expecting numeric in D42474 / R42474C4: got 'n.a.'
## Warning: Expecting numeric in D42475 / R42475C4: got 'n.a.'
## Warning: Expecting numeric in D42476 / R42476C4: got 'n.a.'
## Warning: Expecting numeric in D42477 / R42477C4: got 'n.a.'
## Warning: Expecting numeric in D42478 / R42478C4: got 'n.a.'
## Warning: Expecting numeric in D42479 / R42479C4: got 'n.a.'
## Warning: Expecting numeric in D42480 / R42480C4: got 'n.a.'
## Warning: Expecting numeric in D42481 / R42481C4: got 'n.a.'
## Warning: Expecting numeric in D42482 / R42482C4: got 'n.a.'
## Warning: Expecting numeric in D42483 / R42483C4: got 'n.a.'
## Warning: Expecting numeric in D42484 / R42484C4: got 'n.a.'
## Warning: Expecting numeric in D42485 / R42485C4: got 'n.a.'
## Warning: Expecting numeric in D42486 / R42486C4: got 'n.a.'
## Warning: Expecting numeric in D42487 / R42487C4: got 'n.a.'
## Warning: Expecting numeric in D42488 / R42488C4: got 'n.a.'
## Warning: Expecting numeric in D42489 / R42489C4: got 'n.a.'
## Warning: Expecting numeric in D42490 / R42490C4: got 'n.a.'
## Warning: Expecting numeric in D42491 / R42491C4: got 'n.a.'
## Warning: Expecting numeric in D42492 / R42492C4: got 'n.a.'
## Warning: Expecting numeric in D42493 / R42493C4: got 'n.a.'
## Warning: Expecting numeric in D42494 / R42494C4: got 'n.a.'
## Warning: Expecting numeric in D42495 / R42495C4: got 'n.a.'
## Warning: Expecting numeric in D42496 / R42496C4: got 'n.a.'
## Warning: Expecting numeric in D42497 / R42497C4: got 'n.a.'
## Warning: Expecting numeric in D42498 / R42498C4: got 'n.a.'
## Warning: Expecting numeric in D42499 / R42499C4: got 'n.a.'
## Warning: Expecting numeric in D42500 / R42500C4: got 'n.a.'
## Warning: Expecting numeric in D42501 / R42501C4: got 'n.a.'
## Warning: Expecting numeric in D42502 / R42502C4: got 'n.a.'
## Warning: Expecting numeric in D42503 / R42503C4: got 'n.a.'
## Warning: Expecting numeric in D42504 / R42504C4: got 'n.a.'
## Warning: Expecting numeric in D42505 / R42505C4: got 'n.a.'
## Warning: Expecting numeric in D42506 / R42506C4: got 'n.a.'
## Warning: Expecting numeric in D42507 / R42507C4: got 'n.a.'
## Warning: Expecting numeric in D42508 / R42508C4: got 'n.a.'
## Warning: Expecting numeric in D42509 / R42509C4: got 'n.a.'
## Warning: Expecting numeric in D42510 / R42510C4: got 'n.a.'
## Warning: Expecting numeric in D42511 / R42511C4: got 'n.a.'
## Warning: Expecting numeric in D42512 / R42512C4: got 'n.a.'
## Warning: Expecting numeric in D42513 / R42513C4: got 'n.a.'
## Warning: Expecting numeric in D42514 / R42514C4: got 'n.a.'
## Warning: Expecting numeric in D42515 / R42515C4: got 'n.a.'
## Warning: Expecting numeric in D42516 / R42516C4: got 'n.a.'
## Warning: Expecting numeric in D42517 / R42517C4: got 'n.a.'
## Warning: Expecting numeric in D42518 / R42518C4: got 'n.a.'
## Warning: Expecting numeric in D42519 / R42519C4: got 'n.a.'
## Warning: Expecting numeric in D42520 / R42520C4: got 'n.a.'
## Warning: Expecting numeric in D42521 / R42521C4: got 'n.a.'
## Warning: Expecting numeric in D42522 / R42522C4: got 'n.a.'
## Warning: Expecting numeric in D42523 / R42523C4: got 'n.a.'
## Warning: Expecting numeric in D42524 / R42524C4: got 'n.a.'
## Warning: Expecting numeric in D42525 / R42525C4: got 'n.a.'
## Warning: Expecting numeric in D42526 / R42526C4: got 'n.a.'
## Warning: Expecting numeric in D42527 / R42527C4: got 'n.a.'
## Warning: Expecting numeric in D42528 / R42528C4: got 'n.a.'
## Warning: Expecting numeric in D42529 / R42529C4: got 'n.a.'
## Warning: Expecting numeric in D42530 / R42530C4: got 'n.a.'
## Warning: Expecting numeric in D42531 / R42531C4: got 'n.a.'
## Warning: Expecting numeric in D42532 / R42532C4: got 'n.a.'
## Warning: Expecting numeric in D42533 / R42533C4: got 'n.a.'
## Warning: Expecting numeric in D42534 / R42534C4: got 'n.a.'
## Warning: Expecting numeric in D42535 / R42535C4: got 'n.a.'
## Warning: Expecting numeric in D42536 / R42536C4: got 'n.a.'
## Warning: Expecting numeric in D42537 / R42537C4: got 'n.a.'
## Warning: Expecting numeric in D42538 / R42538C4: got 'n.a.'
## Warning: Expecting numeric in D42539 / R42539C4: got 'n.a.'
## Warning: Expecting numeric in D42540 / R42540C4: got 'n.a.'
## Warning: Expecting numeric in D42541 / R42541C4: got 'n.a.'
## Warning: Expecting numeric in D42542 / R42542C4: got 'n.a.'
## Warning: Expecting numeric in D42543 / R42543C4: got 'n.a.'
## Warning: Expecting numeric in D42544 / R42544C4: got 'n.a.'
## Warning: Expecting numeric in D42545 / R42545C4: got 'n.a.'
## Warning: Expecting numeric in D42546 / R42546C4: got 'n.a.'
## Warning: Expecting numeric in D42547 / R42547C4: got 'n.a.'
## Warning: Expecting numeric in D42548 / R42548C4: got 'n.a.'
## Warning: Expecting numeric in D42549 / R42549C4: got 'n.a.'
## Warning: Expecting numeric in D42550 / R42550C4: got 'n.a.'
## Warning: Expecting numeric in D42551 / R42551C4: got 'n.a.'
## Warning: Expecting numeric in D42552 / R42552C4: got 'n.a.'
## Warning: Expecting numeric in D42553 / R42553C4: got 'n.a.'
## Warning: Expecting numeric in D42554 / R42554C4: got 'n.a.'
## Warning: Expecting numeric in D42555 / R42555C4: got 'n.a.'
## Warning: Expecting numeric in D42556 / R42556C4: got 'n.a.'
## Warning: Expecting numeric in D42557 / R42557C4: got 'n.a.'
## Warning: Expecting numeric in D42558 / R42558C4: got 'n.a.'
## Warning: Expecting numeric in D42559 / R42559C4: got 'n.a.'
## Warning: Expecting numeric in D42560 / R42560C4: got 'n.a.'
## Warning: Expecting numeric in D42561 / R42561C4: got 'n.a.'
## Warning: Expecting numeric in D42562 / R42562C4: got 'n.a.'
## Warning: Expecting numeric in D42563 / R42563C4: got 'n.a.'
## Warning: Expecting numeric in D42564 / R42564C4: got 'n.a.'
## Warning: Expecting numeric in D42565 / R42565C4: got 'n.a.'
## Warning: Expecting numeric in D42566 / R42566C4: got 'n.a.'
## Warning: Expecting numeric in D42567 / R42567C4: got 'n.a.'
## Warning: Expecting numeric in D42568 / R42568C4: got 'n.a.'
glimpse(df)
## Rows: 24,963
## Columns: 8
## $ name        <chr> "Mr Ane Maersk Mc-Kinney Uggla", "Mr Lars Erik Brenoe", "M…
## $ affiliation <chr> "A.P. MOLLER HOLDING A/S", "A.P. MOLLER HOLDING A/S", "A.P…
## $ title       <chr> "Chairman (Board of Directors)", "Director (Board of Direc…
## $ id          <chr> "P043421359", "P041964972", "P645698736", "P041410476", "P…
## $ sector      <chr> "6499", "6499", "6499", "6499", "6499", "6499", "6499", "6…
## $ revenue     <dbl> 62187559, 62187559, 62187559, 62187559, 62187559, 62187559…
## $ n_employees <chr> "93076", "93076", "93076", "93076", "93076", "93076", "930…
## $ gender      <chr> "male", "male", "female", "male", "male", "male", "male", …
If you add other columns than specified in the video above, the function clean_orbis() might produce errors. The clean_orbis() function enables you to use all remaining functions, such as creating an incidence matrix and a graph object, just like with the data set den17. There is no need to rename columns.
Please note, that Orbis data is “real data” in the sense that it is not completely clean. Depending on your data set, you have to undertake further cleaning operations. Some of those can be seen in the r-script that can be found below under materials.
3.3 Loading and visualizing a two-mode network
After we have found a suitable subset of our data, we are ready to load a graph object. Since both den17 and Orbis data have two columns (name and affiliation) which are used as input variables for our graph object, we always load data by first creating an incidence matrix.
There are also different ways of loading graph objects, such as through the igraph functions graph_from_data_frame() or graph_from_edgelist(). However, I only recommend to use these functions if you are dealing with an edge list or data frame that shows connections between entities of the same unit (one-mode edge lists). If the raw data contains a two-mode edge list (as in den17 or in Orbis), it is better to load graph objects through an incidence or adjacency matrix.
Since we already covered on how to load a graph object through an incidence or adjacency matrix here, I will just show the code.
incidence <- xtabs(formula = ~ name + affiliation, data = finance, sparse = TRUE)

adj_i <- incidence %*% Matrix::t(incidence)

adj_c <- Matrix::t(incidence) %*% incidence

# 2. Loading two-mode network "gr" and one-mode networks "gr1" and "gr2"

gr <- graph_from_incidence_matrix(incidence, directed = FALSE) %>%
  simplify(remove.multiple = TRUE, remove.loops = TRUE)
## Warning: `graph_from_incidence_matrix()` was deprecated in igraph 1.6.0.
## ℹ Please use `graph_from_biadjacency_matrix()` instead.
## This warning is displayed once every 8 hours.
## Call `lifecycle::last_lifecycle_warnings()` to see where this warning was
## generated.
gr1 <- graph_from_adjacency_matrix(adj_i, mode = "undirected") %>%
  simplify(remove.multiple = TRUE, remove.loops = TRUE)

gr2 <- graph_from_adjacency_matrix(adj_c, mode = "undirected") %>%
  simplify(remove.multiple = TRUE, remove.loops = TRUE)

# look at gr
gr
## IGRAPH 61c7a14 UN-B 920 931 --
## + attr: type (v/l), name (v/c)
## + edges from 61c7a14 (vertex names):
## [1] Aage Almtoft            --Middelfart Sparekasse
## [2] AAke Per-Urban Bäckström--Danske Bank
## [3] AAse Kogsboell          --JURISTERNES OG OEKONOMERNES PENSIONSKASSE
## [4] Alice Lykke             --SEB Pension
## [5] Allan Bisgaard          --Koebstaedernes Forsikring
## [6] Allan Buch              --Middelfart Sparekasse
## [7] Allan Kragh Thaysen     --Nykredit Forsikring (note)
## [8] Allan Michael Luplau    --Sygeforsikring Danmark
## + ... omitted several edges
Visualizing two-mode networks is very similar to visualizing one-mode networks. Two mode networks have an attribute called type which you can see just above. It is a node attribute.
When we visualize two-mode networks, we need to make the type of the node visible, because otherwise, we will not know which node is a corporation and person respectively. We specify this by using the color argument.
gr %>%
  ggraph("fr") +
  geom_edge_link0(color = "gray40") +
  geom_node_point(aes(color = type)) +
  geom_node_point(aes(filter=type==FALSE), alpha = 0.8, size = 1) +
  geom_node_point(aes(filter=type==TRUE), alpha = 0.5, size = 2) +
  # changing the legend content
  scale_color_manual(values = c("steelblue", "salmon2"),
                     labels = c("individuals", "corporations")) +
  labs(title = "Corporate interlocks in the Danish financial sector",
       # changing the legend header
       color = "Node types") +
  theme_graph()
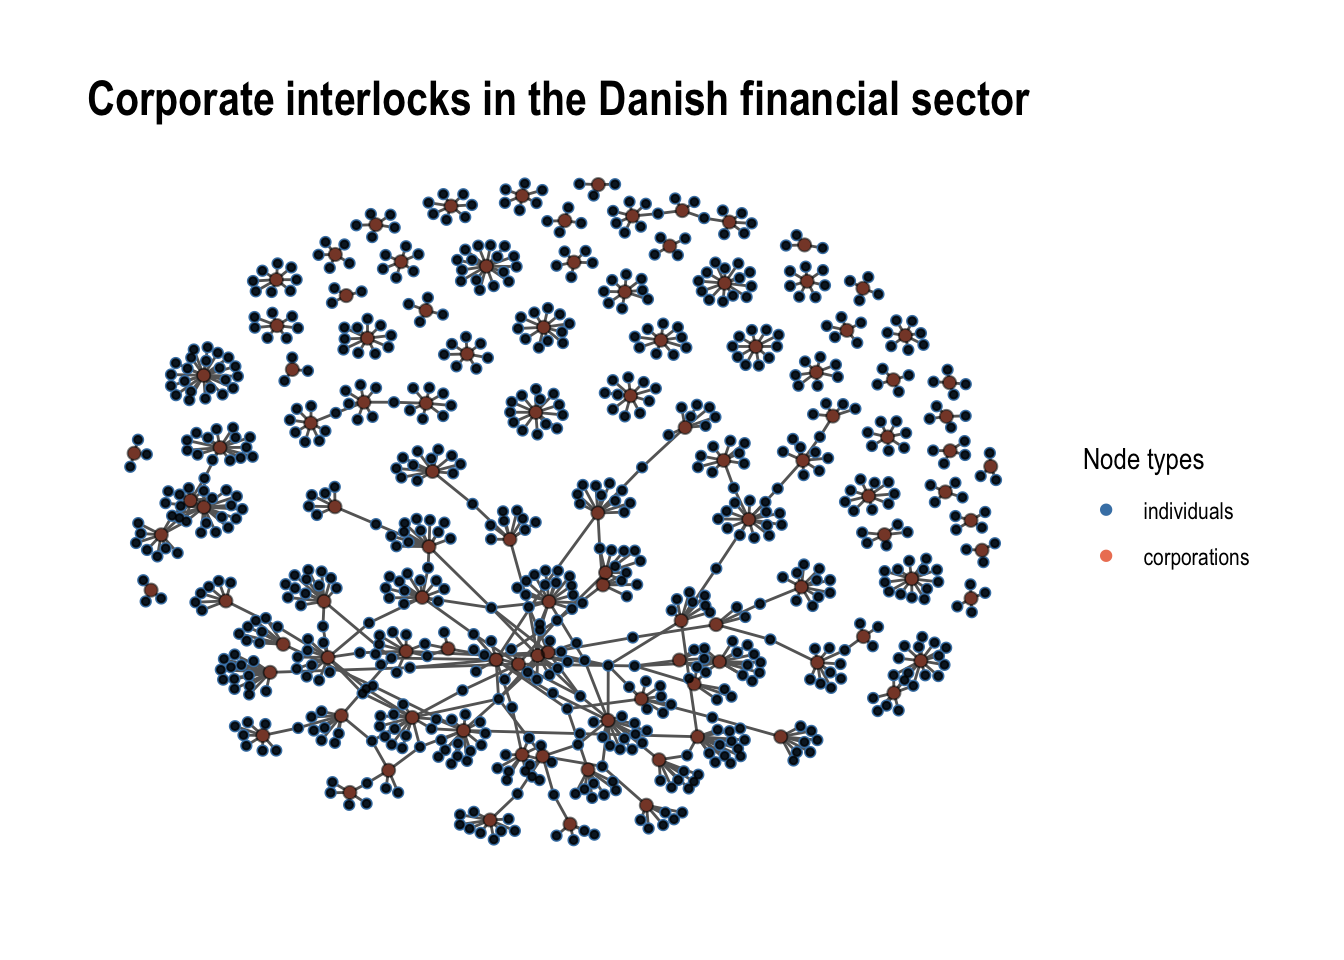
We select the largest component exactly as we do with one-mode networks too. Let us select the largest component and visualize it.
# Select largest component
complist <- components(gr)
comps <- decompose.graph(gr)

# make index
index <-
  table(complist$membership) %>%
  as_tibble(.name_repair = make.names) %>%
  arrange(desc(n)) %>%
  mutate(X = as.numeric(X)) %>%
  pull(1)

# select biggest
comp1 <- comps[[index[1]]]

# visualize

comp1 %>%
  ggraph("fr") +
  geom_edge_link0(color = "gray40") +
  geom_node_point(aes(color = type)) +
  geom_node_point(aes(filter=type==FALSE), alpha = 0.8, size = 1) +
  geom_node_point(aes(filter=type==TRUE), alpha = 0.5, size = 2) +
  geom_node_text(aes(filter=type==TRUE, label = name), size = 1.5,
                 # no overlap
                 repel = TRUE) +
  # changing the legend content
  scale_color_manual(values = c("steelblue", "salmon2"),
                     labels = c("individuals", "corporations")) +
  labs(title = "Biggest component of corporate interlocks in the Danish financial sector",
       # changing the legend header
       color = "Node types") +
  theme_graph()
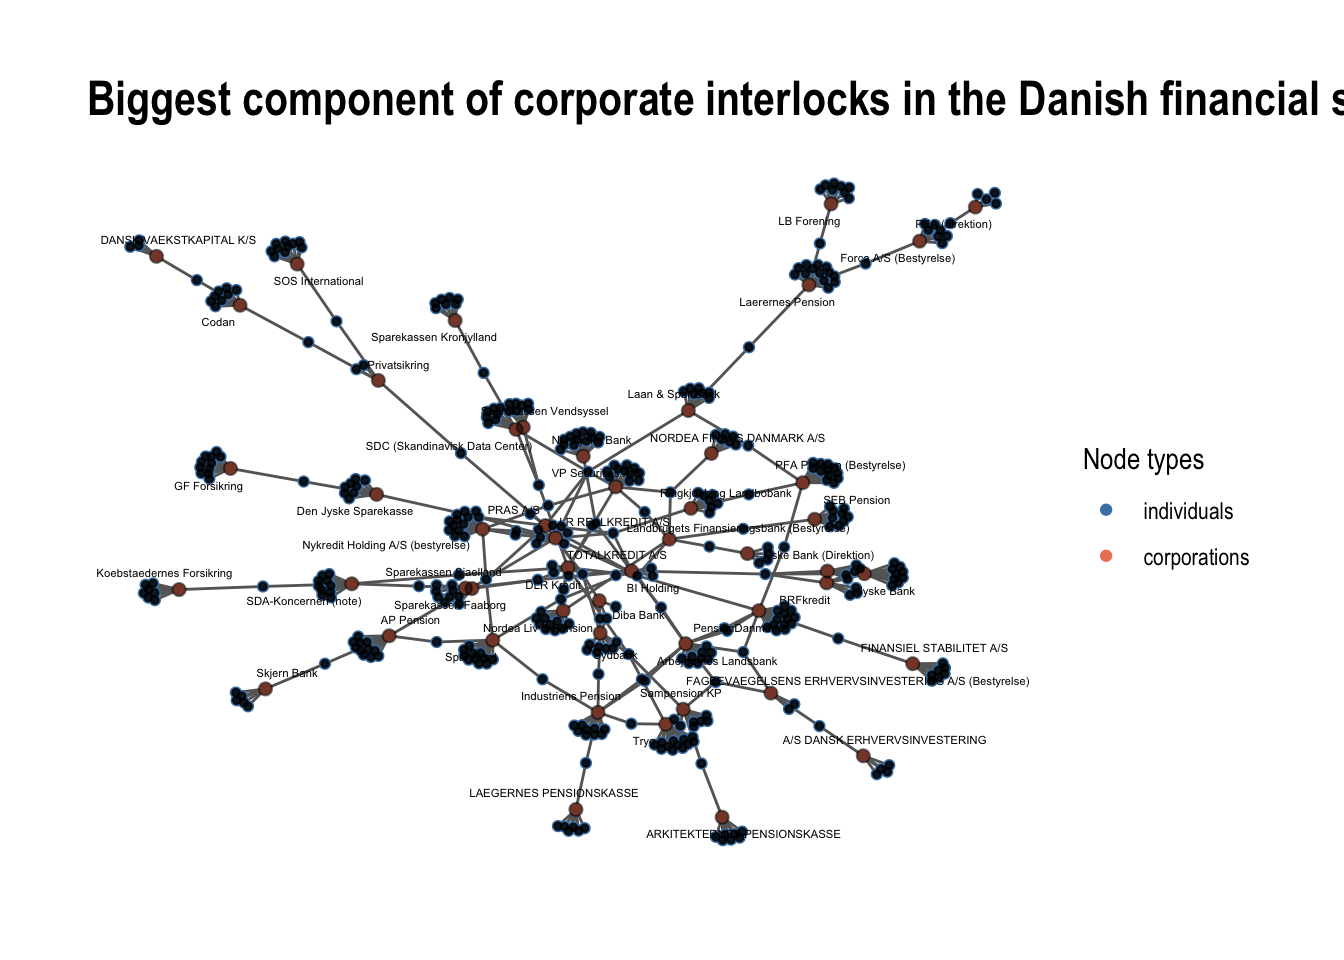
3.4 Adding graph attributes to one-mode networks
If you want to visualize certain aspects of the underlying raw data, you have to first add them as graph attributes. Adding attributes from the original raw data can be more complicated than adding graph-specific attributes such as distance or degree.
3.4.1 Attributes for person one-mode network
Here, I show how you can add the gender of the person as a graph attribute.
# we want to add attributes to the person one-mode network gr1

# first, make a tibble where you make a name and gender column
a1 <- tibble(
  name = V(gr1)$name,
  gender = finance %>% count(name, gender) %>% pull(gender)
)

# second, check if the sequence of names are similar in the tibble and the graph object and then add it
all.equal(V(gr1)$name, a1$name)
## [1] TRUE
# add it as a vertex attribute
V(gr1)$gender <- a1$gender

# visualize
gr1 %>%
  ggraph("fr") +
  geom_edge_link0(color = "gray40") +
  geom_node_point(aes(color = gender), size = 1) +
  theme_graph()
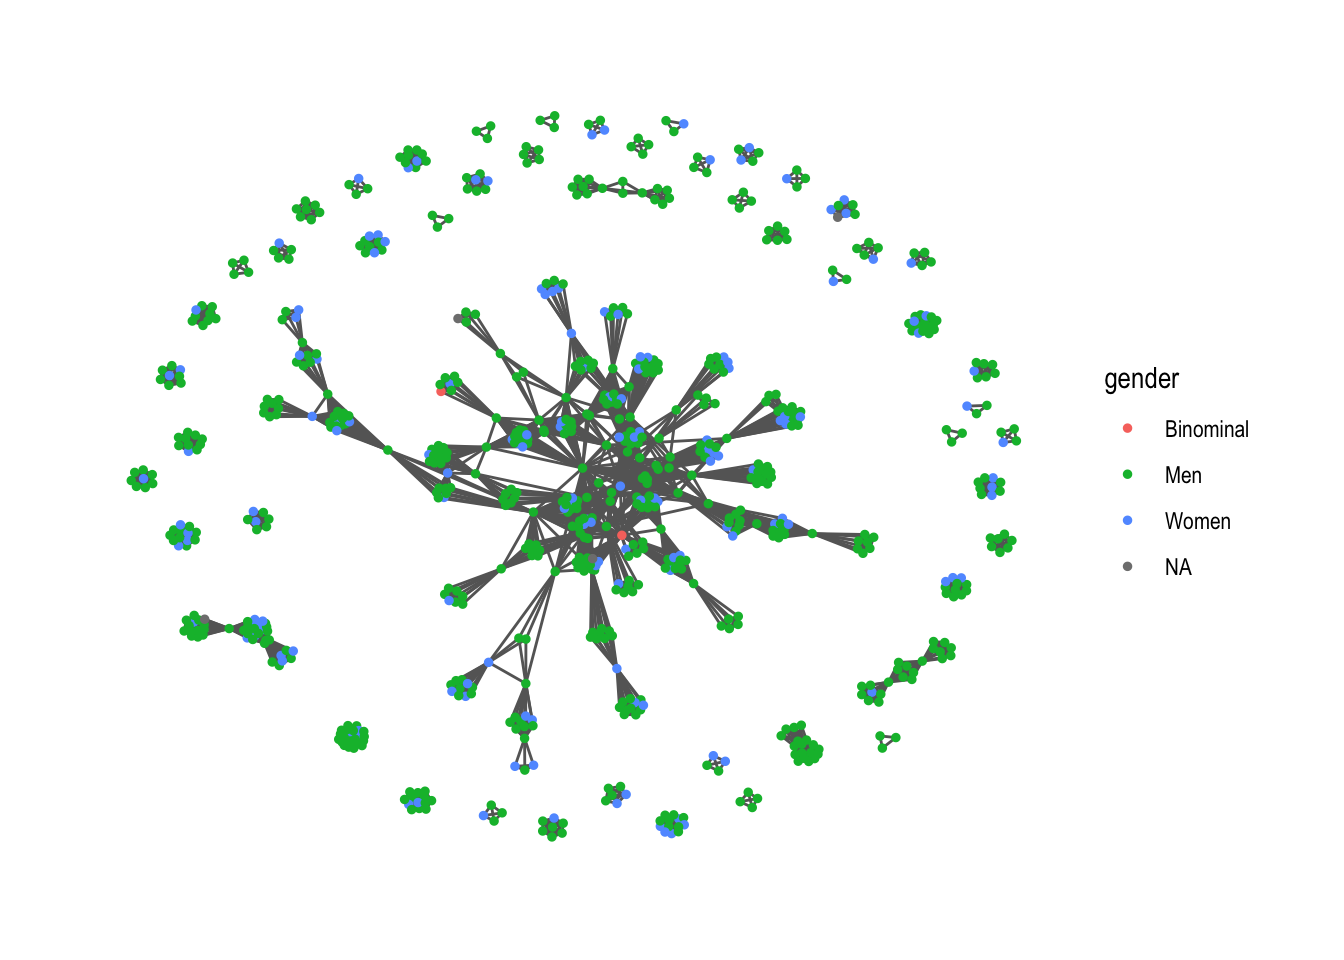
3.4.1 Attributes for corporate one-mode network
Here, I show how you can add the sector of a corporation as a graph attribute
# remember that the corporate network is made from the object finance which includes the tags Banks, Finance and Pension
# first, we make an affiliation sub set for each.
bank <- has.tags(den1, "Banks", "affil")
##       Matched positions
## Banks               354
##
##
fin <- has.tags(den1, "Finance", "affil")
##         Matched positions
## Finance               881
##
##
pension <- has.tags(den1, "Pensions", "affil")
##          Matched positions
## Pensions               217
##
##
# second, we create a data frame which binds three data frames together into one. We give each node a tag name.

a1 <- rbind(
  tibble(name=fin, tag ="finance"),
  tibble(name=bank, tag ="bank"),
  tibble(name=pension, tag ="pension")
)

# second, we make an incidence matrix
a2 <- xtabs(formula = ~ name + tag, data = a1, sparse = T)

# change matrix to tibble format
a2 <- a2 %>% as.matrix() %>% as_tibble(rownames = "name")

# let us look at the object
a2
## # A tibble: 108 × 4
##    name                                                     bank finance pension
##    <chr>                                                   <dbl>   <dbl>   <dbl>
##  1 A/S DANSK ERHVERVSINVESTERING                               0       1       0
##  2 ALD Automotive                                              0       1       0
##  3 Alm. Brand                                                  0       1       0
##  4 Alpha Holding                                               0       1       0
##  5 ALTOR EQUITY PARTNERS A/S                                   0       1       0
##  6 AP Pension                                                  0       1       1
##  7 Arbejdernes Landsbank                                       1       1       0
##  8 ARKITEKTERNES PENSIONSKASSE                                 0       0       1
##  9 Bank DNB Nord                                               1       1       0
## 10 BDO - Statsautoriseret revisionsaktieselskab (bestyrel…     0       1       0
## # ℹ 98 more rows
The object a2 denotes 1 if a corporation belongs to a sector and 0 if it does not. With this information, we can use the filter() function to make vectors with different names depending on the possible firm types. Consequently, each firm type is assigned to the firmtpye attribute.
# make vectors with different names depending on the possible firm types
only_bank <- a2 %>% filter(bank==1 & finance==0 & pension ==0) %>% pull(name)
only_finance <- a2 %>% filter(bank==0 & finance==1 & pension ==0) %>% pull(name)
only_pension <- a2 %>% filter(bank==0 & finance==0 & pension ==1) %>% pull(name)
bank_finance <- a2 %>% filter(bank==1 & finance==1 & pension ==0) %>% pull(name)
bank_pension <- a2 %>% filter(bank==1 & finance==0 & pension ==1) %>% pull(name)
finance_pension <- a2 %>% filter(bank==0 & finance==1 & pension ==1) %>% pull(name)
bank_finance_pension <- a2 %>% filter(bank==1 & finance==1 & pension ==1) %>% pull(name)


# make an empty network attribute
V(gr2)$firmtype <- NA

# rename for reach firm type
V(gr2)$firmtype[which(V(gr2)$name %in% only_bank)] <- "only_bank"
V(gr2)$firmtype[which(V(gr2)$name %in% only_finance)] <- "only_finance"
V(gr2)$firmtype[which(V(gr2)$name %in% only_pension)] <- "only_pension"
V(gr2)$firmtype[which(V(gr2)$name %in% bank_finance)] <- "bank_finance"
V(gr2)$firmtype[which(V(gr2)$name %in% bank_pension)] <- "bank_pension"
V(gr2)$firmtype[which(V(gr2)$name %in% finance_pension)] <- "finance_pension"
V(gr2)$firmtype[which(V(gr2)$name %in% bank_finance_pension)] <- "bank_finance_pension"

# Look at the result
V(gr2)$firmtype
##   [1] "only_finance"         "only_finance"         "only_finance"
##   [4] "only_finance"         "only_finance"         "finance_pension"
##   [7] "bank_finance"         "only_pension"         "bank_finance"
##  [10] "only_finance"         "only_finance"         "only_finance"
##  [13] "bank_finance"         "only_finance"         "only_finance"
##  [16] "only_finance"         "only_finance"         "only_finance"
##  [19] "finance_pension"      "only_finance"         "bank_finance"
##  [22] "bank_finance"         "only_finance"         "bank_finance"
##  [25] "bank_finance"         "bank_finance"         "only_finance"
##  [28] "bank_finance"         "bank_finance"         "only_finance"
##  [31] "only_finance"         "only_finance"         "bank_finance"
##  [34] "bank_finance"         "only_pension"         "only_finance"
##  [37] "only_finance"         "finance_pension"      "only_finance"
##  [40] "only_pension"         "only_finance"         "bank_finance"
##  [43] "bank_finance"         "only_finance"         "only_finance"
##  [46] "only_finance"         "bank_finance"         "only_pension"
##  [49] "finance_pension"      "bank_finance"         "finance_pension"
##  [52] "only_finance"         "only_finance"         "only_finance"
##  [55] "only_finance"         "only_finance"         "bank_finance"
##  [58] "finance_pension"      "only_finance"         "bank_finance"
##  [61] "only_finance"         "bank_finance_pension" "bank_finance_pension"
##  [64] "bank_finance"         "only_finance"         "only_finance"
##  [67] "only_finance"         "bank_finance"         "bank_finance"
##  [70] "only_finance"         "bank_finance"         "finance_pension"
##  [73] "finance_pension"      "finance_pension"      "only_pension"
##  [76] "finance_pension"      "only_finance"         "only_finance"
##  [79] "only_finance"         "only_finance"         "bank_finance"
##  [82] "finance_pension"      "only_finance"         "only_finance"
##  [85] "only_finance"         "only_finance"         "only_finance"
##  [88] "only_finance"         "finance_pension"      "finance_pension"
##  [91] "bank_finance"         "only_finance"         "bank_finance"
##  [94] "bank_finance"         "bank_finance"         "bank_finance"
##  [97] "bank_finance"         "bank_finance"         "bank_finance"
## [100] "bank_finance"         "only_finance"         "only_finance"
## [103] "only_finance"         "only_finance"         "only_finance"
## [106] "bank_finance"         "only_finance"         "bank_finance"
Last, we select the largest component, and visualize the network with firmtype as the color node attribute.
# Select largest component
complist <- components(gr2)
comps <- decompose.graph(gr2)

index <-
  table(complist$membership) %>%
  as_tibble(.name_repair = make.names) %>%
  arrange(desc(n)) %>%
  mutate(X = as.numeric(X)) %>%
  pull(1)

comp1 <- comps[[index[1]]]

# visualize
comp1 %>%
  ggraph(layout = "fr") +
  geom_edge_link0(width=.5, alpha=0.4) +
  geom_node_point(aes(color=firmtype), size=4) +
  geom_node_label(aes(color=firmtype, label=name), size=2, nudge_y=-0.05, repel=TRUE) +
  theme_graph()
## Warning: ggrepel: 50 unlabeled data points (too many overlaps). Consider
## increasing max.overlaps